Final Report - ICPDR
Final Report - ICPDR
Final Report - ICPDR

You also want an ePaper? Increase the reach of your titles
YUMPU automatically turns print PDFs into web optimized ePapers that Google loves.
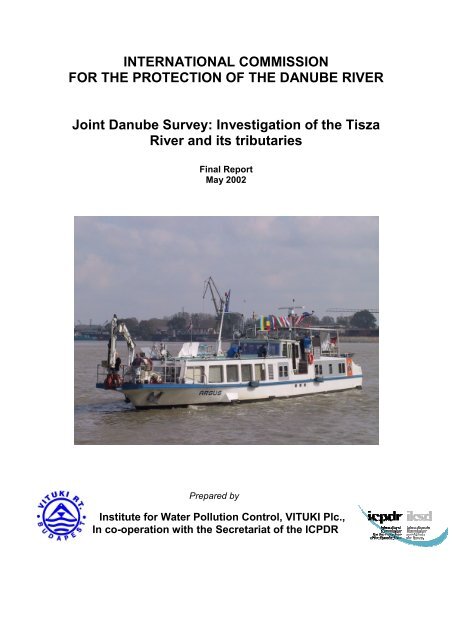
INTERNATIONAL COMMISSION<br />
FOR THE PROTECTION OF THE DANUBE RIVER<br />
Joint Danube Survey: Investigation of the Tisza<br />
River and its tributaries<br />
<strong>Final</strong> <strong>Report</strong><br />
May 2002<br />
Prepared by<br />
Institute for Water Pollution Control, VITUKI Plc.,<br />
In co-operation with the Secretariat of the <strong>ICPDR</strong>
Table of Content<br />
1 Preface -------------------------------------------------------------------------------------------3<br />
2 Background and objectives---------------------------------------------------------------4<br />
3 Preparation for the ITR survey -----------------------------------------------------------5<br />
3.1 Sampling plan and sites --------------------------------------------------------------5<br />
3.2 Arrangements for the survey -------------------------------------------------------8<br />
3.2.1 Core Team----------------------------------------------------------------------------8<br />
3.2.2 National Teams---------------------------------------------------------------------8<br />
3.2.3 Sample types and treatment in the field-----------------------------------9<br />
3.2.4 On board analytical methods------------------------------------------------ 11<br />
3.2.5 Biological methods ------------------------------------------------------------- 11<br />
4 Results and discussion ------------------------------------------------------------------ 13<br />
4.1 Chemical status characterization------------------------------------------------ 13<br />
4.1.1 On board analysis of water--------------------------------------------------- 13<br />
4.1.2 Inorganic micropollutants in water---------------------------------------- 18<br />
4.1.3 Inorganic micropollutants in suspended solids, sediment and<br />
mussels ---------------------------------------------------------------------------- 27<br />
4.1.4 Comparison of heavy metal data to other results-------------------- 40<br />
4.1.5 Organic micropollutants ------------------------------------------------------ 41<br />
4.2 Ecological status characterization---------------------------------------------- 62<br />
4.2.1 Phytoplankton -------------------------------------------------------------------- 62<br />
4.2.2 Rotatoria and crustacea zooplankton ------------------------------------ 65<br />
4.2.3 Macroinvertebrates ------------------------------------------------------------- 73<br />
4.2.4 Multivariate analysis of macroinvertebrates --------------------------- 88<br />
5 Investigation of Tisa River- Fish fauna---------------------------------------------- 91<br />
5.1 Introduction ----------------------------------------------------------------------------- 91<br />
5.2 Methods ---------------------------------------------------------------------------------- 92<br />
5.3. Results and discussion ------------------------------------------------------------ 95<br />
6. Conclusions ------------------------------------------------------------------------------- 107<br />
References------------------------------------------------------------------------------------- 111
1 Preface<br />
The Investigation of the Tisza River (ITR) project was an international expedition<br />
carried out on the Tisza River by a long-sectional sampling using a German<br />
Laboratory ship, ARGUS. The program directly followed the Joint Danube Survey<br />
(JDS). The mission was organised by the Secretariat of the International Commission<br />
for the Protection of the Danube River (<strong>ICPDR</strong>) in Vienna. The Hessian Agency for<br />
the Environment and Geology (Wiesbaden, Germany) provided the Laboratory Ship<br />
to perform the ITR program. It was a follow-up activity to the pollution caused by<br />
cyanide and heavy metal from accidents that happened in February and March 2000<br />
on the Szamos and Tisza Rivers. One of the objectives of the survey was to detect<br />
the present environmental situation on the River Tisza and its main tributaries one<br />
and a half year after these accidents.<br />
Similarly to the JDS mission, an international team of experts formed the Core Team<br />
of scientists during the ITR expedition. In addition to that several National Teams<br />
were formed from the experts of the Regional Environmental Inspectorates that<br />
joined the ITR expedition at the particular Tisza sections.<br />
The Study was financially supported by the European Commission. Essential in-kind<br />
contribution was received from the Government of Germany. The Tisza riparian<br />
countries (Romania, Slovakia, Yugoslavia and Hungary) also provided important<br />
support to the expedition. The Tisza Survey was organized by the Secretariat of the<br />
<strong>ICPDR</strong> (Igor LISKA, Project Coordinator, Jaroslav SLOBODNIK, Logistics Officer)<br />
providing help to the overall organization and financial planning. The Water<br />
Resources Research Center Plc. (VITUKI Rt.). Budapest, Hungary assured technical<br />
coordination.<br />
The sampling mission was carried out between 28 September and 10 October 2001.<br />
The samples were analyzed in Hydrometeorological Institute, Belgrade, in the VUVH,<br />
Bratislava, and in the VITUKI, Budapest. Béla CSÁNYI (Project Manager) and<br />
Ferenc LÁSZLÓ (Director, Institute for Water Pollution Control, VITUKI) prepared the<br />
ITR report with the contributions of Petra Stahlschmidt-Allner (Germany), Carmen<br />
Hamchevici (Romania), Jarmila Makovinská (Slovak Rebublic), Jovanka Ignjatovic<br />
(Federal Rebublic of Yugoslavia). The report was reviewed by the Monitoring,<br />
Laboratory and Information Management expert group of the <strong>ICPDR</strong>. The findings,<br />
interpretations and conclusions of the ITR Study are available in the <strong>ICPDR</strong> web site<br />
as part of the JDS international sampling program itself.<br />
3
2 Background and objectives<br />
Several (acute and chronic) accident pollution happened in the Tisza River during the<br />
year of 2000 due to industrial activities in the upper (Ukrainian and Romanian)<br />
watershed. Reliable and comparable information on chemical and biological status is<br />
necessary in order to describe the effect of the pollution events, and to compare the<br />
present pollution level to any future post-pollution situation.<br />
German and Hungarian scientists agreed to perform the “Investigation of the Tisza<br />
River (ITR)” to study the environmental effects of the acute cyanide pollution and<br />
frequent chronic heavy metal pollution accidentally occurring in the Tisza River Basin.<br />
The ITR program followed directly the Joint Danube Survey (JDS) organised by the<br />
MLIM EG of the International Commission for the Protection of the Danube River<br />
(<strong>ICPDR</strong>) after it was finished in the Danube Delta on the 20th of September 2001. The<br />
overall objective of the ITR was to undertake a longitudinal ship survey of the Tisza<br />
River to produce comparable and reliable information on the quality of different<br />
compartments of the aqueous ecosystem (sediment, suspended solids, mussel,<br />
macroinvertebrate and fish species) with focus on chemical and biological<br />
determinands.<br />
Earlier national monitoring program was performed in Hungary between 2000 and 2002<br />
sponsored by the Hungarian Ministry of Environment. The purpose of the study was to<br />
describe the acute effect of the cyanide and heavy metal pollutions together with the<br />
investigation of further effects of the polluting compounds on the aquatic environment.<br />
Seasonal investigations were performed on the macroinvertebrates and detailed<br />
analysis was done on the heavy metal pollution of the sediment fraction after the main<br />
Tisza flooding period of the Tisza in April 2000. Data collected during that period are<br />
ready for comparison of the present ITR in order to describe the environmental effects<br />
on this short time scale.<br />
VITUKI Plc, Budapest, Hungary in co-operation with the Hydrometeorological Institute,<br />
Belgrade, Federal Republic of Yugoslavia, performed a special sampling program<br />
„Study on Bioindicators, Inorganic and Organic Micropollutants in Selected Bioindicator<br />
Organism in the River Danube” during the summer period of 2000. It was a follow-up<br />
activity after the UNEP/OCHA Balkan Task Force Mission, which investigated the<br />
environmental impacts of the Kosovo conflict in FRY in 1999. The major aim of the<br />
Study on Bioindicators was to investigate the presence and accumulation of organic<br />
and inorganic micropollutants in sediments and biota and to analyse the<br />
macrozoobenthos in the Danube reach and its main tributaries impacted by the Kosovo<br />
conflict. The Study was financially supported by the governments of Germany and<br />
Austria and organized by the Secretariat of the <strong>ICPDR</strong>. The collected data on<br />
micropollutant compounds are available for comparison in case of the ITR results, as<br />
well.<br />
The intention of the JDS - ITR project was to use the same sampling and laboratory<br />
expertise that had been applied for the JDS expedition, and, in the Danube countries,<br />
as well. Additionally, it seemed to be useful to use the same resources that have the<br />
necessary level of analytical instrumentation and operate with proven acceptable<br />
AQC procedures. Therefore the goals of the ITR survey were as same as for the<br />
JDS:<br />
4
• To produce a homogenous data set for the Tisza River based on the analysis of<br />
specified determinant(s).<br />
• To provide a forum for participation of riparian/river basin country in sampling<br />
and inter-comparison exercises (German, Romanian, Slovakian, Yugoslavian<br />
and Hungarian experts).<br />
• To facilitate specific training needs and improve in-country experience.<br />
• To promote public awareness.<br />
• To indicate the special attention of the European Community to the<br />
environmental issues of East-European transboundary rivers<br />
The documentation of the survey activities concerning the sampling and analytical<br />
techniques will serve as a training material for widespread distribution in Danube<br />
countries. The final reports of the JDS and the ITR would like to help in strengthening<br />
the public awareness within the <strong>ICPDR</strong> countries.<br />
3 Preparation for the ITR survey<br />
3.1 Sampling plan and sites<br />
Similarly to the sampling plan of the JDS mission, on board analysis of water,<br />
sampling the sediment and the suspended solids, and, different hydrobiological<br />
investigations were carried out in the same time during the ITR program. The<br />
sampling of phyto- and zooplankton together with the macroinvertebrate community<br />
were included during the mission. Parallel to the program of ARGUS, a fish-biological<br />
group from Germany was working with the help of a Hungarian expert to sample<br />
different fish species in order to carry out physiological studies concerning the<br />
possible effects of endocrine disrupters on fish.<br />
According to the approved timetable of the ITR, the Core Team members and the<br />
ARGUS met in Belgrade on a press conference on 28 September, exactly one week<br />
later than the JDS mission was finished in Tulcea. The first sampling cross section<br />
was reached on 29 th in Titel, 2 kms upstream from the Danubian confluence. Due to<br />
the rainy weather few weeks earlier, there were flooding conditions in the Tisza and<br />
its tributaries, especially in the Maros River during the sampling mission.<br />
Altogether 27 sampling sites were included in the ITR program, 20 of which were<br />
situated in the Tisza River, and 7 in the main tributaries. Four sites were included in<br />
the Yugoslavian stretch. Table 3.1 indicates the sampling locations and Figure 5.1<br />
illustrates their spatial distribution in the map.<br />
The Tisza is navigable at normal (middle) water level up to Vásárosnamény-<br />
Gergelyiugornya. Due to the fast decrease of water level during the final stage of the<br />
ITR program, the upper four Tisza section and the Szamos were sampled by car in<br />
order to avoid shipping problems.<br />
5
Table 3.1 Sampling stations along the Tisza River and its tributaries during the<br />
JDS Investigation of the Tisza (ITR) international sampling mission<br />
Station No. Country<br />
Town/Location or Tributary<br />
Name<br />
Km-index Date of sampling<br />
ITR 1 YU Titel, Danubian confluence 2 2001.09.29<br />
ITR 2 YU Bega Navigable Canal 3 2001.09.29<br />
ITR 3 YU Novi Becej 66 2001.09.29<br />
ITR 4 YU Novi Knezevac 147 2001.09.30<br />
ITR 5 YU, H Szeged, old city bridge 174 2001.10.01<br />
ITR 6 H Maros, Makó 172 2001.10.01<br />
ITR 7 H Mindszent 216 2001.10.02<br />
ITR 8 H Hármas-Körös, Kunszentmárton 234 2001.10.02<br />
ITR 9 H Tiszaug, híd 266 2001.10.03<br />
ITR 10 H Szolnok 334 2001.10.03<br />
ITR 11 H Zagyva, Szolnok 335,6 2001.10.03<br />
ITR 12 H Kisköre 404 2001.10.04<br />
ITR 13 H<br />
Aranyosi-sziget (Kisköre<br />
Reservoir)<br />
419 2001.10.04<br />
ITR 14 H Tiszafüred-Poroszló 431 2001.10.04<br />
ITR 15 H Tiszacsege 453 2001.10.05<br />
ITR 16 H Polgár 498 2001.10.05<br />
ITR 17 H Sajó, Kesznyéten 492 2001.10.05<br />
ITR 18 H Rakamaz-Tokaj 544 2001.10.06<br />
ITR 19 H Bodrog, Bodrogkeresztúr 544 2001.10.06<br />
ITR 20 H Tiszabercel 569 2001.10.07<br />
ITR 21 H Dombrád 592 2001.10.07<br />
ITR 22 H Tuzsér 616 2001.10.07<br />
ITR 23 H Aranyosapáti 669 2001.10.08<br />
ITR 24 H Gergelyiugornya 685 2001.10.08<br />
ITR 25 H Szamos, Tunyogmatolcs 686 2001.10.08<br />
ITR 26 H Tivadar 705 2001.10.08<br />
ITR 27 H Tiszabecs 744 2001.10.08<br />
Colour indication:<br />
ITR No. X Sampling sites on the Tisza River<br />
ITR No. Y Sampling sites on the tributaries<br />
Note that river km-s of tributaries indicate the position of cross section of confluence<br />
instead of the real sampling location. Sampling site of the cross section in tributaries<br />
usually situated 2 km upstream the confluence.<br />
6
3.2 Arrangements for the survey<br />
3.2.1 Core Team<br />
The main contractor (VITUKI Rt.) provided four persons to the Core Team. One<br />
scientist from Romania, Slovakia and Yugoslavia were included also in the Core<br />
Team from the beginning of the ITR program. In the German fish-biological team two<br />
Core Team members and five joining colleagues followed the ARGUS ship by car<br />
between 29 September and 5 October carrying out local fishing activity with an<br />
Hungarian ichthyologist. They met the ARGUS team in Tokaj and since then they<br />
were dealing with the sample processing activity on the board.<br />
The names of scientists in the Core Team and in the joining group are as follows.<br />
Position Name Responsibility<br />
Bela Csanyi<br />
JDS ITR Core Team<br />
Leader<br />
Sampling suspended solids and fractionation of<br />
sediments; dredging, sampling zooplankton,<br />
macrozoobenthos and mussels.<br />
Chemist<br />
Carmen Hamchevici On-board determinations of nutrients.<br />
Biologist Momir Paunovic Grabbing, sampling macrozoobenthos, on-board<br />
selection.<br />
Jarmila Makovinska On-board determinations of chlorophyll-a and sampling<br />
of phytoplankton.<br />
Peter Juhasz Dredging, sampling macrozoobenthos and mussels, onboard<br />
selection.<br />
Viktoria Kavran Grabbing, sampling macrozoobenthos, on-board<br />
selection.<br />
Driver Pal Kaszonyi Logistics arrangements.<br />
JDS ITR ElectrofishingPetra Stahlschmidt-Investigation on fish indicator species. Analysis of<br />
Team<br />
Allner<br />
indicator species parazitisation.<br />
Bernhard Allner<br />
JDS ITR ExtendedEgbert Korte<br />
Electrofishing Team<br />
Zoltan Sallai<br />
Nadia Nikutowsky<br />
Annette Schaat<br />
3.2.2 National Teams<br />
Silke Dehe<br />
Andre Beltz<br />
Co-ordination between electrofishing and lab-based fish<br />
investigation, blood sampling.<br />
Electrofishing taxonomic analyses.<br />
Electrofishing taxonomic analyses.<br />
Electrofishing.<br />
Sex determination, tissue sampling, tissue sampling<br />
management (storage registration).<br />
Sex determination, tissue sampling, tissue sampling<br />
management (storage registration).<br />
Electrofishing, taxonomic analyses tissue sampling.<br />
There are five adjacent Regional Environmental Inspectorates along the Hungarian<br />
Tisza section. Their names from the downstream section to the Upper Tisza are as<br />
follows:<br />
Lower Tisza Valley Environmental Inspectorates, Szeged;<br />
Middle Tisza Valley Environmental Inspectorates, Szolnok;<br />
Trans-Tisza Environmental Inspectorates, Debrecen;<br />
North Hungarian Environmental Inspectorates, Miskolc;<br />
Upper Tisza Valley Environmental Inspectorates, Nyíregyháza.<br />
8
Hydrobiologists and chemists joined the different Tisza sections in order to carry out<br />
their routine sampling program in the given sampling locations. In the mean time they<br />
had the opportunity to follow and practice the sampling procedures that were used by<br />
the Core Team on the board, as well.<br />
3.2.3 Sample types and treatment in the field<br />
Water was sampled at each sampling site from the middle of the stream to carry out<br />
on-board analysis for the following components:<br />
pH, dissolved oxygen, water temperature, electric conductivity, alkalinity, ammonium,<br />
nitrite, nitrate, orthophosphate, chlorophyll-a. ITR 1 – ITR 22: samples were taken<br />
using the facilities provided by the German laboratory-ship ARGUS. ITR 23 – ITR 27:<br />
samples were taken using cars; therefore the general parameters (temperature, pH,<br />
dissolved oxygen and conductivity) couldn’t be recorded on the upper stretch. Due to<br />
the fact that on-board analyses were carried out immediately after sampling and<br />
preparation of water samples, no preservation method was used.<br />
Phyto- and zooplankton samples from 27 locations of the Tisza River and its<br />
tributaries were collected. Lugol solution was used for the preservation of the<br />
plankton samples. Rotatoria and Crustacea (Cladocera, Copepoda) species were<br />
determined from filtered samples. Species composition and individual abundance<br />
values were determined for each sampling section. Based on the results assessment<br />
is given on the water quality of the river and its tributaries. Recent results are<br />
compared to former studies.<br />
Sediment, suspended solids, mussel and macroinvertebrate samples were taken<br />
during the ITR from 27 sampling stations, 20 from the Tisza River and 7 from the<br />
main tributaries, respectively. Sampling at each station includes these four sample<br />
types, and three of them (i.e. sediment, suspended solids and mussel samples) were<br />
analysed according to the attached determinant list (Table 2). Surface layer of<br />
sediment was collected in the Tisza River and its tributaries at 27 sampling locations.<br />
Particularly those habitats were included that are characterised by significant<br />
sedimentation in order to pick up the finer sediment fraction than 63 µm. Average<br />
sample was prepared from the two sub-samples taken at left and right at each given<br />
station cross sections. In case of the Tisza River (and its tributaries) the total mixing<br />
process happens in relatively short distance.<br />
On-board grain size fractionation with wet sieving were done from the average<br />
sediment samples in order to receive fraction less than 63 microns, for later analyses<br />
of heavy metals, PAHs, PCBs and organo-chlorinated compounds similarly to the<br />
JDS program. Sample analysis was carried out in the VITUKI Laboratory.<br />
Mussel species were collected from the sampling sites if there were living specimens.<br />
Direct diving, grabbing and dredging were used when picking up the mussel<br />
specimens from the inhabited zone of the Tisza and its tributaries. The same<br />
micropollutants compounds were determined in the mussels as it is described in case<br />
of the sediment and suspended solid samples (Table 3.2). Mussel samples were<br />
preserved by deep freezing for later analyses of heavy metals, PAHs, PCBs and<br />
organo-chlorinated compounds and they were analysed in the VITUKI Laboratory, as<br />
well.<br />
9
The macroinvertebrate community structure was determined (relative abundance of<br />
taxa) and based on these taxonomic results, the Saprobity index was determined<br />
using the saprobic list of the Austrian Fauna Aquatica Austriaca (Table 3.3). Living<br />
macroinvertebrate samples were selected during on-board activity. The rest of the<br />
unfinished samples were preserved in the ethanol solution (70 %).<br />
Sampling, sample processing and the results referring to the fish investigations are<br />
given in the Annex I.<br />
Table 3.2. List of determinands in sediment, suspended solids and mussel<br />
samples including relevant additional information<br />
Determinand<br />
Unit<br />
Method<br />
used<br />
Limit of<br />
quantification<br />
[LOQ]<br />
Accreditation<br />
[YES/NO]<br />
Heavy metals<br />
Cadmium (Cd) mg/kg L-AAS 0.3 Yes<br />
Chromium (Cr) – total mg/kg L-AAS 0.8 Yes<br />
Copper (Cu) mg/kg L-AAS 0.5 Yes<br />
Lead (Pb) mg/kg L-AAS 1.5 Yes<br />
Mercury (Hg) mg/kg CW-AAS 0.002 Yes<br />
Nickel (Ni) mg/kg L-AAS 0.7 Yes<br />
Zinc (Zn) mg/kg L-AAS 0.2 Yes<br />
Aluminum (Al) mg/kg L-AAS Yes<br />
Arsenic (As) mg/kg L-AAS Yes<br />
Organic compounds<br />
PAH – 16 EPA mg/kg SPE/GC/MS 0.005 Yes<br />
PCB – 7 (each) mg/kg SPE/GC/MS 0.005 Yes<br />
Lindane (gammahexachlorocylohexane)<br />
mg/kg SPE/GC/MS 0.001 Yes<br />
Hexachlorobenzene mg/kg SPE/GC/MS 0.001 Yes<br />
Hexachlorobutadiene mg/kg SPE/GC/MS 0.005 No<br />
Pentachlorobenzene mg/kg SPE/GC/MS 0.005 Yes<br />
pp’DDT mg/kg SPE/GC/MS 0.001 Yes<br />
Table 3.3. List of determinands in macroinvertebrate samples<br />
Determinand Method used Instrumentation used<br />
Macrozoobenthos (No. of Taxa) Evaluation of semi-Stemquantitative data<br />
2000 stereomicroscope<br />
Macrozoobenthos (Sapr. Index) Quantity measured onZelinka-Marvan method, saprobe<br />
interval scale<br />
values based on Fauna Aquatica<br />
Austriaca<br />
10
3.2.4 On board analytical methods<br />
Preparation:<br />
Water samples were filtered using membrane filtration (0.45 µm pore size); filters<br />
were stored at 4 0 C for later determination of suspended solids concentration; filtered<br />
water was used for on-board and laboratory analyses of nutrients<br />
Analyses:<br />
General parameters (temperature, pH, dissolved oxygen – concentration and<br />
saturation - and conductivity) were recorded using the facilities provided by the<br />
German laboratory-ship Argus (on-line WTW equipment);<br />
Alkalinity – analysis was carried out using unfiltered water samples, immediately after<br />
sampling, according to ISO 9963-1: Determination of total and composite alkalinity;<br />
Nutrients: analyses were carried out using filtered water samples, immediately after<br />
filtration, according to the below mentioned methods:<br />
N – NH 4 : ISO 7150/1: Determination of ammonium – manual spectrometric method;<br />
N – NO2: Standard Methods for the Examination of Water and Wastewater –<br />
sixteenth edition, Method no. 419;<br />
N – NO3: ISO 7890-3 Part 3: Spectrometric method using sulfosalycilic acid;<br />
P – PO4: Standard Methods for the Examination of Water and Wastewater –<br />
sixteenth edition, Method no. 424 F, ascorbic acid method;<br />
Reagents and chemicals: all the used on board reagents and chemicals were used<br />
according to the quality required by the above mentioned standards and were<br />
provided by VITUKI Institute.<br />
Instrumentation:<br />
on-line WTW equipment for general parameters;<br />
UV-VIS Spectrophotometer VARIAN 50 Cary for on-board analyses of nutrients<br />
Quality control:<br />
Checking the amount of substance concentration of the hydrochloric acid used for<br />
determination of alkalinity – every two days;<br />
Calibration curve for each nutrient parameter;<br />
Control sample analyzed at the beginning of each working day for each parameter.<br />
3.2.5 Biological methods<br />
Samples for species diversity of phytoplankton were taken by plankton net (mesh<br />
size 10 µm), while for the other analyses collected water samples were used.<br />
Identification of the cyanophytes/cyanobacteria and algae were done by light<br />
microscopy, abundancy (expressed as number of cells per 1 ml) was done by<br />
counting living organisms using Cyrus box. Content of chlorophyll-a was measured<br />
by two methods (ISO 10260 and by fluorimetry).<br />
Zooplankton samples were taken from the surface. 50 liters of water was filtered<br />
through 70 µm mesh size plankton net at each sampling location. Upon the filtering of<br />
the sample animals attached to the inner side of the net were washed to the<br />
collection vessel by immersing the net several times to water. After this procedure the<br />
collected material was quantitatively poured to the sample container glass. Applying<br />
Lugol solution achieving „cognac” color of filtrate was used to preserve samples.<br />
11
Species lists contain mainly the planktonic elements of Rotatoria and Crustacea<br />
(Cladocera, Copepoda). Nevertheless, there were tychoplanktonic species in the<br />
samples and species lists by chance. These were collected from the aqueous phase<br />
incidentally.<br />
Dissection of Cladocera and Copepoda species was conducted under stereoscopic<br />
microscope in 9%-os glycerin solution with dissection needles. Dissected body parts<br />
were placed to appropriate position using 200-400 times magnification for the<br />
identification of the species. The sample was investigated by counting the animals in<br />
whole sample for the quantitative investigations. Investigations were conducted in 5<br />
ml chambers using Utermöhl-type inverted microscope. Animal abundances are<br />
given in units of ind./100 liters. Taxon list containing the results of the qualitative<br />
investigations indicate frequently occurring and dominant species with italics – bold<br />
characters.<br />
Species identification was based on the following taxonomic books: BANCSI 1986,<br />
1988, NOGRADY 1993, SEGERS 1995, SMET and POURRIOT 1997, KOSTE 1978,<br />
KUTIKOVA 1970 (Rotatoria), FLÖSSNER 1972, GULYÁS 1974, GULYÁS and<br />
FORRÓ 1999, MANUJLOVA 1964 (Cladocera), DÉVAI 1977, DUSSART 1967, 1969,<br />
EINSLE 1993, GULYÁS and FORRÓ 2001 (Copepoda).<br />
List of sampling sites is given in Table 3.1. Quantitative and qualitative results of<br />
zooplankton investigations are given in Table 4.2.2.1 where bold character indicate<br />
the results of the tributaries. Last row of the tables contains the taxon number found<br />
in a given sampling location. Individual abundance values are given graphically also<br />
in Figure 4.2.2.1. Taxonomical determination of Rotatoria and Crustacea species was<br />
made by KATALIN ZSUGA(Middle Tisza Region Environmental Inspectorate,<br />
Szolnok).<br />
Macroinvertebrates (including mussel species) were collected on the right and left<br />
banks, respectively. An average sample was created from these two sub-samples.<br />
Both the hydraulic Polyp grab of the ARGUS and the FBI hand net having a mesh<br />
size of 950 µm were used for the sampling. In each cross section the combined data<br />
received by these two methods are taken into consideration. Qualitative taxon list<br />
illustrates presence/absence data. Relative abundance of taxa were expressed in a<br />
five step interval scale as follows:<br />
1: present (1-2 individuum/sample);<br />
2: rare;<br />
3: frequent;<br />
4: common;<br />
5: very common, masses.<br />
12
4 Results and discussion<br />
4.1 Chemical status characterization<br />
4.1.1 On board analysis of water<br />
Results measured on-board concerning the water samples are summarized in Table<br />
4.1.1.1 (Yellow color indicates the tributary samples). The water temperature was in<br />
the range of 15-16,7 o C, the pH values indicate slightly alkaline medium. The<br />
dissolved oxygen is not far from 100 % saturation along the whole Tisza, icluding the<br />
tributaries, except the Bega (2,9 mg/l DO– 32 %).<br />
The electric conductivity of the Tisza is around 300 µS/cm, conductivity values of the<br />
tributaries are a little higher (maximum value in the Sajó: 550 µS/cm). Alkalinity is<br />
smaller in the Tisza than in its tributaries (maximum value in the Zagyva: 7,3 mval/l).<br />
The amounts of the main inorganic nutrient compounds are indicated in Figures<br />
4.1.1.1-4.<br />
2,50<br />
2,00<br />
Concentration of NO3-N (mg/l)<br />
1,50<br />
1,00<br />
Tisza<br />
tributaries<br />
0,50<br />
0,00<br />
0 100 200 300 400 500 600 700 800<br />
Distance (km)<br />
Figure 4.1.1.1 Amount of NO 3 -N in the Tisza and its tributaries, ITR, 2001<br />
The amount of nitrate nitrogen is slightly decreasing in upstream direction after the<br />
Kisköre Reservoir. Maximum values are shown in the Zagyva and the Sajó reaching<br />
2,5 mg/l concentrations. The same tendency is shown on Table 4.1.1.2 where the<br />
nitrite nitrogen is illustrated. Tributaries such as the Bega and the Zagyva contained<br />
much more of this compound than the others and the Tisza itself (max. 0,066 mg/l).<br />
13
0,030<br />
0,025<br />
0,066<br />
mg/l<br />
0,057<br />
mg/l<br />
Contcentration of NO2-N (mg/l)<br />
0,020<br />
0,015<br />
0,010<br />
Tisza<br />
tributaries<br />
0,005<br />
0,000<br />
0 100 200 300 400 500 600 700 800<br />
Distance (km)<br />
Figure 4.1.1.2 Amount of NO 2 -N in the Tisza and its tributaries, ITR, 2001<br />
There are no large differences in the concentration of ammonium nitrogen in the<br />
Tisza and its tributaries, except the Bega again (Figure 4.1.1.3) where the maximum<br />
value was measured (0,73 mg/l).<br />
0,20<br />
0,18<br />
0,73<br />
mg/l<br />
0,16<br />
Concentration of NH4-N (mg/l)<br />
0,14<br />
0,12<br />
0,10<br />
0,08<br />
0,06<br />
Tisza<br />
tributaries<br />
0,04<br />
0,02<br />
0,00<br />
0 100 200 300 400 500 600 700 800<br />
Distance (km)<br />
Figure 4.1.1.3 Amount of NH 4 -N in the Tisza and its tributaries, ITR, 2001<br />
14
0,200<br />
0,180<br />
0,586<br />
mg/l<br />
0,160<br />
Concentration of PO4-P (mg/l)<br />
0,140<br />
0,120<br />
0,100<br />
0,080<br />
0,060<br />
Tisza<br />
tributaries<br />
0,040<br />
0,020<br />
0,000<br />
0 100 200 300 400 500 600 700 800<br />
Distance (km)<br />
Figure 4.1.1.4 Amount of orto-PO 4 -P in the Tisza and its tributaries, ITR, 2001<br />
The ITR sampling sites and four tributaries had the same amount of orthophosphate<br />
phosphorous. Three tributaries exceeded the average value (Figure 4.1.1.4): the<br />
Bega, the Sajó and the Zagyva. The last one was characterized by the large overall<br />
maximum value (0,526 mg/l).<br />
It can be concluded that the amounts of the most important inorganic nutrient<br />
substances were not high in the Tisza River. There were only few tributaries where<br />
extreme values were detected like the Bega (ammonium and nitrite nitrogen) and the<br />
Zagyva (orthophosphate phosphorous) most probably due to permanent organic<br />
load. In case of orthophosphate phosphorous concentration the Sajó has a little bit<br />
increased value also, due to the communal wastewaters of Miskolc city but this is not<br />
as much as in case of the Zagyva at all.<br />
In order to evaluate the nutrient load of the Tisza and its tributaries it seems to be<br />
worthwhile to take the concentration of chlorophyll-a in consideration, as well. The<br />
degree of trophity as the realized primary production in water due to planktonic<br />
eutrophycation can be explained this way.<br />
In case of the Tisza River it is clear that the concentration of chlorophyll-a is not high,<br />
especially in the Upper Tisza stretch. The maximum value was measured at the<br />
downstream end of the Kisköre Reservoir. However, the Zagyva River with the<br />
detected 73 µg/l chlorophyll-a concentration seems to be an outstanding water<br />
course in that respect, too. It looks like the key element in case of that explanation<br />
should be the phosphorous. The origin of o-phosphates is most probably the large<br />
number of villages and cities along the Zagyva that is characterized by small flow<br />
rate especially during late summer, early autumn.<br />
15
30<br />
72,93 ug/l<br />
25<br />
Concentration of Chlorophyll-a (ug/l)<br />
20<br />
15<br />
10<br />
Tisza<br />
Tributaries<br />
5<br />
0<br />
0 100 200 300 400 500 600 700 800<br />
Distance (km)<br />
Figure 4.1.1.5 The chlorophyll-a concentration along the Tisza and its<br />
tributaries<br />
16
Table 4.1.1.1 Results of the on-board water analysis during the ITR mission<br />
Station Country/ Km- Water pH Dissolved Oxygen Cond. Alk. NH4-N NO2-N NO3-N oPO4-P<br />
No. Countries Town/Location or Tributary Name Date of<br />
temp.<br />
Index sampling<br />
(0C)<br />
Mg/l % µS/cm mval/l mg/l mg/l mg/l mg/l<br />
ITR 1 YU Titel, Danubian confluence 2 29.Sept 16,5 7,52 7,6 81 310 2,0 0,07 0,018 0,92 0,065<br />
ITR 2 YU Bega Navigable Canal 3 29.Sept 17,8 7,19 2,9 32 400 2,6 0,73 0,066 0,88 0,130<br />
ITR 3 YU Novi Becej 66 30.Sept 16,4 7,59 6,7 71 300 3,0 0,05 0,015 0,98 0,065<br />
ITR 4 YU Novi Knezevac 147 30.Sept 16,2 7,45 7,6 81 300 2,0 0,05 0,006 1,14 0,065<br />
ITR 5 YU, H Szeged, old city bridge 172 01.Oct 16.0 7,61 7,6 83 320 2,1 0,04 0,012 1,09 0,065<br />
ITR 6 H Maros, Makó 178 01.okt 16,3 7,63 7,9 80 430 1,9 0,04 0,012 1,48 0,065<br />
ITR 7 H Mindszent 216 02.Oct 15,6 7,64 6,8 70 280 2,0 0,06 0,012 0,83 0,065<br />
ITR 8 H Hármas-Körös, Kunszentmárton 243 02.Oct 15,7 7,45 7,1 78 280 2,2 0,03 0,015 0,63 0,032<br />
ITR 9 H Tiszaug, híd 267 03.Oct 15,5 7,69 8,4 84 270 2,0 0,03 0,012 0,92 0,065<br />
ITR 10 H Szolnok 332 03.Oct 15,8 7,68 8,3 86 300 2,0 0,03 0,009 0,95 0,032<br />
ITR 11 H Zagyva, Szolnok 336 03.Oct - - - - - 7,3 0,03 0,057 2,42 0,586<br />
ITR 12 H Kisköre 406 04.Oct 15,5 7,71 7,6 78 320 2,2 0,05 0,018 0,89 0,065<br />
ITR 13 H Aranyosi-sziget (Kisköre Reservoir) 419 04.Oct 15,6 7,65 8,2 88 320 2,1 0,02 0,012 0,95 0,065<br />
ITR 14 H Tiszafüred-Poroszló 431 04.Oct 15,5 7,67 8,4 90 310 2,2 0,03 0,009 0,92 0,065<br />
ITR 15 H Tiszacsege 454 05.Oct 15,5 7,68 7,9 80 330 2,1 0,04 0,015 1,04 0,065<br />
ITR 16 H Polgár 487 05.Oct 15,4 7,68 9,2 92 310 1,9 0,04 0,009 0,92 0,065<br />
ITR 17 H Sajó, Kesznyéten 492 05.Oct 16,7 7,96 9,1 95 550 3,4 0,04 0,021 2,36 0,163<br />
ITR 18 H Rakamaz-Tokaj 544 06.Oct 16,0 7,74 8,5 87 330 2,1 0,05 0,009 0,80 0,032<br />
ITR 19 H Bodrog, Bodrogkeresztúr 544 06.Oct 16,2 7,51 7,4 79 310 2,4 0,10 0,024 0,90 0,065<br />
ITR 20 H Tiszabercel 569 07.Oct 16,0 7,70 9,2 93 330 2,2 0,03 0,009 0,80 0,065<br />
ITR 21 H Dombrád 592 07.Oct 16,2 7,71 8,5 89 340 2,1 0,02 0,006 0,75 0,032<br />
ITR 22 H Tuzsér 615 07.Oct 16,2 7,73 8,6 90 360 2,2 0,02 0,003 0,74 0,032<br />
ITR 23 H Aranyosapáti 675 08.Oct - - - - - 2,2 0,04 0,015 0,78 0,032<br />
ITR 24 H Gergelyiugornya 685 08.Oct - - - - - 2,1 0,02 0,003 0,55
4.1.2 Inorganic micropollutants in water<br />
In order to demonstrate the heavy metal content, the analysis of the Figure 4.1.2.1<br />
should be given to show the suspended solid concentration during the ITR sampling<br />
program. Large concentrations were detected especially on the Lower and Middle<br />
Tisza stretches (max value in Maros and Tisza at Szeged) because high flood was<br />
characteristic in the first half of the sampling program. There was one order of<br />
magnitude higher suspended sediment load (80 mg/l) measured in the Maros that<br />
indicated the different watershed of the later river. This high rate of suspended solids<br />
explains the usual higher concentrations of inorganic compounds in the Maros River.<br />
Suspended solids<br />
1000<br />
100<br />
mg/l<br />
tributaries<br />
Tisa river<br />
10<br />
1<br />
0 100 200 300 400 500 600 700 800<br />
Distance (km)<br />
Figure 4.1.2.1 Concentration of suspended solids during the ITR sampling<br />
program, 2001<br />
Mercury, cadmium, lead, chromium, copper, nickel, zinc, aluminum, iron, manganese<br />
and arsenic were analyzed in water, suspended solids, bottom sediment and mussel<br />
tissue. The proposal of the MLIM Expert Group for the water quality classification<br />
based on the results of the Transnational Monitoring Network in the Danube River<br />
Basin includes target values for the dissolved and total concentrations of the<br />
following metals:<br />
Metals Unit<br />
Target value Target value<br />
(dissolved forms) (total)<br />
Zinc µg/l 5 100<br />
Copper µg/l 2 20<br />
Chromium µg/l 2 50<br />
Lead µg/l 1 5<br />
Cadmium µg/l 0.1 1<br />
Mercury µg/l 0.1 0.1<br />
Nickel µg/l 1 50<br />
Arsenic µg/l 1 5<br />
18
Total mercury concentration was between >0.03 – 0.13 µg/l in the Tisza river. The<br />
highest value was measured downstream of the confluence of the Maros tributary,<br />
which discharged very high (0.25 µg/l) mercury concentration owing to the extreme<br />
large suspended solids content during flood period. The dissolved mercury<br />
concentrations were below the 0.1 µg/l limit value.<br />
The cadmium, lead, chromium, copper, nickel, zinc, aluminum, iron, manganese and<br />
arsenic total concentrations showed a similar longitudinal profile along the Tisza river<br />
as it was experienced for the mercury: moderately low values in the upper and<br />
middle section of the river and significant increase downstream of the Maros<br />
confluence. Only a minor part of the total metal content was in dissolved form. The<br />
dominant proportion of the metals was attached to suspended particles. The Figures<br />
4.1.2.2-12 illustrate the heavy metal content of original and filtered water samples in<br />
pairwise comparison.<br />
0,3<br />
0,25<br />
Tisza<br />
Tributaries<br />
Concentration of Hg (µg/l)<br />
0,2<br />
0,15<br />
0,1<br />
0,05<br />
0<br />
0 100 200 300 400 500 600 700 800<br />
Distance (km)<br />
Figure 4.1.2.2 Amount of Hg in the original water sample<br />
4,00<br />
3,50<br />
Concentration of Cd (ug/l)<br />
3,00<br />
2,50<br />
2,00<br />
1,50<br />
1,00<br />
Tisza<br />
Tributary<br />
0,50<br />
0,00<br />
0 100 200 300 400 500 600 700 800<br />
Distance (km)<br />
Figure 4.1.2.3 Amount of Cd in the original water sample<br />
19
140<br />
120<br />
concentration of Pb (µg/l)<br />
100<br />
80<br />
60<br />
40<br />
20<br />
0<br />
0 100 200 300 400 500 600 700 800<br />
Distance (km)<br />
Figure 4.1.2.4 Amount of Pb in the original water sample<br />
80<br />
70<br />
Concentration of Cr (ug/l)<br />
60<br />
50<br />
40<br />
30<br />
20<br />
10<br />
0<br />
0 100 200 300 400 500 600 700 800<br />
Distance (km)<br />
Figure 4.1.2.5 Amount of Cr in the original water samples<br />
The maximum value of chromium is due to the high suspended solid load of the<br />
Maros River at Szeged section at the sampling site. Similar high values of other<br />
heavy metal compounds are indicated in the other diagrams referring to the same<br />
reason (Figures 4.1.2.2-12).<br />
20
250<br />
200<br />
concentration of Cu (µg/l)<br />
150<br />
100<br />
50<br />
0<br />
0 100 200 300 400 500 600 700 800<br />
Distance (km)<br />
8<br />
7<br />
concentration of filtered Cu (µg/l)<br />
6<br />
5<br />
4<br />
3<br />
2<br />
1<br />
0<br />
0 100 200 300 400 500 600 700 800<br />
Distance (km)<br />
Figure 4.1.2.6 Amount of Cu in the original and filtered water samples<br />
21
60<br />
50<br />
concentration of Ni (µg/l)<br />
40<br />
30<br />
20<br />
10<br />
0<br />
0 100 200 300 400 500 600 700 800<br />
Distance (km)<br />
4,5<br />
4<br />
3,5<br />
concentration of filtered Ni (µg/l)<br />
3<br />
2,5<br />
2<br />
1,5<br />
1<br />
0,5<br />
0<br />
0 100 200 300 400 500 600 700 800<br />
Distance (km)<br />
Figure 4.1.2.7 Amount of Ni in the original and filtered water samples<br />
22
500<br />
450<br />
400<br />
concentration of Zn (µg/l)<br />
350<br />
300<br />
250<br />
200<br />
150<br />
100<br />
50<br />
0<br />
0 100 200 300 400 500 600 700 800<br />
Distance (km)<br />
30<br />
25<br />
concentration of filtered Zn (µg/l)<br />
20<br />
15<br />
10<br />
5<br />
0<br />
0 100 200 300 400 500 600 700 800<br />
Distance (km)<br />
Figure 4.1.2.8 Amount of Zn in the original and filtered water samples<br />
23
25000<br />
20000<br />
concentration of Al (µg/l)<br />
15000<br />
10000<br />
5000<br />
0<br />
0 100 200 300 400 500 600 700 800<br />
Distance (km)<br />
40<br />
35<br />
concentration of filtered Al (µg/l)<br />
30<br />
25<br />
20<br />
15<br />
10<br />
5<br />
0<br />
0 100 200 300 400 500 600 700 800<br />
Distance (km)<br />
Figure 4.1.2.9 Amount of Al in the original and filtered water samples<br />
24
35000<br />
30000<br />
concentration of Fe (µg/l)<br />
25000<br />
20000<br />
15000<br />
10000<br />
5000<br />
0<br />
0 100 200 300 400 500 600 700 800<br />
Distance (km)<br />
Figure 4.1.2.10 Amount of Fe in the original water sample<br />
1200<br />
1000<br />
concentration of Mn (µg/l)<br />
800<br />
600<br />
400<br />
200<br />
0<br />
0 100 200 300 400 500 600 700 800<br />
Distance (km)<br />
Figure 4.1.2.11 Amount of Mn in the original water sample<br />
25
20<br />
18<br />
16<br />
concentration of As (µg/l)<br />
14<br />
12<br />
10<br />
8<br />
6<br />
4<br />
2<br />
0<br />
0 100 200 300 400 500 600 700 800<br />
Distance (km)<br />
8<br />
7<br />
concentration of filtered As (µg/l)<br />
6<br />
5<br />
4<br />
3<br />
2<br />
1<br />
0<br />
0 100 200 300 400 500 600 700 800<br />
Distance (km)<br />
Figure 4.1.2.12 Amount of As in the original and filtered water samples<br />
26
4.1.3 Inorganic micropollutants in suspended solids, sediment and mussels<br />
IWACO (2000) proposed limit values for heavy metals in sediment of the Danube<br />
river basin:<br />
Metals Unit Limit value in sediment<br />
Zinc mg/kg 200<br />
Copper mg/kg 50<br />
Chromium mg/kg 100<br />
Lead mg/kg 100<br />
Cadmium mg/kg 1<br />
Mercury mg/kg 0.5<br />
Nickel mg/kg 50<br />
Arsenic mg/kg 40<br />
The heavy metal concentrations varied in a wide range depending on the type of the<br />
samples and the type of heavy metal. Figures 4.1.3.1-11 summarize the different<br />
heavy metal concentrations in suspended solids, sediment and different mussel<br />
species collected in the Tisza (yellow) and its tributaries (red), respectively. Figures<br />
are grouped in one page indicating the amounts of the same pollutant measured in<br />
the three different investigated compartments. In case of mussels the use of<br />
logarithmic scale on Y axis is more demonstrative and advisable at the same time,<br />
because the differences in the order of magnitudes are illustrated only by that way.<br />
Altogether the three most frequently found mussel species were selected for the<br />
inorganic and organic micropollutant analysis, depending on which of them was<br />
present in the given sampling location. Data on Unio tumidus, U. pictorum and U.<br />
crassus are available as the results of the ITR program referring to the Tisza and its<br />
tributaries.<br />
Mercury (Hg) limit concentration was exceeded in the suspended solids and bottom<br />
sediment of the tributary Sajó. The amount of 1,3 mg/kg measured in the suspended<br />
solids is almost the double than in the sediment sample (0,75 mg/kg). It is a very<br />
clear phenomenon, which indicates historic (former) mercury pollution. During<br />
flooding the mixing up causes resuspension. Heavy metals could be remobilized from<br />
the deposited sediment layer and transported further downstream along the river at<br />
any time.<br />
There are no important differences among the three commonly occurring mussel<br />
species in terms of the investigated mercury concentrations (Figure 4.1.3.1). It is<br />
interesting that a slight decrease is detected in the upstream direction. The range of<br />
mercury concentration is generally below 0,1 mg/kg. The tributaries represent the<br />
same degree of pollution; the Zagyva contains the lowest mercury value (in Unio<br />
tumidus).<br />
The cadmium (Cd) concentration was dominantly well above the 1 mg/kg limit value<br />
both in the suspended solids and sediments of Tisza River (3-5 mg/kg), a bit higher<br />
values were found in the sediment (Figure 4.1.3.2). The sediment of Szamos has the<br />
maximum Cd value (7 mg/kg). Higher amounts (approaching and exceeding 10<br />
mg/kg) were measured in the different mussels especially in case of mussels<br />
27
collected in the Sajó, too. Again lowering values are shown to the upstream direction<br />
of the Tisza. The values measured in the tributaries are similar but the Zagyva<br />
represents the minimum value in U. tumidus, as well.<br />
Lead (Pb) measured in the suspended solids and sediments also exceeded the limit<br />
collected in some sampling sites in the Tisza and in tributaries Szamos and Maros.<br />
The amount of lead in the soft tissues of mussels falls in a range of 10-25 mg/kg on<br />
the lower Tisza stretch. It decreases upstream direction both in case of the Tisza and<br />
its tributaries (Figure 4.1.3.3).<br />
Chromium (Cr) concentrations are close to the limit, copper levels are mostly above<br />
the proposed limit value. A very similar picture can be seen concerning the chromium<br />
distribution along the river (Figure 4.1.3.4). Values vary about 10-25 mg/kg on the<br />
lower stretch. They are around few mg/kg in the middle and the upper section.<br />
Maximum value among the upper half of the investigated stretch was measured in<br />
the mussels collected in the Sajó (Unio pictorum, 15,7).<br />
Copper (Cu) varied between 50-180 mg/kg both in suspended solids and sediment,<br />
the lower values were characterizing the middle section of the river. Its amount was<br />
below 100 mg/kg in the soft tissues of all mussel species everywhere (Figure<br />
4.1.3.5).<br />
Nickel (Ni) concentrations were around the 50 mg/kg limit: in the fine particle size<br />
suspended sediment they were just above that, in the bottom sediment below the<br />
limit value. The amount of nickel in mussels is not significant neither in the Tisza nor<br />
in its tributaries (Figure 4.1.3.6).<br />
Typical zinc (Zn) concentrations in the Tisza are two times higher than the limit. Zinc<br />
occurs in the mussel tissues in considerable amount (Figure 4.1.3.7). It is clear from<br />
the diagram that larger concentrations were detected in the lower Tisza (Yugoslavia)<br />
and in the Kisköre Reservoir. Maximum values approach 2000 mg/kg dry weight,<br />
indicating that this compound causes serious pollution problem in the whole region.<br />
Figure 4.1.3.8 illustrates the amount of aluminum (Al) measured in the different type<br />
of samples. It varies between 25000-40000 mg/kg (suspended solids), 15000-30000<br />
mg/kg (sediment), but it is between 100 and 1000 mg/kg in the soft mussel tissue<br />
samples.<br />
Arsenic (As) concentration was above the limit only in the sediment of the tributary<br />
Szamos. It is characteristically present in the Tisza River basin. The diagram (Figure<br />
4.1.3.9) shows that its amount in the mussel soft tissues is not significant (range: 1-<br />
0,1 mg/kg). The lowest value was detected in the mussels collected in the Zagyva.<br />
28
1,4<br />
1,2<br />
Suspended solids<br />
concentration of Hg (mg/kg)<br />
1<br />
0,8<br />
0,6<br />
0,4<br />
Tisza<br />
Tributaries<br />
0,2<br />
0<br />
0 100 200 300 400 500 600 700<br />
Distance (km)<br />
0,8<br />
0,7<br />
Sediment<br />
0,6<br />
Tisza<br />
Tributaries<br />
concentration of Hg (mg/kg)<br />
0,5<br />
0,4<br />
0,3<br />
0,2<br />
0,1<br />
0<br />
0 100 200 300 400 500 600 700 800<br />
Distance (km)<br />
1<br />
Mussels<br />
Concentration of Hg (mg/kg)<br />
0,1<br />
U.tumidus<br />
U.pictorum<br />
U.crassus<br />
U.tumidus<br />
U.pictorum<br />
U.crassus<br />
0,01<br />
0 100 200 300 400 500 600 700<br />
Distance (km)<br />
Figure 4.1.3.1 Concentration of mercury (mg dry weight/kg) in different<br />
compartments<br />
29
10<br />
9<br />
8<br />
Suspended solids<br />
concentration of Cd (mg/kg)<br />
7<br />
6<br />
5<br />
4<br />
3<br />
2<br />
1<br />
0<br />
0 100 200 300 400 500 600 700<br />
Distance (km)<br />
8<br />
7<br />
Sediment<br />
6<br />
concentration of Cd (mg/kg)<br />
5<br />
4<br />
3<br />
2<br />
1<br />
0<br />
0 100 200 300 400 500 600 700 800<br />
Distance (km)<br />
100<br />
Mussels<br />
Concentration of Cd (mg/kg)<br />
10<br />
1<br />
U.tumidus<br />
U.pictorum<br />
U. crassus<br />
U.tumidus<br />
U.pictorum<br />
U. crassus<br />
0,1<br />
0 100 200 300 400 500 600 700<br />
Distance (km)<br />
Figure 4.1.3.2 Concentration of cadmium (mg dry weight/kg) in different<br />
compartments<br />
30
160<br />
140<br />
Suspended solids<br />
120<br />
concentration of Pb (mg/kg)<br />
100<br />
80<br />
60<br />
40<br />
20<br />
0<br />
0 100 200 300 400 500 600 700<br />
Distance (km)<br />
120<br />
100<br />
Sediment<br />
concentration of Pb (mg/kg)<br />
80<br />
60<br />
40<br />
20<br />
0<br />
0 100 200 300 400 500 600 700 800<br />
Distance (km)<br />
100<br />
Mussels<br />
Concentration of Pb (mg/kg)<br />
10<br />
U.tumidus<br />
U. pictorum<br />
U. crassus<br />
U.tumidus<br />
U. pictorum<br />
U. crassus<br />
1<br />
0 100 200 300 400 500 600 700<br />
Distance (km)<br />
Figure 4.1.3.3 Concentration of lead (mg dry weight/kg) in different<br />
compartments<br />
31
600<br />
500<br />
Suspended solids<br />
concentration of Cr (mg/kg)<br />
400<br />
300<br />
200<br />
100<br />
0<br />
0 100 200 300 400 500 600 700<br />
Distance (km)<br />
200<br />
180<br />
Sediment<br />
160<br />
concentration of Cr (mg/kg)<br />
140<br />
120<br />
100<br />
80<br />
60<br />
40<br />
20<br />
0<br />
0 100 200 300 400 500 600 700 800<br />
Distance (km)<br />
100<br />
Mussels<br />
Concentration of Cr (mg/kg)<br />
10<br />
1<br />
U.tumidus<br />
U. pictorum<br />
U. crassus<br />
U.tumidus<br />
U. pictorum<br />
U. crassus<br />
0,1<br />
0 100 200 300 400 500 600 700<br />
Distance (km)<br />
Figure 4.1.3.4 Concentration of Cr (mg dry weight/kg) in different<br />
compartments<br />
32
200<br />
180<br />
160<br />
Suspended solids<br />
concentration of Cu (mg/kg)<br />
140<br />
120<br />
100<br />
80<br />
60<br />
40<br />
20<br />
0<br />
0 100 200 300 400 500 600 700<br />
Distance (km)<br />
250<br />
200<br />
Sediment<br />
concentration of Cu (mg/kg)<br />
150<br />
100<br />
50<br />
0<br />
0 100 200 300 400 500 600 700 800<br />
Distance (km)<br />
100<br />
Concentration of Cu (mg/kg)<br />
10<br />
Mussels<br />
U.tumidus<br />
U. pictorum<br />
U. crassus<br />
U.tumidus<br />
U. pictorum<br />
U. crassus<br />
1<br />
0 100 200 300 400 500 600 700<br />
Distance (km)<br />
Figure 4.1.3.5 Concentration of copper (mg dry weight/kg) in different<br />
compartments<br />
33
80<br />
70<br />
Suspended solids<br />
60<br />
concentration of Ni (mg/kg)<br />
50<br />
40<br />
30<br />
20<br />
10<br />
0<br />
0 100 200 300 400 500 600 700<br />
Distance (km)<br />
60<br />
50<br />
concentration of Ni (mg/kg)<br />
40<br />
30<br />
20<br />
Sediment<br />
10<br />
0<br />
0 100 200 300 400 500 600 700 800<br />
Distance (km)<br />
10<br />
Concentration of Ni (mg/kg)<br />
1<br />
Mussels<br />
U.tumidus<br />
U. pictorum<br />
U. crassus<br />
U.tumidus<br />
U. pictorum<br />
U. crassus<br />
0,1<br />
0 100 200 300 400 500 600 700<br />
Distance (km)<br />
Figure 4.1.3.6 Concentration of nickel (mg dry weight/kg) in different<br />
compartments<br />
34
1400<br />
1200<br />
Suspended solids<br />
concentration of Zn (mg/kg)<br />
1000<br />
800<br />
600<br />
400<br />
200<br />
0<br />
0 100 200 300 400 500 600 700<br />
Distance (km)<br />
1400<br />
1200<br />
Sediment<br />
concentration of Zn (mg/kg)<br />
1000<br />
800<br />
600<br />
400<br />
200<br />
0<br />
0 100 200 300 400 500 600 700 800<br />
Distance (km)<br />
10000<br />
Mussels<br />
1000<br />
Concentration of Zn (mg/kg)<br />
100<br />
U.tumidus<br />
U. pictorum<br />
U. crassus<br />
U.tumidus<br />
U. pictorum<br />
U. crassus<br />
10<br />
1<br />
0 100 200 300 400 500 600 700<br />
Distance (km)<br />
Figure 4.1.3.7 Concentration of zinc (mg dry weight/kg) in different<br />
compartments<br />
35
45000<br />
40000<br />
Suspended solids<br />
35000<br />
concentration of Al (mg/kg)<br />
30000<br />
25000<br />
20000<br />
15000<br />
10000<br />
5000<br />
0<br />
0 100 200 300 400 500 600 700<br />
Distance (km)<br />
35000<br />
30000<br />
Sediment<br />
concentration of Al (mg/kg)<br />
25000<br />
20000<br />
15000<br />
10000<br />
5000<br />
0<br />
0 100 200 300 400 500 600 700 800<br />
Distance (km)<br />
10000<br />
Mussels<br />
1000<br />
Concentration of Al (mg/kg)<br />
100<br />
U.tumidus<br />
U. pictorum<br />
U. crassus<br />
U.tumidus<br />
U. pictorum<br />
U. crassus<br />
10<br />
1<br />
0 100 200 300 400 500 600 700<br />
Distance (km)<br />
Figure 4.1.3.8 Concentration of Al (mg dry weight/kg) in different compartments<br />
36
60<br />
50<br />
Suspended solids<br />
concentration of As (mg/kg)<br />
40<br />
30<br />
20<br />
10<br />
0<br />
0 100 200 300 400 500 600 700<br />
Distance (km)<br />
50<br />
45<br />
40<br />
Sediment<br />
concentration of As (mg/kg)<br />
35<br />
30<br />
25<br />
20<br />
15<br />
10<br />
5<br />
0<br />
0 100 200 300 400 500 600 700 800<br />
Distance (km)<br />
1<br />
Concentration of As (mg/kg)<br />
Mussels<br />
U.tumidus<br />
U. pictorum<br />
U. crassus<br />
U.tumidus<br />
U. pictorum<br />
U. crassus<br />
0,1<br />
0 100 200 300 400 500 600 700<br />
Distance (km)<br />
Figure 4.1.3.9 Concentration of arsenic (mg dry weight/kg) in different<br />
compartments<br />
37
3000<br />
2500<br />
Suspended solids<br />
concentrarion of Mn (mg/kg)<br />
2000<br />
1500<br />
1000<br />
500<br />
0<br />
0 100 200 300 400 500 600 700<br />
Distance (km)<br />
2500<br />
2000<br />
Sediment<br />
concentration of Mn (mg/kg)<br />
1500<br />
1000<br />
500<br />
0<br />
0 100 200 300 400 500 600 700 800<br />
Distance (km)<br />
Figure 4.1.3.10 Concentration of Mn (mg dry weight/kg) in suspended solids<br />
and sediment<br />
38
60000<br />
Suspended solids<br />
50000<br />
concentration of Fe (mg/kg)<br />
40000<br />
30000<br />
20000<br />
10000<br />
0<br />
0 100 200 300 400 500 600 700<br />
Distance (km)<br />
45000<br />
40000<br />
35000<br />
concentration of Fe (mg/kg)<br />
30000<br />
25000<br />
20000<br />
15000<br />
Sediment<br />
10000<br />
5000<br />
0<br />
0 100 200 300 400 500 600 700 800<br />
Distance (km)<br />
Figure 4.1.3.11 Concentration of iron (mg dry weight/kg) in suspended solids<br />
and sediment<br />
Generally it can be concluded that the investigated triplet of compartments as<br />
suspended solids, sediment and mussel tissues contained different amounts of<br />
inorganic pollutants as follows: the suspended solid compartment contains always<br />
bigger amount of any heavy metal component than the sediment. Usually both<br />
compartments have bigger metal contamination than the mussels, except two metals.<br />
Only the Cd and the Zn occurred in higher amounts in the investigated mussel<br />
species than in the suspended solid and sediment phase. The amount of mercury<br />
was the same in the sediment phase and in the mussel tissue. The average<br />
concentration values are illustrated in Table 4.1.3.1.<br />
39
Table 4.1.3.1 Average values of different metal components in suspended solid,<br />
sediment and mussel compartments (mg/kg dry weight)<br />
Hg Cd Pb Cr Cu Ni Zn Al As<br />
Susp. solids 0,2 3,3 88,7 93,9 125,7 55,4 511,5 32350,0 24,4<br />
Sediment 0,1 2,6 64,0 56,2 90,7 45,6 430,3 20792,6 19,4<br />
Mussels 0,1 5,8 6,1 5,2 36,1 1,8 769,3 583,4 0,5<br />
4.1.4 Comparison of heavy metal data to other results<br />
Some heavy metal concentration values referring to the mussel tissues are shown for<br />
comparison in Table 4.1.4.1 where the measurements of the Yugoslavian<br />
laboratories are given. They found similar figures in case of Hg, Cd, Ni and Zn. They<br />
measured lower concentrations in case of Pb, Cr and Cu. It can be concluded that<br />
this type of common sampling program is one of the best possibility to harmonize<br />
different methods and approaches.<br />
Heavy metal compounds were monitored by OERTEL (1996, 1997, 2000a, 2000b)<br />
using Dreissena polymorpha as an on-site monitoring kit in the Hungarian Danube<br />
section.<br />
According to the 7-week period exposure time higher concentrations of Cd, Pb and<br />
Ni were measured in Dreissena mussels in the Danube than in Unionidae in the<br />
Tisza and its tributaries. However, the amount of Zn and Cu in the Tisza mollusks<br />
proved to be much bigger than in the experiments of OERTEL.<br />
Several possibilities are given for the comparison of heavy metal content of sediment<br />
and mussel tissues regarding those data that were collected during the Bioindicator<br />
study (VITUKI/<strong>ICPDR</strong> 2000). In case of mercury the order of magnitude is the same<br />
in the mussel species. There were a little higher values measured in the sediment<br />
especially from Pancevo section (maximum 0.55 mg/kg Hg in the Danubian<br />
sediment) comparing to the average Tisza pollution level (0.1 mg/kg). The measured<br />
maximum mercury concentration in the Sajó is highly similar to the maximum value<br />
detected in the Velika Morava in 2000.<br />
The Cd-level was similar to the ITR measurements in the sediment (2-3 mg/kg) and<br />
in case of the mussels, as well (max.: around 10 mg/kg in the Tisza mussels, 8,4<br />
mg/kg in Unio pictorum collected in Tekija). Generally the Cd-content of mussel<br />
tissues increased in the Danube downstream direction, especially after Belgrade<br />
section, in the Iron Gate Reservoir. These values did not change too much along the<br />
Tisza River.<br />
The lead and chromium contents of the Danubian sediment and mussels were a little<br />
bit higher than in case of the Tisza. Copper concentrations were bigger in the<br />
sediment samples and the mussels collected in the Tisza, some Danubian values<br />
reached the relevant Tisza figures only in the downstream section. Same statement<br />
can be given for the distribution of nickel: both values are very similar to each other in<br />
the Danube and Tisza, respectively.<br />
40
Table 4.1.4.1 Heavy metals measured in mussels (mg/kg dry weight) by the<br />
Yugoslavian partners on the lower ITR section (ITR 1-4)<br />
4.1.5 Organic micropollutants<br />
Polar pesticides<br />
1 2 3 4<br />
Hg
During JDS atrazine and simazine were analyzed, propazine and endosulfan<br />
analyses were not part of JDS. The mean atrazine concentration was around 50 ng/l<br />
in the Danube. The 100 ng/l target value was exceeded in a few samples. The<br />
comparison shows that the atrazine concentration levels were slightly lower in the<br />
Tisa than in the Danube. In the Tisa River and in its tributaries the target limit value<br />
was not exceeded.<br />
Simazine was not found in JDS samples (limit of determination was 7 ng/l in JDS). In<br />
the Tisa river and in the tributaries simazine concentration was also less than 7 ng/l<br />
in most of the samples.<br />
42
Atrazine<br />
70<br />
60<br />
50<br />
ng/l<br />
40<br />
30<br />
Tisa river<br />
tributaries<br />
20<br />
10<br />
0<br />
0 100 200 300 400 500 600 700 800<br />
Distance (km)<br />
Simazine<br />
ng/l<br />
10<br />
9<br />
8<br />
7<br />
6<br />
5<br />
4<br />
3<br />
2<br />
1<br />
0<br />
0 100 200 300 400 500 600 700 800<br />
Distance (km)<br />
tributaries<br />
Tisa river<br />
Propazine<br />
12<br />
10<br />
ng/l<br />
8<br />
6<br />
4<br />
tributaries<br />
Tisa river<br />
2<br />
0<br />
0 100 200 300 400 500 600 700 800<br />
Distance (km)<br />
Figure 4.1.5.1 Atrazine, simazine and propazine in the water of Tisa and its<br />
tributaries<br />
43
Organochlorine compounds, polychlorinated biphenyls (PCBs), polyaromatic<br />
hydrocarbons (PAHs)<br />
The above pollutants tend to be accumulated in solid phase therefore they were<br />
analyzed in suspended solids, sediment and mussels.<br />
The applied limit values for their quantitative characterization were selected from<br />
Rhine and Elbe sediment quality criteria and from Canadian guidelines because<br />
there is no sediment classification system for the Danube river basin (Table 4.1.5.2).<br />
Table 4.1.5.2 Limit values of organic pollutants in sediment<br />
Component Unit<br />
Limit value (target value or<br />
maximum allowable conc.)<br />
Remark<br />
Lindane µg/kg 10 Rhine target<br />
Hexachlorobenzene µg/kg 40 Rhine target<br />
Hexachlorobutadiene µg/kg 20 Dutch target<br />
Pentachlorobenzene µg/kg - -<br />
pp’-DDT µg/kg 40 Elbe ARGE (Elbe target)<br />
PCBs µg/kg 20 (each) LAWA Germany<br />
PAH<br />
Canadian sediment quality<br />
µg/kg 780<br />
(benzo(a)pyrene)<br />
guideline<br />
Except of hexachlorobutadiene all the other pollutants or groups of pollutants are<br />
present in the suspended solids, sediments and mussels.<br />
Figure 4.1.5.2 indicates the distribution of the studied pollutants in the different<br />
matrices (sediment, suspended solids, mussel) by the ratio of their mean<br />
concentrations in mussel/sediment and in mussel/suspended solid.<br />
44
100<br />
concentration ratio<br />
10<br />
1<br />
mussel/sediment<br />
mussel/suspended solids<br />
0,1<br />
PCB 28<br />
PCB 153<br />
PCB 138<br />
Pentachlorobenzene<br />
Lindane<br />
pp'-DDT<br />
benzo(a)pyrene<br />
Figure 4.1.5.2 Concentration ratio of pollutants in mussel/sediment and in<br />
mussel/suspended solids<br />
The figure shows that mussels concentrated some of the pollutants. The<br />
accumulation factor was around 10 for the components PCB 153, PCB 138,<br />
pentachlorobenzene and lindane.<br />
Figures 4.1.5.3 – 4.1.5.26 illustrate the organic micropollutant content of suspended<br />
solids, sediment and mussel.<br />
Organochlorine compounds<br />
pp’-DDT was found in the sediment of the Tisza River and in the tributaries in low<br />
concentration (mean in Tisza 0,0058 mg/kg, mean in the tributaries 0,0027 mg/kg),<br />
compared to the 0,040 mg/kg limit value.<br />
In the suspended solids the pp’-DDT concentrations were much higher than in the<br />
sediment. Both in the tributaries and in the Tisza River the mean concentrations<br />
exceeded the limit value (0,040 mg/kg). Although DDT application was banned for<br />
several decades in the Tisza River Basin, a high concentration of the suspended<br />
solids can be explained by the soil erosion of cultivated lands.<br />
In the mussels the pp’-DDT mean concentration was 8,5 µg/kg. It is somewhat higher<br />
than the mean pp’-DDT concentration in Tisza sediment (5,8 µg/kg), but much lower<br />
than the mean pp’-DDT concentration in the Tisza suspended solids (50 µg/kg).<br />
Lindane concentrations in the Tisa River and in the tributaries were very low both in<br />
the sediment and in the suspended solids. The mean concentrations were around 10<br />
% of the Rhine target value (10 µg/kg). Lindane was accumulated in mussels, the<br />
mean lindane concentration of mussels was 10.2 µg/kg.<br />
45
The mean pentachlorobenzene concentrations were similar to the lindane<br />
concentrations both in the sediment, suspended solids and mussels.<br />
Hexachlorobenzene (HCB) concentrations were typically less than the lindane or<br />
pentachlorobenzene concentrations in sediment and suspended solids. Compared to<br />
the target value (40 µg/kg) this pollution level is negligible. In mussel the HCB<br />
content was below the detection level.<br />
Polychlorinated biphenyls (PCBs) concentrations were typically below the 20 µg/kg<br />
target value, except PCB 28 in suspended solids and sediment in the tributaries Sajó<br />
and Bodrog, and the Tisa River at Tiszabercel (rkm 569).<br />
The representative compound benzo(a)pyrene of polyaromatic hydrocarbons (PAHs)<br />
varied in the concentration range
Lindane<br />
0,0040<br />
0,0035<br />
0,0030<br />
mg/kg<br />
0,0025<br />
0,0020<br />
0,0015<br />
tributaries<br />
Tisa river<br />
0,0010<br />
0,0005<br />
0,0000<br />
0 100 200 300 400 500 600 700<br />
Distance (km)<br />
PCB-153<br />
0,0160<br />
0,0140<br />
0,0120<br />
mg/kg<br />
0,0100<br />
0,0080<br />
0,0060<br />
tributaries<br />
Tisa river<br />
0,0040<br />
0,0020<br />
0,0000<br />
0 100 200 300 400 500 600 700<br />
Distance (km)<br />
Figure 4.1.5.3. Lindane and PCB 153 in suspended solids<br />
47
Penthachloro-benzene<br />
0,0050<br />
0,0045<br />
0,0040<br />
0,0035<br />
mg/kg<br />
0,0030<br />
0,0025<br />
0,0020<br />
tributaries<br />
Tisa river<br />
0,0015<br />
0,0010<br />
0,0005<br />
0,0000<br />
0 100 200 300 400 500 600 700<br />
Distance (km)<br />
HCB<br />
0,0025<br />
0,0020<br />
mg/kg<br />
0,0015<br />
0,0010<br />
tributaries<br />
Tisa river<br />
0,0005<br />
0,0000<br />
0 100 200 300 400 500 600 700<br />
Distance (km)<br />
DDT<br />
0,1200<br />
0,1000<br />
mg/kg<br />
0,0800<br />
0,0600<br />
0,0400<br />
tributaries<br />
Tisa river<br />
0,0200<br />
0,0000<br />
0 100 200 300 400 500 600 700<br />
Distance (km)<br />
Figure 4.1.5.4 Pentachlorobenzene, HCB and DDT in suspended solids<br />
48
PCB-28<br />
0,0400<br />
0,0350<br />
0,0300<br />
mg/kg<br />
0,0250<br />
0,0200<br />
0,0150<br />
tributaries<br />
Tisa river<br />
0,0100<br />
0,0050<br />
0,0000<br />
0 100 200 300 400 500 600 700<br />
Distance (km)<br />
PCB-138<br />
0,0100<br />
0,0090<br />
0,0080<br />
0,0070<br />
mg/kg<br />
0,0060<br />
0,0050<br />
0,0040<br />
0,0030<br />
tributaries<br />
Tisa river<br />
0,0020<br />
0,0010<br />
0,0000<br />
0 100 200 300 400 500 600 700<br />
Distance (km)<br />
Benz(a)pyren<br />
mg/kg<br />
0,18<br />
0,16<br />
0,14<br />
0,12<br />
0,1<br />
0,08<br />
0,06<br />
0,04<br />
0,02<br />
0<br />
0 100 200 300 400 500 600 700<br />
Distance (km)<br />
tributaries<br />
Tisa river<br />
Figure 4.1.5.5 PCB-28, PCB-138 and benz(a)pyrene in suspended solids<br />
49
Lindane<br />
0,0025<br />
0,0020<br />
mg6kg<br />
0,0015<br />
0,0010<br />
tributaries<br />
Tisa river<br />
0,0005<br />
0,0000<br />
0 100 200 300 400 500 600 700 800<br />
Distance (km)<br />
DDT<br />
0,0120<br />
0,0100<br />
mg/kg<br />
0,0080<br />
0,0060<br />
0,0040<br />
tributaries<br />
Tisa river<br />
0,0020<br />
0,0000<br />
0 100 200 300 400 500 600 700 800<br />
Distance (km)<br />
Figure 4.1.5.6 Lindane and DDT in sediment<br />
50
PCB-138<br />
0,0025<br />
0,0020<br />
mg/kg<br />
0,0015<br />
0,0010<br />
tributaries<br />
Tisa river<br />
0,0005<br />
0,0000<br />
0 100 200 300 400 500 600 700 800<br />
Distance (km)<br />
HCB<br />
0,0012<br />
0,0010<br />
mg/kg<br />
0,0008<br />
0,0006<br />
0,0004<br />
tributaries<br />
Tisa river<br />
0,0002<br />
0,0000<br />
0 100 200 300 400 500 600 700 800<br />
Distance (km)<br />
PCB-28<br />
0,08<br />
0,07<br />
0,06<br />
mg/kg<br />
0,05<br />
0,04<br />
0,03<br />
tributaries<br />
Tisa river<br />
0,02<br />
0,01<br />
0<br />
0 100 200 300 400 500 600 700 800<br />
Distance (km)<br />
Figure 4.1.5.7 PCB-138, PCB-28 and HCB in sediment<br />
51
Penthachloro-benzene<br />
0,0035<br />
0,003<br />
0,0025<br />
mg/kg<br />
0,002<br />
0,0015<br />
tributaries<br />
Tisa river<br />
0,001<br />
0,0005<br />
0<br />
0 100 200 300 400 500 600 700 800<br />
Distance (km)<br />
Benz(a)pyrene<br />
mg/kg<br />
0,0900<br />
0,0800<br />
0,0700<br />
0,0600<br />
0,0500<br />
0,0400<br />
0,0300<br />
0,0200<br />
0,0100<br />
tributaries<br />
Tisa river<br />
0,0000<br />
0 100 200 300 400 500 600 700 800<br />
Distance (km)<br />
Figure 4.1.5.8 Pentachlorobenzene and benzo(a)pyrene in sediment<br />
Similarly to the inorganic micropollutant analyses the three most frequently found<br />
mussel species were selected for the organic micropollutant analysis, depending on<br />
which of them was present in the given sampling location. Data on Unio tumidus, U.<br />
pictorum and U. crassus are available as the results of the ITR program referring to<br />
the Tisza and its tributaries. Next figures summarize the different organic compounds<br />
(pesticides, PCBs, PAHs) in different mussel species collected in the Tisza (yellow)<br />
and its tributaries (red), respectively. In this case too, the use of logarithmic scale for<br />
Y axis is more demonstrative because only the important differences (order of<br />
magnitudes) are illustrated by this way.<br />
52
1000<br />
Concentration of naphthalene (ng/g)<br />
100<br />
10<br />
Unio tumidus<br />
Unio pictorum<br />
Unio crassus<br />
Unio tumidus<br />
Unio pictorum<br />
1<br />
0 100 200 300 400 500 600 700 800<br />
Distance (km)<br />
Figure 4.1.5.9 Concentration of naphthalene (ng/g) in mussels, ITR 2001<br />
1000<br />
Concentration of flouranthene (ng/g)<br />
100<br />
10<br />
Unio tumidus<br />
Unio pictorum<br />
Unio crassus<br />
Unio tumidus<br />
Unio pictorum<br />
1<br />
0 100 200 300 400 500 600 700 800<br />
Distance (km)<br />
Figure 4.1.5.10 Concentration of fluoranthene (ng/g) in mussels, ITR 2001<br />
53
1000<br />
Concentration of benzo(b)fluoranthene (ng/g)<br />
100<br />
10<br />
Unio tumidus<br />
Unio pictorum<br />
Unio crassus<br />
Unio tumidus<br />
Unio pictorum<br />
1<br />
0 100 200 300 400 500 600 700 800<br />
Distance (km)<br />
Figure 4.1.5.11 Concentration of benzo(b)fluoranthene (ng/g) in mussels,<br />
ITR 2001<br />
100<br />
Concentration of benzo(a)pyrene (ng/g)<br />
10<br />
Unio tumidus<br />
Unio pictorum<br />
Unio crassus<br />
Unio tumidus<br />
Unio pictorum<br />
1<br />
0 100 200 300 400 500 600 700 800<br />
Distancae (km)<br />
Figure 4.1.5.12 Concentration of benzo(a)pyrene (ng/g) in mussels, ITR 2001<br />
54
1000<br />
Concentraion of benzo(k)fluoranthene (ng/g)<br />
100<br />
10<br />
Unio tumidus<br />
Unio pictorum<br />
Unio crassus<br />
Unio tumidus<br />
Unio pictorum<br />
1<br />
0 100 200 300 400 500 600 700 800<br />
Distance (km)<br />
Figure 4.1.5.13 Concentration of benzo(k)fluoranthene (ng/g) in mussels,<br />
ITR 2001<br />
18<br />
Concentration of indeno(1,2,3-c,d)pyrene (ng/g)<br />
16<br />
14<br />
12<br />
10<br />
8<br />
6<br />
4<br />
2<br />
Unio tumidus<br />
Unio pictorum<br />
Unio crassus<br />
Unio tumidus<br />
Unio pictorum<br />
0<br />
0 100 200 300 400 500 600 700 800<br />
Distance (km)<br />
Figure 4.1.5.14 Concentration of indeno(1,2,3-c)pyrene (ng/g) in mussels,<br />
ITR 2001<br />
55
100<br />
Concentration of benzo(g,h,i)perylene (ng/g)<br />
10<br />
Unio tumidus<br />
Unio pictorum<br />
Unio crassus<br />
Unio tumidus<br />
Unio pictorum<br />
1<br />
0 100 200 300 400 500 600 700 800<br />
Distance (km)<br />
Figure 4.1.5.15 Concentration of benzo(g,h)perylene (ng/g) in mussels,<br />
ITR 2001<br />
100<br />
Concentration of pp'-DDT (ng/g)<br />
10<br />
Unio tumidus<br />
Unio pictorum<br />
Unio crassus<br />
Unio tumidus<br />
Unio pictorum<br />
1<br />
0 100 200 300 400 500 600 700 800<br />
Distance (km)<br />
Figure 4.1.5.16 Concentration of pp’-DDT (ng/g) in mussels, ITR 2001<br />
56
Concentration of lindane(gamma-hexachlorocyclohexane<br />
(ng/g)<br />
100<br />
10<br />
1<br />
0 100 200 300 400 500 600 700 800<br />
Distance (km)<br />
Unio tumidus<br />
Unio pictorum<br />
Unio crassus<br />
Unio tumidus<br />
Unio pictorum<br />
Figure 4.1.5.17 Concentration of lindane(gamma-hexachlorocyclohexane (ng/g)<br />
in mussels<br />
100<br />
Concentration of pentachlorobenzene (ng/g)<br />
10<br />
Unio tumidus<br />
Unio pictorum<br />
Unio crassus<br />
Unio tumidus<br />
Unio pictorum<br />
1<br />
0 100 200 300 400 500 600 700 800<br />
Distance (km)<br />
Figure 4.1.5.18 Concentration of pentachlorobenzene (ng/g) in mussels,<br />
ITR 2001<br />
57
1000<br />
Summ of concentrations Of PCB's (ng/g)<br />
100<br />
10<br />
Unio tumidus<br />
Unio pictorum<br />
Unio crassus<br />
Unio tumidus<br />
Unio pictorum<br />
1<br />
0 100 200 300 400 500 600 700 800<br />
Distance (km)<br />
Figure 4.1.5.19 Concentration of sum of PCB’s (ng/g) in mussels, ITR 2001<br />
Concentration of PCB180(2,2',3,4,4',5,5'-heptachlorbiphenyl)<br />
(ng/g)<br />
1000<br />
100<br />
10<br />
1<br />
0 100 200 300 400 500 600 700 800<br />
Distance (km)<br />
Unio tumidus<br />
Unio pictorum<br />
Unio crassus<br />
Unio tumidus<br />
Unio pictorum<br />
Figure 4.1.5.20 Concentration of PCB180 (ng/g) in mussels, ITR 2001<br />
58
100<br />
Concentration of PCB28 (ng/g)<br />
10<br />
Unio tumidus<br />
Unio pictorum<br />
Unio crassus<br />
Unio pictorum<br />
1<br />
0 100 200 300 400 500 600 700 800<br />
Distance (km)<br />
Figure 4.1.5.21 Concentration of PCB28 (ng/g) in mussels, ITR 2001<br />
100<br />
Concentration of PCB52 (ng/g)<br />
10<br />
Unio tumidus<br />
Unio pictorum<br />
Unio crassus<br />
Unio pictorum<br />
1<br />
0 100 200 300 400 500 600 700 800<br />
Distance (km)<br />
Figure 4.1.5.22 Concentration of PCB52 (ng/g) in mussels, ITR 2001<br />
59
100<br />
Concentration of PCB101 (ng/g)<br />
10<br />
Unio tumidus<br />
Unio pictorum<br />
Unio crassus<br />
Unio tumidus<br />
Unio pictorum<br />
1<br />
0 100 200 300 400 500 600 700 800<br />
Distance (km)<br />
Figure 4.1.5.23 Concentration of PCB101 (ng/g) in mussels, ITR 2001<br />
100<br />
Concentration of PCB118 (ng/g<br />
10<br />
Unio tumidus<br />
Unio pictorum<br />
Unio crassus<br />
1<br />
0 100 200 300 400 500 600 700 800<br />
Distance (km)<br />
Figure 4.1.5.24 Concentration of PCB118 (ng/g) in mussels, ITR 2001<br />
60
1000<br />
Concentration of PCB153 (ng/g)<br />
100<br />
10<br />
Unio tumidus<br />
Unio pictorum<br />
Unio crassus<br />
Unio tumidus<br />
Unio pictorum<br />
1<br />
0 100 200 300 400 500 600 700 800<br />
Distance (km)<br />
Figure 4.1.5.25 Concentration of PCB153 (ng/g) in mussels, ITR 2001<br />
100<br />
Concentration of PCB138 (ng/g)<br />
10<br />
Unio tumidus<br />
Unio pictorum<br />
Unio crassus<br />
Unio tumidus<br />
Unio pictorum<br />
1<br />
0 100 200 300 400 500 600 700 800<br />
Distance (km)<br />
Figure 4.1.5.26 Concentration of PCB138 (ng/g) in mussels, ITR 2001<br />
Identification of organic components<br />
GC-MS scans identified the following components in water and sediment at sampling<br />
stations ITR-1(Titel, Danubian confluence) and ITR-5 (Szeged, rkm 172):<br />
• Organic compounds in water (together with suspended solids):<br />
aliphatic hydrocarbons having different number of carbon atoms, phenanthrene,<br />
anthracene, fluoranthene, pyrene, chrysene, benzanthracene, benzofluoranthenes,<br />
benzopyrenes, DDT, molecular sulphur<br />
61
• Organic compounds in bottom sediment:<br />
aliphatic hydrocarbons having different number of carbon, phenanthrene,<br />
fluoranthene, pyrene, diisobutyl phthalate, pentadecanal, hexacosanal, 4,4-dimethyl<br />
cholestanone, sulphur.<br />
The identified compounds are typical natural and anthropogenic components of water<br />
and sediment.<br />
4.2 Ecological status characterization<br />
4.2.1 Phytoplankton<br />
It has to be mentioned that phytoplankton species diversity, abundancy and<br />
chlorophyll-a were relatively low from station Titel (the confluence of the Tisza River<br />
to the Danube) upstream the whole Tisza River. The reason of that was the flooding<br />
situation and high water level.<br />
Characterising phytoplankton species diversity of the Tisza and its tributaries, all<br />
together 177 taxa were identified. The number of taxa ranged between 20 – 80 in the<br />
Tisza River, while it varied from 15 to 77 in the tributaries.The highest number of<br />
phytoplankton species was found at Mindszent (80) among all stations of the Tisza<br />
River. Number of taxa identified on-board during ITR within individual groups of<br />
phytoplankton in Tisza and its tributaries are presented in Figure 4.2.1.1. It can be<br />
said that from Tiszabecs to Mindszent number of taxa slightly increased.<br />
Downstream stations of Tisza were influenced by high water level since the<br />
beginning of the ITR sampling program.<br />
Generally, the diatoms (Bacillariophyceae), green algae (Chlorococcales) and<br />
Euglenophyceae were the most dominating taxa. The minor groups were<br />
Cyanophyceae/Cyanobacteria, Dinophyceae, Conjugatophyceae, Xanthophyceae<br />
and Cryptophyceae. In some stations (in Tiszacsege, Dombrád, Szamos tributary,<br />
Tiszabecs) there were more taxa of Chrysophyceae than of Euglenophyceae. The<br />
most often species were Chrysococcus rufescens, Mallomonas acaroides, Dinobryon<br />
divergens, Synura uvella (Chrysophyceae), Aulacoseira granulata, Cyclotella<br />
meneghiniana, Melosira varians, Stephanodiscus hantzschii, Asterionela formosa,<br />
Diatoma vulgaris, Fragilaria ulna var. ulna, Navicula cryptocephala, N. Lanceolata,<br />
Nitzschia acicularis, N.palea (Bacillariophyceae). Green coccal algae were<br />
represented mostly by Coelastrum astroideum, C. microporum, Pediastrum duplex,<br />
Scenedesmus acuminatus and S. opoliensis. Among the Crypophyceae the genera<br />
of Cryptomonas occured freequently. Organic pollution was indicated by the<br />
presence of euglenoids (mostly Euglena caudata, E. pisciformis, Strombomonas<br />
verrucosa, Trachelomonas hispida, T. planctonica, T. volvocina, T. volvocinopsis).<br />
The list of taxa of the phytoplankton is given in Annex of the report.<br />
62
ITR4<br />
ITR5<br />
Number of taxa<br />
80<br />
70<br />
60<br />
50<br />
40<br />
30<br />
20<br />
10<br />
0<br />
ITR1<br />
ITR3<br />
ITR2-T<br />
ITR7<br />
ITR-T6<br />
ITR9<br />
ITR8-T<br />
ITR10<br />
ITR12<br />
ITR11-T<br />
ITR13<br />
ITR14<br />
ITR15<br />
ITR16<br />
ITR18<br />
ITR17-T<br />
ITR20<br />
ITR19-T<br />
ITR21<br />
ITR22<br />
ITR23<br />
ITR24<br />
ITR26<br />
ITR25-T<br />
ITR27<br />
CYANOPHYCEAE CHRYSOPHYCEAE XANT HOPHYCEAE<br />
BACILLARIOPHYCEAE DINOPHYCEAE CRYPT OPHYCEAE<br />
CHLOROPHYCEAE CONJUGATOPHYCEAE EUGLENOPHYCEAE<br />
Figure 4.2.1.1. Number of species for individual phytoplankton group of Tisza<br />
River and its tributaries.<br />
Phytoplankton abundancy was expressed by the number of cells per ml. It can be<br />
stated than during the ITR the abundancy of phytoplankton increased from Tiszabecs<br />
to Kisköre. Other downstream sites were influenced by high water level. Zagyva and<br />
Sajó were eutrophic tributaries having the highest values of abundancy (31404 cells<br />
per ml, resp. 40484 cells per ml) within all the measured stations. This was indicated<br />
by the high chlorophyll-a values, too. The abundancy of the phytoplankton is shown<br />
in Figure 4.2.1.2. The distribution of the individual group of cyanobacteria and algae<br />
is presented in Figure 4.2.1.3. It is evident that diatoms were the most abundant<br />
algae in the whole investigated stretch of the Tisza and as well as in its tributaries.<br />
Green coccal and flagelate algae created second abundant group from Titel to the<br />
confluence of Bodrog. In the upper part of the Tisza (from Sajó confluence) numbers<br />
of cells of Chrysophyceae increased.<br />
63
cells per ml<br />
5000<br />
31404<br />
40484<br />
4000<br />
3000<br />
2000<br />
1000<br />
0<br />
ITR 27<br />
ITR 26<br />
ITR 25-T<br />
ITR 24<br />
ITR 23<br />
ITR 22<br />
ITR 21<br />
ITR 20<br />
ITR19-T<br />
ITR 18<br />
ITR 17-T<br />
ITR 16<br />
ITR 15<br />
ITR 14<br />
ITR 13<br />
ITR 12<br />
ITR 11-T<br />
ITR 10<br />
ITR 9<br />
ITR 8-T<br />
ITR 7<br />
ITR 6-T<br />
ITR 5<br />
ITR 4<br />
ITR 3<br />
ITR 2-T<br />
ITR 1<br />
Figure 4.2.1.2. Phytoplankton abundance (cells per ml) in the investigated<br />
stations of Tisza and its tributaries<br />
100%<br />
90%<br />
80%<br />
70%<br />
60%<br />
50%<br />
40%<br />
30%<br />
20%<br />
10%<br />
0%<br />
ITR 27<br />
ITR 26<br />
ITR 25-T<br />
ITR 24<br />
ITR 23<br />
ITR 22<br />
ITR 21<br />
ITR 20<br />
ITR19-T<br />
ITR 18<br />
ITR 17-T<br />
ITR 16<br />
ITR 15<br />
ITR 14<br />
ITR 13<br />
ITR 12<br />
ITR 11-T<br />
ITR 10<br />
ITR 9<br />
ITR 8-T<br />
ITR 7<br />
ITR 6-T<br />
ITR 5<br />
ITR 4<br />
ITR 3<br />
ITR 2-T<br />
ITR 1<br />
CYANOPHYCEAE CHRYSOPHYCEAE XANTHOPHYCEAE<br />
DINOPHYCEAE CRYPTOPHYCEAE BACILLAIOPHYCEAE<br />
CHLOROCOCCALES VOLVOCALES ULTRICHALES<br />
CONJUGATOPHYCEAE EUGLENOPHYCEAE<br />
Figure 4.2.1.3. Distribution of abundance of the individual groups of<br />
cyanobacteria and algae within the ITR stations<br />
Phytoplankton biomass was expressed by the content of chlorophyll-a. Based on<br />
obtained results the concentration of chlorophyll-a was generally low in Tisza River.<br />
Highest values were measured in the tributaries, mainly in Zagyva and Sajó which is<br />
in harmony with phytoplankton abundancy. Biomass was measured by two methods.<br />
The differences between the two methods for the whole investigated stretch can be<br />
seen in Figure 4.2.1.4. Generally the results obtained by ISO method were higher.<br />
64
2, 95<br />
2, 89<br />
4, 53<br />
5, 18<br />
2 , 5 8<br />
4, 0 4<br />
1, 5 2<br />
3, 61<br />
1, 3 0<br />
4, 71<br />
2, 94<br />
7, 96<br />
1, 91<br />
1, 84<br />
0, 62<br />
2 , 0 5<br />
2, 73<br />
3, 9 1<br />
1, 67<br />
5, 04<br />
60, 3 3<br />
72, 93<br />
10, 34<br />
13, 73<br />
2, 67<br />
5, 04<br />
1, 93<br />
2, 01<br />
2 , 2 8<br />
4, 6 2<br />
1, 6 9<br />
3, 75<br />
11, 0<br />
15, 98<br />
1, 96<br />
1, 66<br />
1, 68<br />
2, 69<br />
1, 04<br />
1 , 7 2<br />
1, 4 8<br />
0, 59 0, 57<br />
2, 11<br />
0, 40<br />
1, 44<br />
0, 25<br />
1, 01<br />
2, 31<br />
4, 14<br />
0, 25<br />
1, 24<br />
0 , 3 4<br />
0, 4 1<br />
The content of chlorophyll-a was highly influenced by high content of suspended<br />
solids due to the high water level.<br />
ug/l<br />
20<br />
18<br />
16<br />
14<br />
12<br />
10<br />
8<br />
6<br />
4<br />
2<br />
0<br />
BEGA<br />
MAROS<br />
60,33 72,93<br />
ZAGYVA<br />
SAJÓ<br />
BODROG<br />
SAMOS<br />
ITR 27<br />
ITR 26<br />
ITR 25<br />
ITR 24<br />
ITR 23<br />
ITR 22<br />
ITR 21<br />
ITR 20<br />
ITR19<br />
ITR 18<br />
ITR 17<br />
ITR 16<br />
ITR 15<br />
ITR 14<br />
ITR 13<br />
ITR 12<br />
ITR 11<br />
ITR 10<br />
ITR 9<br />
ITR 8<br />
ITR 7<br />
ITR 6<br />
ITR 5<br />
ITR 4<br />
ITR 3<br />
ITR 2<br />
ITR 1<br />
Chlorophyll-a (FLU)<br />
Chlorophyll-a (ISO)<br />
Figure 4.2.1.4. Content of chlorophyll-a (µg/l) in the Tisza River and its<br />
tributaries measured during ITR<br />
4.2.2 Rotatoria and crustacea zooplankton<br />
The international expedition on the Tisza River conducted in September 2001<br />
collected zooplankton samples from 27 locations of the Tisza River and its tributaries.<br />
Rotatoria and Crustacea (Cladocera, Copepoda) species were determined from<br />
filtered samples. Species composition and individual abundance values were<br />
determined for each sampling section. Based on the results assessment is given on<br />
the water quality of the river and its tributaries. Recent results are compared to<br />
former studies.<br />
Literature survey<br />
Survey of the Hungarian zooplankton studies concerning stagnant and flowing water<br />
bodies revealed that the Tisza river and its tributaries, dead-arms, ox-bows, and claypits,<br />
as well as the Kisköre reservoir on the river has been investigated historically in<br />
details.<br />
The first papers on the Tisza were published by DADAY (1888, 1891) and ÉBER<br />
(1955). Investigations on clay-pits were published by VARGA (1928, 1930). Most<br />
detailed data on the river and its dead-arms was published by MEGYERI (1955, 1957,<br />
1959, 1961, 1970, 1971, 1972). Description of the medium section was done by GÁL<br />
(1963) and BANCSI (1976b, 1977) while benthic Rotatoria and Entomostraca fauna<br />
was discussed by BANCSI, HAMAR (1981) and ZSUGA (1981, 1997b).<br />
65
Results of the detailed and periodical Rotatoria and Crustacea investigation conducted<br />
in 1992 on the Tisza and its tributaries were published by GULYÁS ET AL. (1995). The<br />
authors investigated regularly 12 sections on the Tisza.<br />
As the results of this complex series of investigations it was concluded that in general<br />
the planktonic elements dominated the river, most of which is cosmopolitan, adopted<br />
species. Large number of described taxa (altogether 181 Rotatoria, 28 Cladocera and<br />
8 Copepoda) is also noteworthy.<br />
There are many publications concerning the smaller streams, dead-arms, inundated<br />
areas of the Tisza catchment area (VARGA 1931, 1953, 1966, BANCSI 1974, 1976a,<br />
1980, ZSUGA 1981, 1999, ZSUGA and NAGY 1989, 1991). Water quality questions of<br />
the catchment area and ecological considerations of the Kiskörei reservoirs were<br />
discussed by ÁDÁMOSI et al. (1974, 1978), BANCSI and VÉGVÁRI (1990), as well as<br />
ZSUGA, BANCSI and VÉGVÁRI (1990).<br />
Zooplankton communities of the Kiskörei reservoir were investigated in details during<br />
the past decade. Investigations covered the aspects of quantitative and qualitative<br />
survey of zooplankton, monitoring of seasonal dynamics, and characterization of<br />
mosaic patterns and biodiversity (ZSUGA 1994, 1995, 1996, 1998, 1998a, ZSUGA,<br />
BANCSI 1995, ZSUGA, EGYED, KRUPINSZKI 1995). Rotatoria and Crustacea fauna<br />
of the densely vegetated water bodies, stands of different basins, as well as biotecton<br />
components on the macrovegetation was also investigated in details (ZSUGA 1996,<br />
1996a, 1996b, 1997, ZSUGA, BANCSI, VÉGVÁRI 1998). Investigations into the fish<br />
food resources of the seaweed and wetland vegetation were also conducted lately<br />
(SZÍTÓ, ZSUGA, BANCSI, KOVÁCS, VÉGVÁRI 1997).<br />
During the investigations related to the cyanide spill from Romania in January 2000<br />
and later on studies revealed the occurrence of 306 species of Rotatoria, Cladocera<br />
and Copepoda. Highest taxon number was measured at Tiszafüred (60), while lowest<br />
at Tiszasziget (35). There were many rare species identified, particularly from the<br />
Tisza River occurrence, which was not recorded previously. The primary habitat of<br />
these species is, however, not the plankton, but the water body within the aquatic<br />
macrovegetation or the surface layer of the sediment. Their presence in the water<br />
body is the result of the runoff and drift.<br />
In the period of cyanide pollution most of the plankton was destroyed, approximately<br />
70-80 % of Rotatoria and Cladocera species was damaged. Following the washdown<br />
of the toxic plume in a few days some species were represented in small<br />
individual abundances, particularly the members of high tolerance species. Further<br />
increase of species number and individual abundances was small due to a flood<br />
event in the middle of February.<br />
Following the cyanide spill the results of investigations throughout 2000 indicated that<br />
the individual abundances of the stands varied within large ranges. On the basis of<br />
this the Tisza could be classified into three sections. The upper section to the<br />
confluence point of the Szamos (1-2183 ind./10 l), following the section to the<br />
Kiskörei Reservoir (3-7154 ind./10 l), and finally, further downstream to the southern<br />
state boundary (8-9592 ind./10 l).<br />
66
Results of the investigations upstream of the Kiskörei reservoir on the Tisza indicated<br />
that according to the flood periods the representatives of the investigated<br />
zooplankton groups (Rotatoria, Cladocera, Copepoda) were present in small species<br />
numbers and individual abundances in most of the samples. Following the cessation<br />
of the flood the individual abundances of the zooplankton species grew spectacularly.<br />
The runoff water from the floodplains drifted many, rarely occurring organisms into<br />
the plankton of the Tisza river. These taxa were, however, represented occasionally<br />
and only in isolated river sections.<br />
On the basis of the results it is concluded that the re-growth of the plankton<br />
community of the river started quite soon, following only a few days amongst the<br />
changing conditions.<br />
The heavy metal pollution that occurred in March did not influence the microfauna of<br />
the middle Tisza significantly. Individual abundances were rather effected by a new<br />
flood. There are many species in the plankton that were drifted from the sediment to<br />
the aquatic phase (Dicranophorus caudatus, Encentrum eurycephalum, Lophocharis<br />
salpina, Paradicranophorus hudsoni, Paracyclops fimbriatus). The presence of these<br />
species supports the hypothesis that organisms survived in the sediment and the<br />
regeneration of the aquatic ecosystem of the river did started soon not only in the<br />
aqueous phase but also in the sediment and sediment surface.<br />
Surveying the results of the investigations lead to the conclusion that the zooplankton<br />
of the Tisza River changed significantly after the cyanide spill compared to the results<br />
of the previous 10-15 years. This was particularly expressed in the period following<br />
the floods when both the species composition and individual abundances were<br />
different in 2000 than in previous time period under the low water conditions. This<br />
could be ascribed to various mechanisms of the intoxication processes, followed by a<br />
large flood as well as to the high mortality of filter feeder fish population (silver carp).<br />
Results of the investigation series conducted from the end of February until the end<br />
of October indicate that the “ordinary” zooplankton changed in species composition<br />
and individual abundances. Occurrence of rare species and occasional population<br />
increase during some seasons, far above the regular values was observed with<br />
regards to zooplankton stands. There might be multiple reasons behind this<br />
phenomena but the direct and indirect effect of the intoxication could not be excluded<br />
as potential factors.<br />
Results of the investigations prove that ecological conditions changed significantly<br />
that was followed by a quick repopulation of the plankton of the Tisza. In this pivotal<br />
role is attributed to the non-polluted tributaries, floodplains and Kiskörei reservoir as<br />
well. Following the low diversity initial period richer plankton was formed both in<br />
terms of qualitative and quantitative character. The composition of the newly formed<br />
community is influenced by climatic factors as well as the water level fluctuations of<br />
the river and prevailing general hydrological conditions.<br />
Comparison of the results of quantitative investigation also shows that similarly high<br />
individual abundances were measured as early as 1992 along the longitudinal<br />
section of the Tisza. From Záhony to Tiszasziget similar values of individual<br />
abundances were measured between June-August in this year.<br />
67
Large zooplankton stands were observed in the Csenger section of the Szamos, at<br />
Buj on the Lónyai channel, at Tokaj on the Bodrog, at Kesznyéten on the Sajó and at<br />
Makó on the Maros as far as the tributaries are concerned. In 2000, however, only in<br />
the maros we measured similar high individual numbers.<br />
In the middle and lower Tisza region many dead-arm was investigated on nature<br />
protection areas. Results indicated that many rare zooplankton species registered<br />
here, rarely occurring in Hungary (Gói-tói-, Csatlói-, Feketevárosi-, Mártélyi-Holt<br />
Tisza, Sulymos). These areas are of high priority nature protection areas, their further<br />
protection is emphasized herein (VITUKI 2001).<br />
Evaluation of results<br />
Investigations on the longitude of the Tisza river and its tributaries revealed the<br />
presence of 41 Rotatoria, 6 Cladocera and 8 Copepoda, altogether 55 taxa. The<br />
reason for the small taxon number is the high water level on the rivers causing very<br />
high suspended solid load at some locations (Tisza: Titel, Novi Becej, Novi<br />
Knezevac, Szeged, Szamos Tunyogmatolcs, Tiszafüred, Tiszacsege,<br />
Gergelyiugornya, Tivadar) This problem made the identification of species and<br />
counting of individual numbers critically difficult (Table 4.2.2.1).<br />
Primarily the number of Cladocera species was low and only a few species was<br />
determined that are characteristic to Tisza plankton: Bosmina (B.) longirostris,<br />
Disparalona rostrata, Moina micrura. Amongst the rare species only the occurrence<br />
of Alona guttata was recorded. The species number of Copepods was slightly higher<br />
with characteristically occurring species Acanthocyclops robustus and Eucycloops<br />
serrulatus. Occurrence of Eurytemora velox is noted specially at the Kunszentmárton<br />
sampling site of the Hármas Körös. This particular species was only found in the<br />
Danube and in waters west to the Danube in Hungary so far.<br />
Highest species number was found amongst the Rotatoria taxa, such as Brachionus<br />
angularis, B. budapestinensis, B. calyciflorus, Keratella cochlearis cochlearis, K. c.<br />
tecta, Lecane bulla, Polyarthra dolichoptera, Synchaeta oblonga and S. pectinata<br />
species belonging to the dominant elements of the Tisza cacthment system. These<br />
species are often occurring in slow flowing and stagnant eutrophicated Hungarian<br />
waters, forming large stands under favorable conditions. The members of Brachionus<br />
and Synchaeta genera are tolerating organic pollution as well. In late summer the<br />
occurrence of predatory Aspanchna species was often recorded in high numbers.<br />
Number of rare species (Ascomorpha ecaudis, Cephalodella biungulata, Colurella<br />
colurus, C. uncinata, Encentrum saundersiae, Lepadella rhomboides) was lower than<br />
during former investigations due to flood conditions this time. Of these the following<br />
are mentioned: These are tychoplanktonic species with primary habitat in the surface<br />
of sediment or the water body among the aquatic vegetation. These species were<br />
drifted to the real plankton.<br />
The Rotatoria and Crustacea plankton of the Tisza along the longitudinal section was<br />
characterized by the dominance of the following species in late September – early<br />
October 2001: Brachionus angularis, B. budapestinensis, B. calyciflorus, Keratella<br />
cochlearis cochlearis, K. c. tecta, Polyarthra dolichoptera, Synchaeta oblonga, S.<br />
pectinata, Bosmina (B.) logirostris, Acanthocyclops robustus.<br />
68
Individual abundaces were much less than during lower water level periods.<br />
Individual numbers per 100 liters varied between 8-12144 in the Tisza, and 12-10704<br />
in the tributaries. Along the longitudinal section of the Tisza this number was actually<br />
between 8-560 and the only large maximum was measured in one occasion at<br />
Tiszacsege sampling site. The same is concluded for the tributaries where the largest<br />
single value was observed in the Zagyva at Szolnok sampling site. In both occasion<br />
some eutrophic Rotatoria species and nauplius and copepode larvae of Copepods<br />
grew out of proportion (Figure 4.2.2.1, Table 4.2.2.1). These values are smaller by<br />
one or in some cases by two orders of magnitude compared to the results of previous<br />
studies conducted during summer, late summer periods. This conclusion is<br />
particularly true for the Kiskörei reservoir and for sections upstream and downstream<br />
of the reservoir. Low individual numbers are particularly striking in the lower Tisza<br />
section at Tiszaug, Mindszent, Szeged regions where at least two magnitudes of<br />
orders higher abundances were measured formerly throughout the year. Low<br />
individual numbers are the results of the flood.<br />
8000<br />
7000<br />
Tiszacsege<br />
12144<br />
6000<br />
5000<br />
i/100 litre<br />
4000<br />
3000<br />
2000<br />
1000<br />
Tiszabecs<br />
Tokaj<br />
Kisköre<br />
Szeged<br />
0<br />
800<br />
700<br />
600<br />
500<br />
Polgár<br />
400<br />
300<br />
200<br />
100<br />
rkm<br />
Figure 4.2.2.1 Abundance of zooplankton during the ITR sampling program on<br />
the Tisza<br />
Individual abundance values on the upper river section are used to be higher by one<br />
magnitude of order but their longitudinal distribution is similar to the one experienced<br />
during previous years: in the section between Tiszabecs and Dombrád (rkm 744-592)<br />
abundances are usually low, downstream of this section (rkm 569-431) this value<br />
increases considerably. In 1992 for example maximum values were found on this<br />
section on the Hungarian stretch of the river. The reason for this is the impoundment<br />
effect of the Tiszalök hydroelectric power dam and Kiskörei reservoir. Downstream of<br />
this the individual abundance monotonously increases towards to the Hungarian-<br />
Yugoslavian border. This was not evidenced by the longitudinal investigations.<br />
Effects of the tributaries on this section usually elevate individual numbers such as<br />
the Hármas Körös and Maros rivers. The flood masked this effect during the period of<br />
investigation.<br />
69
Amongst the other tributaries the Rotatoria and Crustacea plankton of the Sajó near<br />
to confluence point showed the usual mesotrophic state (11 species, 623 ind./100<br />
liter) with dominant species characteristic to eutrophic waters. The medium polluted<br />
water of Zagyva primarily indicates organic material pollution at Szolnok. High<br />
individual numbers of Brachionus-, Keratella-, Polyarthra,- Synchaeta-<br />
Thermocyclops species is recorded with zooplankton numbers 10704 ind./100 liters.<br />
The reason for this is the slow flowing character of the river and highly available<br />
concentrations of plant nutrients.<br />
The other reason of low species and individual numbers is the low availability of food<br />
for the filter feeder Rotatoria and Crustacea species as it is evidenced by the<br />
chlorophyll a concentration values. Chlorophyll-a concentration value ranged 0,41-<br />
4,12 µg/l on the Tisza upstream of the Kiskörei reservoir and 1,84-5,04 µg/l<br />
downstream of the reservoir. No longitudinal increase was practically observed along<br />
the river in chlorophyll-a contents.<br />
The two highest values were measured at the confluence point of the Sajó (15,98<br />
µg/l) and at Szolnok in the Zagyva (732,93 µg/l), where zooplankton stand numbers<br />
were also high.<br />
Summarizing the results of the ITR sampling program conducted in Septemberearly<br />
October it is concluded in general that only 55 Rotatoria and Crustacea species<br />
lived in the Tisza and at the confluence points of its tributaries – in lower than usual<br />
values. Dominant species were however identical to previously observed ones:<br />
Brachionus angularis, B. budapestinensis, B. calyciflorus, Keratella cochlearis<br />
cochlearis, K. c. tecta, Polyarthra dolichoptera, Synchaeta oblonga, S. pectinata,<br />
Bosmina (B.) logirostris, Acanthocyclops robustus. Occurrence of rare species<br />
became even more seldom compared to the results of previous investigations.<br />
Individual abundance values of the animals are usually lower by one-two orders of<br />
magnitude than in previous years during the same season (late summer – early fall).<br />
No increase in individual numbers was observed due to impoundment and on<br />
downstream sections. One possible reason for this is the narrow food resources for<br />
the filter feeder zooplankton species as it is evidenced by the measured low<br />
chlorophyll a concentration values.<br />
70
Table 4.2.2.1. Quantitative data of zooplankton taxa during the ITR sampling program (ind/100l)<br />
TAXA<br />
Sampling sites<br />
2 5 7 8 9 10 11 12 13 14 15 16 17 18 20 21 22 23 24 25 26 27<br />
ROTATORIA<br />
Anuraeopsis fissa (Gosse, 1851) 16<br />
Ascomorpha ecaudis Zacharias, 1893 8<br />
Asplanchna priodonta Gosse, 1850 6 48 8 5056 6<br />
Bdelloideasp. 96 32 8 64 16 16 36 6<br />
Brachionus angularis angularis (Gosse 1851) 144 16 8 64 4<br />
B. budapestinensis budapestinensis Daday, 1885 48<br />
B. calyciflorus calyciflorus Pallas, 1766 12 384 16<br />
B. c.anureiformis Brehm, 1909 8 2 16 576<br />
B. c. spinosus Wierzejski,1891 48 128<br />
B. diversicornis diversicornis (Daday, 1883) 8 64<br />
B. quadridentatus ancylognathus Schmarda, 1859 48<br />
B. q. cluniorbicularis Skorikov, 1894 16<br />
B. q. rhenanus Lauterborn, 1893 384 16<br />
B. urceolaris (O.F.Müller, 1773) 48 64<br />
Cephalodella biungulata Wulfert, 1937 48 6<br />
Cephalodella sp. 4<br />
Colurella colurus (Ehrb., 1830) 16<br />
C. uncinata (Müller, 1773) 6<br />
Encentrum saundersiae (Hudson, 1885) 64<br />
Euchlanis dilatata Ehrb., 1832 4 48<br />
Filinia longiseta (Ehrb., 1834) 48<br />
Keratella cochlearis cochlearis (Gosse, 1851) 8 6 8 1824 32 40 1600 8 32 28 8<br />
K. c. tecta (Gosse, 1851) 4 6 40 2544 64 16 8 2688 32 48 32 32<br />
K. quadrata (O.F.Müller, 1786) 64<br />
Lecane (Monostyla) bulla (Gosse, 1886) 2 8 24 176 4<br />
L. (Monostyla)closterocerca (Schmarda, 1859) 6 4 16 24 128 32 16 96 4 8 6<br />
L. luna (O.F.Müller, 1776) 16 4<br />
L. (Monostyla) lunaris (Ehrb., 1832) 8<br />
Lepadella rhomboides (Gosse, 1886) 32<br />
Notholca squamula (O.F.Müller, 1786) 48<br />
Polyarthra dolichoptera Idelson, 1925 432 40 832 16 32<br />
71
TAXA<br />
Sampling sites<br />
2 5 7 8 9 10 11 12 13 14 15 16 17 18 20 21 22 23 24 25 26 27<br />
P. major Burckhardt, 1900 192<br />
P. vulgaris Carlin, 1943 64 8<br />
Pompholyx sulcata Hudson, 1885 64<br />
Synchaeta oblonga Ehrb., 1831 4 1296 96 216 40 448 288 172 20 8<br />
S. pectinata Ehrb., 1832 1200 16 16 8<br />
Trichocerca birostris (Carlin, 1943) 4 176<br />
T. pusilla (Lauterborn, 1898) 4 48 16<br />
Trichocerca sp. 2 48<br />
Trichotria curta (Skorikov, 1914) 8 12<br />
T. pocillum (Müller, 1776) 4<br />
Sum: 8 16 4 24 10 104 9408 320 352 88 11584 96 544 448 288 40 16 24 12 6 36 24<br />
CLADOCERA<br />
Alona guttata Sars, 1862<br />
Alona sp. 8 16<br />
Bosmina (Bosmina) longirostris (O.F.Müller, 1785) 2 4 32 8<br />
Ceriodaphnia sp. 4<br />
Disparalona rostrata (Koch, 1841) 6 31<br />
Moina micrura Kurz, 1874 16<br />
Sum: 0 0 0 0 8 4 0 0 0 0 48 16 31 16 4 0 0 0 0 0 0 0<br />
COPEPODA<br />
Acanthocyclops robustus (Sars, 1873) 10 32<br />
Cyclops strenuus strenuus Fischer, 1851 6<br />
Cyclops sp. 16 4<br />
Eucyclops serrulatus (Fischer, 1851) 4<br />
E. speratus (Lilljeborg, 1901) 4<br />
Eurytemora velox (Lilljeborg, 1853) 4<br />
Macrocyclops albidus (Jurine, 1820)<br />
Thermocyclops crassus (Fischer, 1853) 192<br />
nauplius Cyclopoida 4 18 14 24 1008 104 24 32 448 16 32 64 12 4 8 12 6 12<br />
copepodit Cyclopoida 16 18 50 28 96 40 16 64 8 16 32 8<br />
Sum 16 16 4 36 88 60 1296 176 40 32 512 24 48 96 20 4 0 8 12 6 12 0<br />
Sum zooplankton 16 16 8 60 106 168 10704 496 392 120 12144 136 623 560 312 44 16 32 24 12 48 24<br />
Number of taxa: 1 3 1 4 10 13 22 11 8 5 18 6 11 6 10 4 2 2 1 1 1 4<br />
72
4.2.3 Macroinvertebrates<br />
The first benthological surveys on the Tisza started in the beginning of the XX.<br />
century dealing with Mollusks (ROTARIDESZ, 1926, 1927a, 1927b, CZÓGLER,<br />
1927, 1935). Several studies can be listed dealing with the aquatic snails and<br />
mussels of the Tisza River after the middle of this century (HORVÁTH 1940, 1943,<br />
1955, 1958, 1962, 1965, 1972, BÁBA 1967, 1974, 1978; FERENCZ 1968; ÁDÁMOSI<br />
et al. 1978; B. TÓTH and BÁBA 1980, 1981; SZÍTÓ and BOTOS 1989, 1993, 1994).<br />
The analysis of the collected material of KOLOSVÁRY and MAJOROS forms the<br />
base of the early Oligochaeta results (ZICSI 1965, FERENCZ 1968, 1969, 1974a,b,<br />
1981); Further literature is available after ÁDÁMOSI et al. (1978); FERENCZ and<br />
SZÍTÓ (1980); SZÍTÓ and BOTOS (1989).<br />
The Malacostraca taxa of the Tisza are reported by LANTOS (1986). Publication on<br />
Palingenia longicauda, the most famous species of the Tisza River are found after<br />
FERENCZ (1968, 1974a, 1974b); CSOKNYA and HALASY (1974). TÓTH (1966a,<br />
1972, 1974), SZÍTÓ and BOTOS (1989) publish several data on Odonata larvae and<br />
imagoes. FERENCZ (1974b) reports data about Trichopteran taxa, especially on the<br />
Lower Hungarian Tisza section.<br />
Very valuable information on Diptera species living in the river is summarized by<br />
TÓTH (1966b, 1967, 1969). FERENCZ (1968) started the description of the<br />
Chironomidae species, later on SZÍTÓ (1972, 1978, 1979, 1987, 1995, 1996);<br />
ÁDÁMOSI et al, (1978), FERENCZ (1974b); FERENCZ and SZÍTÓ (1980); and<br />
SZÍTÓ and BOTOS (1989) published several results on this taxonomic group. PUJIN<br />
(1988) and PUJIN et al. (1984, 1986, 1987) describe the faunal changes of the<br />
Yugoslavian Tisza section caused by modified hydrological conditions.<br />
Several long sectional sampling programs of the Tisza River are reported recently<br />
dealing with the faunal composition: AMBRUS et al. (1995a, 1995b, 1996, 1998);<br />
JUHÁSZ et al.(1998, 1999, 2000); KOVÁCS et al. (1998, 1999a, 1999b, 1999c,<br />
2000); NESEMANN and CSÁNYI, (1993); CSÁNYI et al. (1996); VARGA and CSÁNYI<br />
(1997, 1998-1999).<br />
Before evaluating the results of the macroinvertebrate samples two main points<br />
should be emphasized. Firstly, the taxonomic results reflect to the relatively late<br />
sampling period. Due to the autumn season, several taxon groups were absent from<br />
the Tisza and its tributaries during the ITR mission. Those hemihydrobiont insect taxa<br />
that hatch usually earlier in spring and summer were almost not detectable already,<br />
like numerous known and formerly described species of the mayflies<br />
(Ephemeroptera) and stoneflies (Plecoptera) groups. The exact description of those<br />
species that were still detectable in the Tisza River in earlier seasons one year after<br />
the cyanide spill is given in the <strong>Report</strong> on the Cyanide pollution and its biological<br />
effects (VITUKI 2000, 2001).<br />
Secondly, there was a coincidental high flood during the sampling mission that<br />
caused several difficulties in sampling. The water level of the Tisza has increased<br />
considerably. Flooding always causes very serious difficulties in sampling of such a<br />
large river as the Tisza. Therefore a new sampling method was introduced in the<br />
Tisza investigations. The motorboat of ARGUS was used for dredging the different<br />
73
habitats of the rivers situated at deep water. Dredging is a difficult issue, especially<br />
when it should be done in deep water conditions. It requires much effort and care, at<br />
the same time. However, the results suggest that finally this method was applied very<br />
successfully.<br />
Altogether 107 macroinvertebrate taxa were found during the ITR sampling program<br />
(Table 4.2.3.1). The distribution of the main characteristic taxa is illustrated in<br />
diagrams where the relative abundance estimated in a five degree ordinal scale is<br />
given.<br />
The total number of Mollusca taxa is relatively high (26) compared to the other taxon<br />
groups, especially if the taxon number of the still not completely determined group<br />
(Chironomidae, 23) is not taken in consideration. The lowering water temperature<br />
can explain the absence of some mussel species from the very upstream section of<br />
the Tisza. VITUKI data showed their continuous presence from this stretch long ago.<br />
In case of decreasing water temperature, as the summer period is over, the animals<br />
are migrating to the deeper parts of the river bottom. Therefore it is difficult to find<br />
them due to their extremely low population density.<br />
Several Gastropoda taxa are abundant along the whole Tisza River (Lithoglyphus<br />
naticoides, Bithynia tentaculata, Viviparus acerosus, Valvata naticina). The<br />
population of Theodoxus fluviatilis is permanently expanding toward upstream of the<br />
river during the last decade (VITUKI 1992). Ten years ago this organism was known<br />
only from three localities along the Tisza (ITR 5,6 and 10). At the present ITR study it<br />
was described from Dombrád (ITR 21) also. This species is present in abundant<br />
populations from the Danubian confluence and enters several tributaries like Bega,<br />
Zagyva and Bodrog.<br />
The snails and mussels distribute the Tisza from the tributary, ITR 1 (Titel) until the<br />
ITR 22 (Tuzsér) section. On the upstream section there is only one exception (Figure<br />
4.2.3.1) because of the presence of one snail species (Lithoglyphus naticoides) that<br />
was found at ITR 26 (Tivadar).<br />
The most dominant species of the snails in the Tisza River is Lithoglyphus<br />
naticoides. The abundance values indicate that this species forms the most frequent<br />
snail population along the whole investigated stretch (the maximum abundance value<br />
of 5 appears at 4 sites). Theodoxus fluviatilis is a frequent member of the snail group<br />
with a medium frequency: larger populations are characteristic only on the<br />
downstream section. The species is detected in Dombrád (ITR 21) that represents<br />
the uppermost locality. Viviparus acerosus is the next present species in the<br />
decreasing order of magnitude: downstream sections have a little bit bigger<br />
populations than the middle and upper ones. <strong>Final</strong>ly the fourth snail species in the<br />
decreasing order of abundance is Borysthenia naticina that generally occurs together<br />
with L. naticoides in several rivers (i.e. Danube).<br />
Figure 4.2.3.2 illustrates the distribution of the most dominant mussel species<br />
belonging to the genus Unio. Starting from Titel (ITR 1) to upstream direction,<br />
generally Unio pictorum was found in the largest number. The presence of U.<br />
tumidus is very even also because it can be found in considerable number usually<br />
during the whole investigated Tisza section. The distribution of the U. crassus is just<br />
74
opposite to the U. pictorum. Largest populations were detected rather on the upper<br />
stretches. The maximum population size were characteristic for the upper four<br />
sections (ITR 18, 20, 21, 22). At the uppermost location (in Tuzsér) only U. crassus<br />
was found with a relatively big abundance value.<br />
5<br />
4<br />
Theodoxus fluviatilis<br />
Viviparus acerosus<br />
Lithoglyphus naticoides<br />
Valvata naticina<br />
Relative abundance<br />
3<br />
2<br />
1<br />
0<br />
ITR1<br />
ITR3<br />
ITR4<br />
ITR5<br />
ITR7<br />
ITR9<br />
ITR10<br />
ITR12<br />
ITR13<br />
ITR14<br />
ITR15<br />
ITR16<br />
Sampling location<br />
ITR18<br />
ITR20<br />
ITR21<br />
ITR22<br />
ITR23<br />
ITR24<br />
ITR26<br />
ITR27<br />
Figure 4.2.3.1 Distribution and relative abundance of aquatic snails in the Tisza<br />
River<br />
The other Unionidae species are relatively rare in the Tisza River (Figure 4.2.3.3).<br />
The Chinese pond mussel (Sinanodonta woodiana) is present on the lower and<br />
middle Tisza, it populates the Bega in large number. Its uppermost occurrence was<br />
detected in the Kisköre Reservoir. Pseudanodonta complanata shows similar pattern<br />
to the Unio crassus. Earlier data indicate their co-occurrence on the Upper Tisza<br />
section (at Szatmárcseke, 712 km, VITUKI, 2000). Anodonta anatina and A. cygnea<br />
are rare species in the Tisza, each of them has only two localities in the distribution<br />
map, mainly in the lower and middle stretches.<br />
75
5<br />
4<br />
Unio crassus<br />
Unio pictorum<br />
Unio tumidus<br />
Relative abundance<br />
3<br />
2<br />
1<br />
0<br />
ITR1<br />
ITR3<br />
ITR4<br />
ITR5<br />
ITR7<br />
ITR9<br />
ITR10<br />
ITR12<br />
ITR13<br />
ITR14<br />
ITR15<br />
ITR16<br />
ITR18<br />
ITR20<br />
ITR21<br />
ITR22<br />
ITR23<br />
ITR24<br />
ITR26<br />
ITR27<br />
Sampling sites<br />
Figure 4.2.3.2 Distribution and relative abundance of frequent mussels in the<br />
Tisza River<br />
5<br />
4<br />
Anodonta anatina<br />
Anodonta cygnea<br />
Sinanodonta woodiana<br />
Pseudanodonta complanata<br />
Relative abundance<br />
3<br />
2<br />
1<br />
0<br />
ITR1<br />
ITR3<br />
ITR4<br />
ITR5<br />
ITR7<br />
ITR9<br />
ITR10<br />
ITR12<br />
ITR13<br />
ITR14<br />
ITR15<br />
ITR16<br />
Sampling location<br />
ITR18<br />
ITR20<br />
ITR21<br />
ITR22<br />
ITR23<br />
ITR24<br />
ITR26<br />
ITR27<br />
Figure 4.2.3.3 Distribution and relative abundance of rare mussels in the Tisza<br />
River<br />
76
Some Amphipoda taxa migrating from the Danube have large populations in the<br />
Tisza until the upper section (Figure 4.2.3.4). Dikerogammarus villosus has larger<br />
population density up to Kisköre (ITR 12) than D. haemobaphes but on the stretch<br />
Polgár-Tiszabercel (ITR 16-20) this later one becomes predominant among the<br />
Crustacea species. Obesogammarus obesus was detected sporadically in the lower<br />
and middle section. Gammarus balcanicus occurs only on the uppermost sections of<br />
the Tisza (from Dombrád until to Tiszabecs, ITR 21-27).<br />
5<br />
4<br />
Dikerogammarus haemobaphes<br />
Dikerogammarus villosus<br />
Gammarus balcanicus<br />
Obesogammarus obesus<br />
Relative abundance<br />
3<br />
2<br />
1<br />
0<br />
ITR1<br />
ITR3<br />
ITR4<br />
ITR5<br />
ITR7<br />
ITR9<br />
ITR10<br />
ITR12<br />
ITR13<br />
ITR14<br />
ITR15<br />
ITR16<br />
Sampling location<br />
ITR18<br />
ITR20<br />
ITR21<br />
ITR22<br />
ITR23<br />
ITR24<br />
ITR26<br />
ITR27<br />
Figure 4.2.3.4 Distribution and relative abundance of Amphipoda in the Tisza<br />
River<br />
Other Crustaceans represent the most crucial and characteristic species in the Tisza<br />
and its tributaries, because the damage of two of them by the cyanide spill was well<br />
documented (Figure 4.2.3.5). On one hand, the instantaneous (acute, on-site)<br />
detection of mortality of this species was examined and described at Mindszent (ITR<br />
7) in February 2000. Relevant data are given in the first Cyanide <strong>Report</strong> (VITUKI,<br />
2000). On the other hand, the total absence of Corophium curvispinum was proved<br />
on middle section of the Tisza shortly after the cyanide spill. Prior to the pollution the<br />
uppermost locality for this species was described at ITR 16. Comparing to these<br />
earlier data it is well indicating that the recolonization of the investigated Tisza<br />
section by the species Corophium curvispinum was successful during the last one<br />
and a half year period. High relative abundance values were found on the Tisza<br />
strech, especially up to ITR 10. Further expansion of this species is seen to the<br />
upstream direction because the presence data show that ITR 21 contains this<br />
species, too.<br />
The presence of Jaera istri illustrates the same successful recolonization. This<br />
species prior to the cyanide spill was not detected above Csongrád section at all<br />
(VITUKI 2000, 2001). This time it was found above this point at four further locations:<br />
77
Tiszaug, Szolnok, Kisköre and Tiszafüred, too. Astacus leptodactylus is a common<br />
member of the Crustacea fauna in the Tisza River, especially on the middle strech,<br />
similarly to the previous data.<br />
6<br />
5<br />
Corophium curvispinum<br />
Jaera istri<br />
Astacus leptodactylus<br />
Relative abundance<br />
4<br />
3<br />
2<br />
1<br />
0<br />
ITR1<br />
ITR3<br />
ITR4<br />
ITR5<br />
ITR7<br />
ITR9<br />
ITR10<br />
ITR12<br />
ITR13<br />
ITR14<br />
ITR15<br />
ITR16<br />
Sampling location<br />
ITR18<br />
ITR20<br />
ITR21<br />
ITR22<br />
ITR23<br />
ITR24<br />
ITR26<br />
ITR27<br />
Figure 4.2.3.5 Distribution and relative abundance of other Crustaceans in the<br />
Tisza River<br />
The data on the Crustacea fauna illustrates well that all of those species that were<br />
damaged during the cyanide spill could recover completely. The distributed section of<br />
the Tisza by Corophium curvispinum and Jaera istri increased comparing to earlier<br />
data. Additionally, the abundance of these species has increased, too.<br />
Altogether three characteristic rheophilous insect groups are taken to illustrate the<br />
distribution of them along the Tisza River. The season of autumn is not the most<br />
appropriate period to detect mayfly larvae in rivers but finally 12 taxa were identified<br />
from the investigated section (Table 4.2.3.1). This value compared to the overall<br />
number of 43 described from the Hungarian Tisza (VITUKI 2000, 2001) is not very<br />
big but indicate that some of them are characteristically occurs only on the Upper<br />
Tisza (Figure 4.2.3.6). Heptagenia flava was found on the middle stretch between<br />
Tiszaug and Dombrád (ITR 9-21) at 5 locations. The Tisza Flower (Palingenia<br />
longicauda) larvae were detected only at three Tisza sites (ITR 15, 21,22) having the<br />
hard clay substrate on the river bank. H. longicauda and Caenis pseudorivulorum<br />
both were found on the Upper Tisza strech only at three locations, as well.<br />
The capture data of Ametropus fragilis is very illustrative for the indication of the late<br />
season problem. Normally (springtime) this species colonizes evenly the whole<br />
Hungarian Tisza, similarly to many other species. During the ITR program it was<br />
found mainly on the lower stretch of the river that is very unusual. Those species that<br />
were collected are relatively rare ones in other rivers of Hungary (Baetis fuscatus, B.<br />
78
tricolor, Procloeon bifidum, Ecdyonurus sp., Heptagenia longicauda,<br />
Paraleptophlebia submarginata, Cercobrachys minutus, Caenis pseudorivulorum).<br />
The distribution of the Tisza flower (Palingenia longicauda) shows that during the fast<br />
moving sampling program only few colonized sites were detected in the ITR program<br />
(Maros, the Kiskörei Reservoir, the upper stretch at Dombrád and Tuzsér). The<br />
registered data are convincing about the fact that the Palingenia-colonies are in very<br />
well condition now.<br />
It can be concluded that the taxon number of mayflies is much lower in autumn than<br />
at earlier periods of the year, and the occurrence data of most of them are restricted<br />
rather to the upper river stretches.<br />
All of the four species of the Gomphidae family are living in the Tisza River but their<br />
distribution shows very interesting picture, as well (Figure 4.2.3.7). The most wide<br />
spread is Stylurus (Gomphus) flavipes that is found almost along the whole Tisza<br />
section (between ITR 3 and 24). G. vulgatissimus is also common species, cooccurring<br />
with the former one at several localities. However, two species are<br />
characteristically restricted to the uppermost stretches (G. cecilia and G. forcipatus).<br />
5<br />
4<br />
Heptagenia flava<br />
Heptagenia longicauda<br />
Palingenia longicauda<br />
Caenis pseudorivulorum<br />
Relative abundance<br />
3<br />
2<br />
1<br />
0<br />
ITR1<br />
ITR3<br />
ITR4<br />
ITR5<br />
ITR7<br />
ITR9<br />
ITR10<br />
ITR12<br />
ITR13<br />
ITR14<br />
ITR15<br />
ITR16<br />
ITR18<br />
ITR20<br />
ITR21<br />
ITR22<br />
ITR23<br />
ITR24<br />
ITR26<br />
ITR27<br />
Sampling location<br />
Figure 4.2.3.6 Distribution and relative abundance of mayflies in the Tisza River<br />
79
5<br />
4<br />
Stylurus flavipes<br />
Gomphus vulgatissimus<br />
Ophiogomphus cecilia<br />
Onychogomphus forcipatus<br />
Relative abundance<br />
3<br />
2<br />
1<br />
0<br />
ITR1<br />
ITR3<br />
ITR4<br />
ITR5<br />
ITR7<br />
ITR9<br />
ITR10<br />
ITR12<br />
ITR13<br />
ITR14<br />
ITR15<br />
ITR16<br />
Sampling location<br />
ITR18<br />
ITR20<br />
ITR21<br />
ITR22<br />
ITR23<br />
ITR24<br />
ITR26<br />
ITR27<br />
Figure 4.2.3.7 Distribution and relative abundance of Odonata larvae in the<br />
Tisza River<br />
The distribution of the four detected caddis larvae of the genus Hydropsychidae is<br />
similar to the dragonflies (Figure 4.2.3.8). H. bulgaromanorum is the dominant one<br />
with a wide spread presence along the Tisza River (between ITR 3 and 22) in large<br />
relative abundance. H. contubernalis is not so frequent species. There are two<br />
species again that present only on certain stretches. H. exocellata was found on the<br />
Lower and Upper, H. pellucidula on the Upper Tisza River, respectively.<br />
80
5<br />
4<br />
Hydropsyche contubernalis<br />
Hydropsyche bulgaromanorum<br />
Hydropsyche exocellata<br />
Hydropsyche pellucidula<br />
Relaitve abundance<br />
3<br />
2<br />
1<br />
0<br />
ITR1<br />
ITR3<br />
ITR4<br />
ITR5<br />
ITR7<br />
ITR9<br />
ITR10<br />
ITR12<br />
ITR13<br />
ITR14<br />
ITR15<br />
ITR16<br />
Sampling location<br />
ITR18<br />
ITR20<br />
ITR21<br />
ITR22<br />
ITR23<br />
ITR24<br />
ITR26<br />
ITR27<br />
Figure 4.2.3.8 Distribution and relative abundance of caddis larvae in the Tisza<br />
River<br />
Summarizing the faunal results it can be concluded that the autumn season was not<br />
very perfect for the collection of leeches. Only 7 leech species were detected this<br />
time, almost only from the Bega and the Sajó Rivers. The decreasing water<br />
temperature can explain the low number of leeches, because similarly to the mussels<br />
they start hiding themselves before winter.<br />
The species number of damselflies and dragonflies are 9. Stylurus (Gomphus)<br />
flavipes is widespread species on the sections having extended fine sediment<br />
depositions along the riverbed. Gomphus vulgatissimus is also common, the two<br />
other Gomphidae taxa (Ophiogomphus cecilia, Onycogomphus forcipatus) occurred<br />
only on the uppermost section of the Tisza (ITR 26-27).<br />
Stonefly species were found only in very restricted number (2!) also, due to the very<br />
inappropriate season for their perfect sampling. They could be detected between<br />
December and April in large numbers but strictly on the Upper Tisza stretches. The<br />
detected Isogenus nubecula is always relatively common here.<br />
Saucer bug (Aphelocheirus aestivalis) represents the aquatic bugs by this time only<br />
in the Sajó. Its presence earlier was proved several times on the upper Tisza<br />
(VITUKI, 2000, 2001). There are interesting Coleoptera species occurring in the<br />
Tisza, on the lower, middle and upper stretch as well.<br />
The caddis fauna (Trichoptera) is present almost along the whole river system.<br />
Hydropsyche bulgaromanorum is the most common but only the H. contubernalis<br />
and H. pellucidula reach the uppermost Tisza sections. Neureclipsis bimaculata and<br />
81
Ecnomus tenellus were present in several locations. Some caddis species occurred<br />
only in the upper restricted stretch of the river (Ceraclea nigronervosa, Oecetis<br />
notata).<br />
The analysis of the midges is not finished yet, so their number is going to be still<br />
increasing most probably. At present, 23 Chironomidae species are determined,<br />
most of them on the upper section.<br />
Table 4.2.3.2 Number of macroinvertebrate taxa in the main taxonomic groups<br />
in samples collected during the ITR mission, 2001.<br />
ITR Number 1 2 3 4 5 6 7 8 9 10 11 12 13 14 15 16 17 18 19 20 21 22 23 24 25 26 27<br />
Gastropoda 4 8 5 6 3 0 2 4 2 3 8 3 5 4 3 5 2 3 9 2 2 3 0 0 0 1 0<br />
Bivalvia 7 2 6 6 5 0 5 7 3 3 3 7 8 4 5 5 6 3 4 4 4 3 0 0 0 0 0<br />
Malacostraca 4 1 6 4 4 2 4 3 4 6 0 4 3 4 3 4 4 2 3 3 4 2 0 1 0 1 1<br />
Ephemeroptera 0 0 1 0 1 2 1 0 1 1 0 0 0 2 2 0 1 0 0 0 6 1 1 5 3 4 1<br />
Odonata 0 1 1 1 2 2 2 1 0 1 0 0 2 0 1 1 1 1 3 3 3 2 1 5 5 1 2<br />
Plecoptera 0 0 0 0 0 0 0 0 0 0 0 0 0 0 0 0 0 0 0 0 1 0 0 2 0 1 2<br />
Trichoptera 1 0 4 2 4 4 3 3 3 2 1 3 3 2 2 5 4 2 4 3 4 4 1 0 5 1 2<br />
Number of<br />
16 12 23 19 19 10 17 18 13 16 12 17 21 16 16 20 18 11 23 15 24 15 3 13 13 9<br />
taxa/sampling site<br />
8<br />
Table 4.2.3.2 and Figures 4.2.3.9 and 4.2.3.10 show the taxonomic composition of<br />
the main macroinvertebrate groups along the Tisza and its tributaries. Only the main<br />
groups are considered, Chironomidae are not included because the analysis is still<br />
going. It is clear that Molluscs (snails and mussels) are almost absent from the upper<br />
section of the Tisza. Only Lithoglyphus naticoides occurred in Tivadar (ITR 26).<br />
There are no detected snails and mussels in the Maros and Szamos rivers at all. At<br />
the same time the group of insects dominates on this upper Tisza stretches. This<br />
conclusion is valid even in this case of late autumn season although many<br />
characteristic insect taxa are not present already, due to their earlier hatching time.<br />
82
25<br />
20<br />
Number of taxa in groups<br />
15<br />
10<br />
Trichoptera<br />
Plecoptera<br />
Odonata<br />
Ephemeroptera<br />
Malacostraca<br />
Bivalvia<br />
Gastropoda<br />
5<br />
0<br />
1 3 4 5 7 9 10 12 13 14 15 16 18 20 21 22 23 24 26 27<br />
ITR number<br />
Figure 4.2.3.9 Number of macroinvertebrate taxa belonging to the main<br />
taxonomic groups at different sampling sites on the Tisza River<br />
There were no Plecoptera taxa present at all in any of the tributaries. The highest<br />
number of the main taxonomic groups (6) was found in the River Sajó, that was<br />
formerly the most polluted Hungarian river. Due to the industrial collapse in both<br />
Slovakian and Hungarian regions, the water quality and the river fauna improved a lot<br />
during the recent decade.<br />
25<br />
Bodrog<br />
20<br />
Hármas-Körös<br />
Sajó<br />
Taxon number in main groups<br />
15<br />
10<br />
Béga<br />
Maros<br />
Zagyva<br />
Szamos<br />
Trichoptera<br />
Plecoptera<br />
Odonata<br />
Ephemeroptera<br />
Malacostraca<br />
Bivalvia<br />
Gastropoda<br />
5<br />
0<br />
2 6 8 11 17 19 25<br />
ITR number<br />
Figure 4.2.3.10 Number of macroinvertebrate taxa belonging to the main<br />
taxonomic groups at different sampling sites on the tributaries<br />
83
The same faunal composition of the Tisza can be seen from the more general picture<br />
when only three main taxonomic groups, Mollusca, Malacostraca and Insecta are<br />
presented (Figure 4.2.3.11). It is clear from the appearing mollusk taxa where the<br />
middle stretch of the Tisza River starts. The characteristic Upper Hungarian Tisza<br />
represents only a very restricted spatial extension that is found only upstream the<br />
Szamos confluence.<br />
25<br />
20<br />
Taxon number of main groups<br />
15<br />
10<br />
Insecta<br />
Malacostraca<br />
Mollusca<br />
5<br />
0<br />
1 3 4 5 7 9 10 12 13 14 15 16 18 20 21 22 23 24 26 27<br />
ITR number<br />
Figure 4.2.3.11 Number of macroinvertebrate taxa belonging to the main<br />
taxonomic groups at different sampling sites on the Tisza River<br />
84
Table 4.2.3.1 Relative abundance of macroinvertebrate taxa collected during<br />
the ITR mission, 2001.<br />
ITR NO. 1 2 3 4 5 6 7 8 9 1011 12 13 14 15 16 17 18 19 20 21 22 23 24 25 26 27<br />
Puhatestűek (Mollusca)<br />
Theodoxus fluviatilis (LINNAEUS, 1758) 2 2 3 3 3 2 2 3 2 2 2 1 2 2 2 3 2<br />
Viviparus acerosus (BOURGUIGNAT, 1862) 2 2 2 1 1 2 1 1 1<br />
Lithoglyphus naticoides (C. PFEIFFER,<br />
5 1 4 4 4<br />
1828)<br />
4 3 3 3 2 4 5 5 4 3 3 5 5 4 2 2 3<br />
Bithynia tentaculata (LINNAEUS, 1758) 2 1 3 2 2 1 2<br />
Valvata naticina (MENKE, 1845) 1 2 2 1 2 1 1 2 1 2<br />
Valvata piscinalis (O. F. MÜLLER, 1774) 2 2<br />
Acroloxus lacustris (LINNAEUS, 1758) 1 1 1 1 1<br />
Lymnaea auricularia (LINNAEUS, 1758) 1<br />
Lymnaea peregra var.ovata<br />
(DRAPARNAUD)<br />
2 2 1 1<br />
Physa acuta DRAPARNAUD, 1805 1 1 2 1 1<br />
Anisus spirorbis (LINNAEUS, 1758) 2<br />
Planorbarius corneus (LINNAEUS, 1758) 1 1 1<br />
Planorbis planorbis (LINNAEUS, 1758) 1<br />
Kagylók (Mollusca: Bivalvia)<br />
Unio crassus RETZIUS 1788 1 1 2 1 3 2 1 2 2 2 1 1 1 3 1 3 3 3<br />
Unio pictorum (LINNAEUS, 1758) 2 4 4 3 2 2 2 3 3 3 2 3 3 2 2 1<br />
Unio tumidus RETZIUS 1788 3 3 2 2 2 3 2 3 3 2 3 3 3 2 2 3 1 2<br />
Anodonta anatina (LINNAEUS, 1758) 1 1 1<br />
Anodonta cygnea (LINNAEUS, 1758) 1 1<br />
Sinanodonta woodiana (LEA, 1834) 1 3 1 1 2 1 1 1<br />
Pseudanodonta<br />
complanata<br />
(ROSSMASSLER, 1835)<br />
1 1 1 1 1 1 1 1<br />
Dreissena polymorpha (PALLAS, 1771) 2 2 4 2 3 3 1 2 2 3 2 1 2<br />
Pisidium amnicum (O. F. MÜLLER, 1774) 1 1 1 2 2<br />
Pisidium henslowanum (SHEPPARD, 1823) 1 1<br />
Pisidium moitesserianum (PALADILHE,<br />
1866)<br />
1<br />
Sphaerium corneum (LINNAEUS, 1758) 1<br />
Sphaerium rivicola (LAMARCK, 1815) 1 1 1 1 1<br />
Kevéssertéjűek (Oligochaeta)<br />
Oligochaeta sp. 2 4 3 3 2 2 2 3 3 3 2 2 3 2 3 3 2 1<br />
Piócák (Hirudinea)<br />
Hemiclepsis marginata (MÜLLER, 1774) 1<br />
Glossiphonia complanata (LINNAEUS,<br />
1758)<br />
1 1<br />
Alboglossiphonia heteroclita (LINNAEUS,<br />
1761)<br />
2 1<br />
Alboglossiphonia hyalina (MÜLLER, 1774) 2<br />
Piscicola geometra (LINNAEUS, 1761) 1<br />
Erpobdella octoculata (LINNAEUS, 1758) 1 2<br />
Helobdella stagnalis (LINNAEUS, 1761) 2 2<br />
Rákok (Crustacea)<br />
Limnomysis benedeni CZERNIAVSKY 1882 1 1<br />
Corophium curvispinum (SARS, 1895) 2 4 4 4 2 4 2 4 5 2 2 2 3 4 4 3 3 1<br />
Dikerogammarus<br />
haemobaphes<br />
3<br />
(EICHWALD, 1841)<br />
1 3 2 2 2 2 2 2 2 2 3 3 3 2 3 2 2<br />
85
ITR NO. 1 2 3 4 5 6 7 8 9 1011 12 13 14 15 16 17 18 19 20 21 22 23 24 25 26 27<br />
Dikerogammarus villosus (SOVINSKY,<br />
1894)<br />
2 4 4 3 1 4 2 2 3 4 2 3 2 2 2 2<br />
Gammarus balcanicus SCHAFERNA, 1922 1 1 1 2 2<br />
Obesogammarus obesus (SARS, 1894) 2 1 1<br />
Asellus aquaticus (LINNAEUS, 1758) 1 2<br />
Jaera istri VIEUILLE, 1979 1 3 3 1 2 1 2<br />
Astacus leptodactylus ESCHSCHOLZ, 1823 1 1 1 2 2 1<br />
Kérészek (Ephemeroptera)<br />
Ametropus fragilis ALBARDA, 1878 1 2 1 1 1<br />
Baetis fuscatus (LINNAEUS, 1761) 1<br />
Baetis tricolor TSHERNOVA, 1928 2 1 2<br />
Procloeon bifidum (BENGTSSON, 1912) 1<br />
Ecdyonurus sp. 1 2<br />
Heptagenia flava ROSTOCK, 1877 1 1 1 2 1 1<br />
Heptagenia longicauda (STEPHENS, 1836) 2 1 1 1<br />
Paraloptophlebia<br />
submarginata<br />
(STEPHENS, 1835)<br />
1<br />
Ephemera vulgata LINNAEUS, 1758 1<br />
Palingenia longicauda OLIVIER, 1791 1 1 2 2<br />
Cercobrachys minutus (TSHERNOVA,<br />
1952)<br />
1 1<br />
Caenis pseudorivulorum KEFFERMÜLLER,<br />
1960<br />
1 1 3<br />
Szitakötők (Odonata)<br />
Calopteryx splendens (HARRIS, 1782) 1 1 1 1 1 3 1<br />
Platycnemis pennipes (PALLAS, 1771) 2 1 1 2<br />
Stylurus flavipes (CHARPENTIER, 1825) 3 2 2 2 2 1 2 2 1 1 2 3 2 1 1 2<br />
Gomphus vulgatissimus (LINNAEUS, 1758) 2 1 1 2 1 2 1 1 3<br />
Ophiogomphus cecilia (FOURCROY, 1785) 1 2<br />
Onychogomphus forcipatus (LINNAEUS,<br />
1758)<br />
2<br />
Ishnura elegans pontica SCHMIDT, 1938 2<br />
Coenagrion puella (LINNAEUS, 1758) 2<br />
Orthetrum albistillum (LINNAEUS, 1758) 1<br />
Álkérészek (Plecoptera)<br />
Isogenus nubecula NEWMAN, 1833 2 1 2 2<br />
Leuctra sp. 1 2<br />
Poloskák (Heteroptera)<br />
Aphelocheirus aestivalis (FABRICIUS, 1803) 1<br />
Bogarak (Coleoptera)<br />
Macronychus quadrituberculatus (P.W.<br />
J.MÜLLER, 1806)<br />
1 1 1 1<br />
Potamophilus maculatus 1 1<br />
Tegzesek (Trichoptera)<br />
Hydropsyche contubernalis MCLACHLAN,<br />
1865<br />
3 3 1 2 3 2 2<br />
Hydropsyche contubernalis masovica<br />
MALICKY, 1977<br />
1<br />
Hydropsyche bulgaromanorum MALICKY,<br />
1977<br />
2 3 3 3 3 2 3 3 2 2 1 3 4 3 1 2 3 4<br />
Hydropsyche exocellata DUFOUR, 1841 1 1 1 2 1<br />
Hydropsyche pellucidula CURTIS, 1834 1 1 2 1<br />
Hydropsyche sp. 3 3 2 1<br />
86
ITR NO. 1 2 3 4 5 6 7 8 9 1011 12 13 14 15 16 17 18 19 20 21 22 23 24 25 26 27<br />
Neureclipsis bimaculata (LINNAEUS, 1758) 1 2 1 1 1 1 1 1 4 2 1 2 2 2 1 2 2 2 3 2 2<br />
Holocentropus dubius (RAMBUR, 1842) 1<br />
Holocentropus picicornis (STEPHENS,<br />
1836)<br />
1<br />
Ecnomus tenellus (RAMBUR, 1842) 1 1 1 1 3 1<br />
Ceraclea nigronervosa (RETZIUS, 1784) 1<br />
Oecetis notata (RAMBUR, 1842) 1 1 2<br />
Kétszárnyúak (Diptera)<br />
Ceratopogonidae sp. 1 1 1 1<br />
Chironomidae sp. 1 1 1 1 1 1 1 2 2 1 1<br />
Telopelopia fascigera (VERNEAUX, 1970) 1 1<br />
Brillia longifurca 1 3 2<br />
Cricotopus sylvestris (FABRICIUS, 1794) 1<br />
Gymnometriocnemus brumalis (EDWARDS,<br />
1929)<br />
1<br />
Orthocladius obumbratus JOHANNSEN,<br />
1905<br />
1<br />
Rheocricotopus effusus (WALKER, 1856) 1<br />
Rheocricotopus fuscipes (KIEFFER, 1909) 1<br />
Chironomus muratensis 1<br />
Chironomus nudiventris 1 3 5 5 1 1<br />
Chironomus obtisidens GOETGHEBUER,<br />
1921<br />
2 1 2 1 2<br />
Chironomus plumosus (LINNAEUS, 1758) 1 2 1<br />
Chironomus riparius MEIGEN, 1804 1 1<br />
Dicrotendipes nervosus (STAEGER, 1839) 1<br />
Glyptotendipes glaucus (MEIGEN, 1818) 1 5<br />
Glyptotendipes pallens MEIGEN, 1804 3<br />
Glyptotendipes sp. 1<br />
Paratendipes intermedius 1<br />
Paracladopelma laminata (KIEFFER, 1921) 1<br />
Polypedilum pedestre MEIGEN, 1804 1 2<br />
Stictochironomus pictulus (MEIGEN, 1830) 1 2 2<br />
Stictochironomus sticticus (FABRICIUS,<br />
1781)<br />
1 2 1 2<br />
Lipiniella moderata 2 2 1<br />
Kiefferulus<br />
tendipediformis<br />
GOETGHEBUER, 1921<br />
2<br />
Psychodidae lárva 1<br />
Data in Table 4.2.3.1 show that the tributaries have several macroinvertebrate taxa,<br />
as well. The main importance is given to the faunal results of the Szamos River<br />
because the cyanide spill arrived through that river course to the region. Although the<br />
Mollusca and Crustacea fauna of the Szamos is very poor (it was very poor even<br />
before the cyanide spill!) other taxonomic groups like insects are represented in large<br />
species numbers. Mayflies, dragonflies and damselflies, caddis larvae have to be<br />
considered as normal faunal elements of the Szamos River. These results are in high<br />
concordance with the results of earlier hydrobiological monitoring data (VITUKI 2000,<br />
2001).<br />
87
4.2.4 Multivariate analysis of macroinvertebrates<br />
Multivariate methods for hierarchical classification and ordination of sampling sites of<br />
the River Tisza, as objects based on the macroinvertebrate fauna provide<br />
appropriate division of different sections of the river. Three similarity indices (Jaccard,<br />
Sorensen and Chord distance) resulted in very similar dendrograms after the cluster<br />
analysis (Figure 4.2.4.1). The biplot of ordination gives similar division of the<br />
investigated Tisza section to the classification result (Figure 4.2.4.2). Table 4.2.4.1<br />
shows the serial numbers of the Tisza sampling sites in order to the identification of<br />
the objects during different multivariate analyses.<br />
Table 4.2.4.1 Serial number and ITR number of sampling sites on River Tisza<br />
Station Town/Location or Tributary Kmindex<br />
No.<br />
Name<br />
index<br />
Station Town/Location or Tributary Km-<br />
No. No.<br />
No.<br />
Name<br />
ITR 1 1 Titel, Danubian confluence 2 ITR 15 11 Tiszacsege 453<br />
ITR 3 2 Novi Becej 66 ITR 16 12 Polgár 498<br />
ITR 4 3 Novi Knezevac 147 ITR 18 13 Rakamaz-Tokaj 544<br />
ITR 5 4 Szeged, old city bridge 174 ITR 20 14 Tiszabercel 569<br />
ITR 7 5 Mindszent 216 ITR 21 15 Dombrád 592<br />
ITR 9 6 Tiszaug, híd 266 ITR 22 16 Tuzsér 616<br />
ITR 10 7 Szolnok 334 ITR 23 17 Aranyosapáti 669<br />
ITR 12 8 Kisköre 404 ITR 24 18 Gergelyiugornya 685<br />
ITR 13 9<br />
Aranyosi-sziget (Kisköre<br />
419<br />
Reservoir)<br />
ITR 26 19 Tivadar 705<br />
ITR 14 10 Tiszafüred-Poroszló 431 ITR 27 20 Tiszabecs 744<br />
Instead of ITR numbers, the serial numbers are used for the evaluation of the<br />
clustering and ordination results (see Table 4.2.4.1) because the tributaries are<br />
excluded from the analysis due to their very different character.<br />
According to the three illustrating dendrograms (Figure 4.2.4.1), Novi Becej and<br />
Szeged (2 and 4), Tiszaug and Szolnok (6 and 7), and, two sites in the Kisköre<br />
Reservoir, Kisköre (8) and Aranyosi-sziget (9) are the most similar to each other<br />
based on their macroinvertebrate assemblages. On the other hand, a very long Tisza<br />
section representing the stretch from Titel up to Dombrád (ITR 1-21) forms one<br />
cluster containing altogether the lower 15 sites. The mentioned tree very similar pairs<br />
of sampling sites are involved in this main cluster.<br />
A smaller individual subgroup can be recognized in this main one, containing the<br />
serial numbers of 11, 14, 13 and 15 (Tiszacsege, Tokaj, Tiszabercel and Dombrád).<br />
They are a bit separated from the others because characteristic occurrences of some<br />
macroinvertebrate taxa (i.e. mussels, snails, dragonflies).<br />
The sharp division along the Tisza occurs after Dombrád. The upper five sampling<br />
sites of the Tisza occur separately from the lower 15 in another group. Sites 16 and<br />
17 (Tuzsér and Aranyosapáti) stay individually on the dendrogram, but sites 18, 19<br />
and 20 (Gergelyiugornya, Tivadar and Tiszabecs) form a well-separated cluster from<br />
all the others.<br />
88
Jaccard similarity index Soerensen-similarity Chord distance<br />
index<br />
Figure 4.2.4.1 Plots of dendrogram of objects (sampling sites of River Tisza)<br />
after hierarchical clustering<br />
89
B<br />
19<br />
18<br />
16<br />
C<br />
15<br />
20<br />
17<br />
A<br />
Figure 4.2.4.2 The biplot of sampling sites and macroinvertebrate taxa<br />
(both are indicated by serial numbers, dotted lines are showing the numbers of the<br />
sampling sites)<br />
The result of the ordination is very similar to the outcome of cluster analysis.<br />
Sampling sites 1-14 are sorted in two near groups (A). These are the Lower and<br />
Middle sections, respectively. The locations between Titel (ITR 1, No.1), the<br />
confluence section and Tiszabercel (ITR 20, No.14) are grouped in that group. There<br />
are three sites along a line (No.15, 16 and 17) that are signed by C. These are the<br />
intermediate sections between the Upper and middle stretches. <strong>Final</strong>ly, serial<br />
numbers 18, 19 and 20 (ITR 24, 26, 27) are sorted in group B indicating the defined<br />
Upper stretch of the Tisza River characterized by the insect groups.<br />
Summarizing the faunal results it can be demonstrated, that:<br />
• Beside of the late autumn season, numerous characteristic macroinvertebrate<br />
groups were collected on the investigated Tisza stretch;<br />
• Based on the faunal data it can be seen clearly that no evidence of cyanide or<br />
heavy metal pollution is detectable on the Tisza River. All of the most<br />
important taxonomic groups are present in relatively large taxon numbers<br />
along the whole river stretch. All of those taxonomic groups that were affected<br />
immediately after the cyanide pollution (Crustaceans, Ephemeropterans,<br />
Trichopterans and Dipterans) were recovered and repopulated the sections<br />
both in terms of taxa and earlier abundance.<br />
• Crustaceans were especially damaged immediately after the spill. Nowadays<br />
all of the taxa repopulated the affected Tisza and Szamos stretches well.<br />
90
5 Investigation of Tisa River- Fish fauna<br />
5.1 Introduction<br />
An investigation of river fish fauna was initiated by the international commission for<br />
the protection of Danube river within in the frame of the Joint Danube Survey-<br />
Investigation of the Tisa river. The aim of the study was to examine whether the<br />
chemical accidents in the year 2000 caused damages to fish fauna. In addition the<br />
study was addressed to find out whether endocrine disrupting chemicals are present<br />
in the Tisa river. In order to ensure the comparability of data obtained from River Tisa<br />
with results from other European rivers a research strategy was applied which had<br />
been developed by the Hessian Agency for the Environment (HLUG) on behalf of the<br />
German Ministry for Science and Education BMBF (Stahlschmidt-Allner et al. 1997,<br />
Allner et al. 2001).<br />
There is growing concern regarding environmental pollution causing reproductive<br />
failure in vertebrates including humans. A wide range of chemicals are suspected to<br />
act as endocrine disrupters on wild living fish. Apart from industrial organic chemicals<br />
and agrochemicals heavy metals are thought to interrupt the endocrine control of<br />
reproduction. HLUG monitoring concept is addressed to investigate anthropogenic<br />
effects on riverine fish fauna with special emphasis on reproductive functions.<br />
Results of the Hessian studies indicate an anthropogenic impact on fish reproductive<br />
functions in River Rhine tributaries with a high amount of sewage treatment plant<br />
discharges. River Tisa is thought to present a suitable area of investigation to carry<br />
out a comparative study, since the socio-geographic conditions differ of xenobiotic<br />
pollution, sewage treatment plant technology and hydrogeology. In addition the<br />
preceding chemical accident represents an anthropogenic impact on riverine fish<br />
fauna which requires adequate research activities.<br />
The HLUG research strategy is based on the analysis of fish species diversity and<br />
abundance of species. In order to examine whether anthropogenic impairments of<br />
vertebrate reproductive health took place in the riverine environment two indicator<br />
species from different teleost taxonomic orders where investigated in detail. The<br />
basic mechanism of endocrine control of reproduction differ between perciform and<br />
cyprinid teleost. Presupposed species from either taxa belong to the fish fauna of the<br />
area under investigation, it is advisable to investigate a perciform fish as well as<br />
cyprinid species. The biomarker which are used to give a comprehensive description<br />
of the condition of the individual fish are listed in Table 5.1. In addition to data on<br />
species diversity, abundance and growth data of line 1-5 will provide an insight into<br />
the general condition of fish fauna of the area under investigation.<br />
Data of line 6-8 will provide evidence of pollution causing reproductive failure of<br />
vertebrates.<br />
91
Table 5.1: Biomarker<br />
Biomarker Tissue Method<br />
1 Age Scales<br />
Annual ring<br />
determination<br />
2 Growth Fish Weight and length<br />
3 Parasitiziation<br />
Skin, gill,<br />
gut,<br />
coelomic<br />
cavity<br />
Microscopy<br />
Compounds proved to<br />
alter the adequate<br />
endpoints in laboratory<br />
Experiments<br />
Pesticides, immunotoxic<br />
compounds<br />
4 Sex ratio Gonads Microscopy Estrogenic compounds?<br />
Weigh,<br />
5 Gonadal weight Gonads<br />
corpulenz index<br />
Gonadosomatic TBT, Phenylurea<br />
Index calculation, herbicides<br />
5<br />
6<br />
7<br />
8<br />
9<br />
Gonadotropinsynthesis,<br />
neuroendocrine<br />
control<br />
of reproduction<br />
Paradoxical<br />
Induction of yolk<br />
protein synthesis<br />
(Vitellogenin) in<br />
male fish<br />
Intersexuality<br />
Testis ova<br />
Estradiol<br />
biosynthesis<br />
Pituitary<br />
Blood<br />
Gonads<br />
Gonads<br />
Immunhistochemistry<br />
Electrophoresis of<br />
plasma proteins<br />
immunological<br />
identification of<br />
western blotted<br />
protein<br />
Histology<br />
Immunhistology<br />
Tritiated water assay<br />
Heavy metals<br />
Bisphenol A,<br />
Ethinylestradiol,<br />
Alkylphenolethoxylate,<br />
biodegradation products,<br />
endosulfan, PCB, DDT,<br />
TBT, other tinorganic<br />
compounds<br />
TBT other tinorganic<br />
compounds,<br />
Criteria to select sampling sites are agricultural impacts, degree of pollution caused<br />
by sewage treatment plant discharges, hydrogeological and industrial impacts.<br />
Basing on these criteria it was suggested to examine 6 sampling sites in the course<br />
of a 14 days sampling period.<br />
5.2 Methods<br />
During the sampling period 27 th of September until the 7 th of October 2002 a flood in<br />
the downstream area of Tisa River caused a disarrangement of shore habitats.<br />
Therefore it was impossible to ascertain data on species diversity and abundance<br />
which were comparable neither to not flooded River Tisa upstream sites nor to the<br />
HLUG monitoring strategy previously applied in course of the River Rhine survey.<br />
These circumstances forced a modification of the sampling plan. In order to avoid<br />
fishing in areas where the run away of the flood was still going on, we started the<br />
investigation of fish fauna with the most upstream sampling sites at Tivadar, where<br />
the flood already passed. It was necessary to limit the investigation of River Tisa from<br />
km 705 to km 334. According to the proposals of Hungarian experts finally the<br />
following sampling sites were selected (Table 5.2):<br />
92
Table 5.2: Sampling sites<br />
Sampling site Characteristic Indicator<br />
1.Tivadar<br />
low degree of<br />
anthropogenic impact,<br />
upstream Szamos mouth<br />
2. Gergelyiugornya Szamos mouth, where<br />
supply of of cyanide and<br />
heavy metals took place<br />
3. Sajo tributary , with a high<br />
degree of industrial impact,<br />
no damages caused by<br />
accidental pollution via<br />
Szamos<br />
4. agro-chemical<br />
plant<br />
5.Tizafüred<br />
impact of a singel<br />
discharge<br />
area of Tisa lake; hydraulic<br />
engineering techniques<br />
were applied to prevent<br />
the nature reserve from<br />
contamination with the<br />
heavy metals and cyanide,<br />
supplied via Szamos River<br />
during the periods of<br />
accidental pollution.<br />
species<br />
bleak,<br />
chub<br />
bleak<br />
chub<br />
bleak<br />
ide<br />
bleak<br />
ide<br />
bleak<br />
ide<br />
6. Szolnok industrial centre, ide<br />
bleak<br />
7. Titel cause of the flood only species<br />
diversity,- abundance and<br />
parsitization were investigated,<br />
Figure 5.1: Map with sampling sites<br />
As mentioned before, due to the flood it was impossible to investigate the impact of<br />
the eastern tributary Maros River at Szeged.<br />
Analysis of species diversity of Titel sampling site revealed that the abundance of<br />
perciform fish in River Tisa was surprisingly low. The number of individuals collected<br />
from Perca fluviatilis, a predominant species in middle and west European rivers,<br />
was not sufficient for a statistical analysis of the results. This situation caused to<br />
choose the small sized cyprinid Alburnus alburnus (bleak) as indicator fish. This<br />
surface feeding species is thought to be present over the total stretch of the river.<br />
Additionally Leuciscus cephalus (chub) and Leuciscus idus (ide) which are the<br />
predominant species of the upstream and the downstream region respectively were<br />
investigated as indicator species for endocrine disruption. In contrast to bleak, chub<br />
and ide are related to the benthic food chain.<br />
These modifications had the following consequences on the monitoring design:<br />
1. Sex determination in cyprinid fish requires microscopically/histologically<br />
examination of gonadal tissue preparation, whereas macroscopically investigation<br />
of gonadal anatomy is sufficient to provide evidence for gender of perciform fish.<br />
Therefore the lack of suitable perciform species caused an increased expenditure<br />
of work in the course of sex ratio determination.<br />
2. Gonadotropin producing pituitary cells in cyprinids are spread over the entire<br />
organ, whereas in perciformes gonadotropic cells are arranged as a compact<br />
tissue and restricted to defined areas of the gland. The application of<br />
93
immunhistological methods to identify gonadotropic cells in cyprinides represent a<br />
time consuming procedure and requires sophisticated morphometric techniques.<br />
This situation forced to step down monitoring neuroendocrine control of<br />
reproduction on the pituitary level in favour of sex ratios determinations of the<br />
cyprinid indicator species monitored in course of the survey.<br />
3. The consequences of the organisational alterations of the survey forced by the<br />
flood was, that the laboratory boat ARGUS was not available for the fish fauna<br />
investigation of the upstream sites. Fishing there was carried out by using cars<br />
and rubber dinghy (Figure 5.2b). Tissue collection was performed at the shore by<br />
using mobile laboratory equipment (Figure 5.2a). Under this working condition<br />
storage of gonadal tissue suitable for measurement of aromatase activity (in liquid<br />
nitrogen or at –80°C) was not possible and monitoring of this biomarker had to be<br />
cancelled.<br />
Figure 5.2a. Field “laboratory”<br />
Figure 5.2b. Electrofishing team<br />
Fish were caught by electrofishing using strength of electric current between 3 and 6<br />
ampere. Applying this method only individuals inhabiting the shallow water area up to<br />
1m in depth and 1-3 m distanced from the shore were considered. Species variation<br />
and analysis of species abundance was carried out immediately. Fish of nonindicator<br />
species were put back into the river. So far available maximal 40 individuals from the<br />
indicator species were killed by cervical dislocation. Blood samples for vitellogenin<br />
determination were taken from the dislocating cut. After weighing and measuring of<br />
the fish the gonads of individuals > 4 cm were removed and weighed for<br />
gonadosomatic index calculation. An aliquot of gonadal tissue was examined<br />
microscopically directly for sex determination. The remaining gonadal tissue was<br />
fixed in Bouin-Hollandes fluid for histopathological investigation. Further an aliquot of<br />
liver tissue was fixed for immunohistological identification of vitellogenin and liver<br />
histopathology. Since gonads of fish smaller than 4 cm are not recognisable by<br />
stereomicroscopical investigation of the body cavity these specimen were fixed in<br />
toto for histological sex determination.<br />
94
Vitellogenin determination<br />
Depending on the size of the fish blood for vitellogenin determination was collected in<br />
5-50µl steps from the dislocation cut by using Eppendorf-pipettes. Blood samples<br />
were transferred immediately into a buffer solution containing the protease inhibitor<br />
Aprotinin in order to avoid proteolysis. After centrifugation (5min 5.000 x g) the<br />
supernatant was stored at –18°C until electrophoretical separation of blood proteins<br />
by SDS-PAGE according to Allner et al. (1999).<br />
SDS-PAGE identification of serum vitellogenin was verified by using immunological<br />
methods. Carp vitelogenien antisera according to Hennies et al. (2002) were applied<br />
for the immunological identification of serum proteins by western blot.<br />
Age determination<br />
Age determinations were carried out by scale analysis. 20-30 scales from the dorsal<br />
trunk region were taken and stored in small paper bags until analyses. To check the<br />
number of annual growth rings microscopically, epidermal residues were removed<br />
using an household dish washing detergent. Cleaned scales were fixed between two<br />
microscope slides and were examined microscopically. Age-growth classes were<br />
determined, basing on age determination of 35-40 individuals of each sampling site.<br />
Sex ratio determination<br />
Determination of sex ratio was carried out by microscopically check of aliquots of<br />
fresh gonadal tissue immediately after removal of the organ in course of tissue<br />
sampling. When the microscopically examination of unfixed unstained tissue did not<br />
provide evidence for the gender of the individual, sex was determined by histological<br />
investigation of fixed gonadal tissue. The confidence interval indicating the range of<br />
possible values of sex ratio within the population in relation to the spot check at the<br />
95% level was calculated by using the formula:<br />
np(1<br />
− p)<br />
dp = *1,96<br />
n<br />
5.3. Results and discussion<br />
Results of faunal investigation<br />
n = number of samples<br />
p = frequency of one (of two) alternatives<br />
In course of the survey 42 species of fish were proved to belong to the River Tisa fish<br />
fauna (Figure 5.3). The highest species diversity was observed in the area of Tisa<br />
mouth at Titel (24 species). These findings confirm the assumption that species<br />
diversity is mainly influenced by geographical impacts of the watershed. Assuming<br />
increasing species diversity in downstream areas of rivers as a general pattern of<br />
species distribution, the number of species found at Tisa Lake (22 species, at km<br />
431) and Gergelyiugornya (20 species, at km 685) are surprisingly high. These<br />
findings indicate an impact of habitat structure on species diversity. Both sites<br />
provide shallow and sandy shore regions or a macrophyte stand. The comparison of<br />
species diversity between Szamos mouth area (Gergelyiugornya, 20 species, at km<br />
685) and the upper most sampling site Tivadar (10 species, at km 705) does not<br />
provide evidence for a reduction of species diversity caused by accidental pollution in<br />
2000 via Szamos River. The lowest species diversity (8 species) was estimated 100<br />
km downstream from Tisa Lake at Szolnok (km 334). Further predominance of<br />
species showing a high degree of benthos orientation at this site is remarkable.<br />
95
The number of fish caught at the different sampling sites decreased downstream<br />
(n=463 at Tivadar to n=142 at Szolnok). This result reflects a semi quantitative<br />
measure of fishing success and thereby of the abundance of fish at different<br />
sampling sites. Regarding the fishing success in the area of Sajo mouth it is<br />
important to emphasise that no fish were caught over a stretch of 700 m downstream<br />
the discharge of the agrochemical plant and in Sajo River from km 0,8 to 1,5.<br />
90<br />
80<br />
70<br />
72,1<br />
n = 463<br />
60<br />
50<br />
40<br />
Tivadar Tivarda<br />
30<br />
20<br />
10<br />
0<br />
10,6<br />
Alburnus alburnus<br />
Leuciscus cephalus<br />
Leuciscus idus<br />
Abramis bjoerkna<br />
0<br />
0<br />
11,9<br />
Alburnoides bipunctatus<br />
Abramis sapa<br />
Sander lucioperca<br />
Rutilus rutilus<br />
Gobio albipinnatus<br />
0<br />
0<br />
0<br />
0,2<br />
Perca fluviatilis<br />
Carassius gibelio<br />
Chondrostoma nasus<br />
Rhodeus sericeus amarus<br />
0<br />
0<br />
1,7<br />
1,7<br />
Sander volgense<br />
Abramis brama<br />
Aspius aspius<br />
Proterorhinus marmoratus<br />
0<br />
0<br />
0<br />
0<br />
0,6<br />
Barbus barbus<br />
Pseudorasbora parva<br />
Zingel zingel<br />
Abramis ballerus<br />
Scardinius erythrophthalmus<br />
Lepomis gibbosus<br />
Neogobius fluviatilis<br />
Silurus glanis<br />
Gymnocephalus baloni<br />
0<br />
0<br />
0<br />
0<br />
0<br />
0<br />
0<br />
0<br />
0<br />
0,2<br />
Esox lucius<br />
Cobitis taenia<br />
Perccottus glehni<br />
Zwergwels<br />
Cyprinus carpio<br />
Lota lota<br />
0<br />
0<br />
0<br />
0<br />
0<br />
0,4<br />
0,2<br />
ä tzeri Leucaspius delineatus<br />
Gymocephalus schr<br />
Barbus petenyi<br />
Gobio gobio<br />
Zwergwels<br />
Cyprinus carpio (domest.)<br />
0<br />
0<br />
0<br />
0,2<br />
Vimba vimba<br />
Sabanejewia aurata<br />
Misgurnus fossilis<br />
Hypo<br />
0<br />
0<br />
0<br />
90<br />
80<br />
70<br />
60<br />
50<br />
40<br />
30<br />
20<br />
10<br />
0<br />
73,9<br />
4,4<br />
6,4<br />
2,5<br />
0,5<br />
1,5<br />
Alburnus alburnus<br />
Leuciscus cephalus<br />
Leuciscus idus<br />
Abramis bjoerkna<br />
Alburnoides bipunctatus<br />
Abramis sapa<br />
Sander lucioperca<br />
Rutilus rutilus<br />
Gobio albipinnatus<br />
0<br />
0<br />
1<br />
2<br />
2,5<br />
0,5<br />
Perca fluviatilis<br />
Carassius gibelio<br />
Chondrostoma nasus<br />
Rhodeus sericeus amarus<br />
Tisa downstream Sajo mouth<br />
0<br />
0<br />
1,5<br />
0,5<br />
1<br />
Sander volgense<br />
Abramis brama<br />
Aspius aspius<br />
Proterorhinus marmoratus<br />
1,5<br />
Barbus barbus<br />
Pseudorasbora parva<br />
Zingel zingel<br />
Abramis ballerus<br />
Scardinius erythrophthalmus<br />
0<br />
0<br />
0<br />
0<br />
0,5<br />
Lepomis gibbosus<br />
Neogobius fluviatilis<br />
Silurus glanis<br />
Gymnocephalus baloni<br />
Esox lucius<br />
Cobitis taenia<br />
Perccottus glehni<br />
Zwergwels<br />
Cyprinus carpio<br />
Lota lota<br />
n = 203<br />
Gymocephalus schr<br />
Barbus petenyi<br />
Gobio gobio<br />
Zwergwels<br />
Cyprinus carpio (domest.)<br />
ä Leucaspius delineatus<br />
tzeri<br />
Sabanejewia aurata<br />
Misgurnus fossilis<br />
Hypo<br />
Vimba vimba<br />
0<br />
0<br />
0<br />
0<br />
0<br />
0<br />
0<br />
0<br />
0<br />
0<br />
0<br />
0<br />
0<br />
0<br />
0<br />
0<br />
0<br />
0<br />
0<br />
Figure 5.3 Species frequency (to be continued)<br />
96
90<br />
80<br />
70<br />
60<br />
50<br />
40<br />
30<br />
20<br />
10<br />
0<br />
41,4<br />
1,4<br />
4,5<br />
9,5<br />
Alburnus alburnus<br />
Leuciscus cephalus<br />
Leuciscus idus<br />
Abramis bjoerkna<br />
0<br />
Alburnoides bipunctatus<br />
1,8<br />
15,3<br />
0,9<br />
4,1<br />
Abramis sapa<br />
Sander lucioperca<br />
Rutilus rutilus<br />
Gobio albipinnatus<br />
0,5<br />
0,5<br />
Perca fluviatilis<br />
Carassius gibelio<br />
Chondrostoma nasus<br />
Rhodeus sericeus amarus<br />
0<br />
0<br />
7,7<br />
0,5<br />
0<br />
5,4<br />
Sander volgense<br />
Abramis brama<br />
Aspius aspius<br />
Proterorhinus marmoratus<br />
Tisa-Lake<br />
Barbus barbus<br />
Pseudorasbora parva<br />
Zingel zingel<br />
Abramis ballerus<br />
Scardinius erythrophthalmus<br />
0<br />
0<br />
0<br />
0<br />
1,4<br />
0,5<br />
1,4<br />
0,5<br />
0,9<br />
Lepomis gibbosus<br />
Neogobius fluviatilis<br />
Silurus glanis<br />
Gymnocephalus baloni<br />
0<br />
0<br />
0<br />
0,9<br />
0,5<br />
0<br />
Esox lucius<br />
Cobitis taenia<br />
Perccottus glehni<br />
Zwergwels<br />
Cyprinus carpio<br />
Lota lota<br />
0,5<br />
0<br />
0<br />
0<br />
0,5<br />
Gymocephalus schr<br />
Barbus petenyi<br />
Gobio gobio<br />
Zwergwels<br />
Cyprinus carpio (domest.)<br />
ä Leucaspius delineatus<br />
tzeri<br />
n = 222<br />
Sabanejewia aurata<br />
Misgurnus fossilis<br />
Hypo<br />
Vimba vimba<br />
0<br />
0<br />
0<br />
0<br />
0<br />
90<br />
80<br />
70<br />
60<br />
50<br />
40<br />
30<br />
20<br />
10<br />
0<br />
39,4<br />
0<br />
28,2<br />
6,3<br />
Alburnus alburnus<br />
Leuciscus cephalus<br />
Leuciscus idus<br />
Abramis bjoerkna<br />
0<br />
Alburnoides bipunctatus<br />
19,7<br />
0<br />
0,7<br />
Abramis sapa<br />
Sander lucioperca<br />
Rutilus rutilus<br />
Gobio albipinnatus<br />
0<br />
0<br />
0<br />
1,4<br />
Perca fluviatilis<br />
Carassius gibelio<br />
Chondrostoma nasus<br />
Rhodeus sericeus amarus<br />
0<br />
0<br />
3,5<br />
Sander volgense<br />
Abramis brama<br />
Aspius aspius<br />
Proterorhinus marmoratus<br />
Szolnok<br />
Barbus barbus<br />
Pseudorasbora parva<br />
Zingel zingel<br />
Abramis ballerus<br />
Scardinius erythrophthalmus<br />
Lepomis gibbosus<br />
Neogobius fluviatilis<br />
Silurus glanis<br />
Gymnocephalus baloni<br />
0<br />
0<br />
0<br />
0<br />
0<br />
0<br />
0<br />
0<br />
0<br />
0<br />
0<br />
0<br />
0<br />
0<br />
0<br />
0,7<br />
Esox lucius<br />
Cobitis taenia<br />
Perccottus glehni<br />
Zwergwels<br />
Cyprinus carpio<br />
Lota lota<br />
ä Leucaspius delineatus<br />
tzeri<br />
Gymocephalus schr<br />
Barbus petenyi<br />
Gobio gobio<br />
Zwergwels<br />
Cyprinus carpio (domest.)<br />
n = 142<br />
Sabanejewia aurata<br />
Misgurnus fossilis<br />
Hypo<br />
Vimba vimba<br />
0<br />
0<br />
0<br />
0<br />
0<br />
0<br />
0<br />
0<br />
0<br />
0<br />
0<br />
90<br />
80<br />
70<br />
60<br />
50<br />
40<br />
30<br />
20<br />
10<br />
0<br />
36,3<br />
1,2<br />
1,8<br />
14,9<br />
Alburnus alburnus<br />
Leuciscus cephalus<br />
Leuciscus idus<br />
Abramis bjoerkna<br />
0<br />
Alburnoides bipunctatus<br />
0,6<br />
0,6<br />
9,5<br />
0,6<br />
Abramis sapa<br />
Sander lucioperca<br />
Rutilus rutilus<br />
Gobio albipinnatus<br />
4,8<br />
7,1<br />
0<br />
0,6<br />
Perca fluviatilis<br />
Carassius gibelio<br />
Chondrostoma nasus<br />
Rhodeus sericeus amarus<br />
0<br />
3<br />
3,6<br />
Sander volgense<br />
Abramis brama<br />
Aspius aspius<br />
Proterorhinus marmoratus<br />
0<br />
0<br />
3<br />
Titel<br />
Barbus barbus<br />
Pseudorasbora parva<br />
Zingel zingel<br />
Abramis ballerus<br />
0,6<br />
4,8<br />
2,4<br />
1,2<br />
0,6<br />
Scardinius erythrophthalmus<br />
0<br />
0,6<br />
1,2<br />
Lepomis gibbosus<br />
Neogobius fluviatilis<br />
Silurus glanis<br />
Gymnocephalus baloni<br />
Esox lucius<br />
Cobitis taenia<br />
Perccottus glehni<br />
Zwergwels<br />
Cyprinus carpio<br />
Lota lota<br />
n =168<br />
Gymocephalus schr<br />
Barbus petenyi<br />
Gobio gobio<br />
Zwergwels<br />
Cyprinus carpio (domest.)<br />
ä Leucaspius delineatus<br />
tzeri<br />
Figure 5.3: Species frequency at different sampling sites<br />
0<br />
0<br />
0<br />
0<br />
0<br />
0<br />
0<br />
0<br />
0<br />
0<br />
0<br />
0<br />
0<br />
0,6<br />
0,6<br />
Sabanejewia aurata<br />
Misgurnus fossilis<br />
Hypo<br />
Vimba vimba<br />
97
Species<br />
Titel<br />
Table 5.3. River Tisa fish fauna<br />
Gergelyiugornya<br />
Sajo Szolnok Tivadar Tisa-Lake<br />
Tisa downstream<br />
Sajo mouth<br />
Abramis ballerus<br />
X<br />
Abramis bjoerkna X X X X X<br />
Abramis brama X X X X X<br />
Abramis sapa X X X X X<br />
Alburnoides bipunctatus X X X<br />
Alburnus alburnus X X X X X X X<br />
Aspius aspius X X X X<br />
Barbus barbus X X X X<br />
Barbus petenyi<br />
X<br />
Carassius gibelio X X X X X<br />
Chondrostoma nasus X X X X X<br />
Cobitis taenia X X<br />
Cyprinus carpio X X<br />
Cyprinus carpio (domest.)<br />
X<br />
Esox lucius<br />
X<br />
Gobio albipinnatus X X X X X<br />
Gobio gobio<br />
X<br />
Gymnocephalus baloni X X<br />
Gymocephalus schrätzeri X X<br />
Hypo<br />
X<br />
Lepomis gibbosus X X X X X<br />
Leucaspius delineatus<br />
X<br />
Leuciscus cephalus X X X X X X<br />
Leuciscus idus X X X X X<br />
Lota lota<br />
X<br />
Misgurnus fossilis<br />
Neogobius fluviatilis X X<br />
Perca fluviatilis X X X X<br />
Perccottus glehni<br />
Proterorhinus marmoratus X X<br />
Pseudorasbora parva X X X<br />
Rhodeus sericeus amarus X X X<br />
Rutilus rutilus X X X X<br />
Sabanejewia aurata<br />
X<br />
Sander lucioperca X X X<br />
Sander volgense<br />
X<br />
Scardinius erythrophthalmus X X<br />
Silurus glanis X X<br />
Vimba vimba<br />
X<br />
Zingel zingel X X<br />
Ictalurus nebulosus<br />
X<br />
Ictalurus melas<br />
Population structure of indicator species<br />
Bleak (Alburnus alburnus)<br />
Data on species frequency show clearly that bleak was the only species present at all<br />
sampling sites. Further abundance of bleak was sufficient to enable the removal of<br />
40 individuals / sampling site as required for a statistical analysis of the results.<br />
Relative frequency of bleak decreases downstream and varies between 79% at<br />
98
Gergelyiugornya and 36,3% of the total caught at Titel. The abundance of 2+<br />
individuals was low at Gergelyiugornya and at Tisa Lake. Significant numbers of 2<br />
year old bleak only were proved at Szolnok and downstream Sajo mouth. Further 3+<br />
individuals occurred at these sampling sites, exclusively (Figure 5.4).<br />
160<br />
Alburnus alburnus<br />
Tivadar<br />
140<br />
Alburnus alburnus<br />
Gergelyiugornya<br />
140<br />
120<br />
100<br />
80<br />
60<br />
40<br />
0+<br />
1+<br />
2+<br />
3+<br />
120<br />
100<br />
80<br />
60<br />
40<br />
0+<br />
1+<br />
2+<br />
3+<br />
20<br />
20<br />
0<br />
2 3 4 5 6 7 8 9 10 11 12 13 14 15 16<br />
0<br />
2 3 4 5 6 7 8 9 10 11 12 13 14 15 16<br />
25<br />
Alburnus alburnus<br />
Sajo<br />
50<br />
Alburnus alburnus<br />
Tisa downstream Sajo mouth<br />
20<br />
15<br />
10<br />
0+<br />
1+<br />
2+<br />
3+<br />
40<br />
30<br />
20<br />
0+<br />
1+<br />
2+<br />
5<br />
10<br />
0<br />
2 3 4 5 6 7 8 9 10 11 12 13 14 15 16<br />
0<br />
2 3 4 5 6 7 8 9 10 11 12 13 14 15 16<br />
20<br />
Alburnus alburnus<br />
Tisa-Lake<br />
20<br />
Alburnus alburnus<br />
Szolnok<br />
15<br />
10<br />
0+<br />
1+<br />
2+<br />
15<br />
10<br />
0+<br />
1+<br />
2+<br />
3+<br />
5<br />
3+<br />
5<br />
0<br />
2 3 4 5 6 7 8 9 10 11 12 13 14 15 16<br />
0<br />
2 3 4 5 6 7 8 9 10 11 12 13 14 15 16<br />
Figure 5.4: Age structure of bleak population at different sampling sites<br />
The comparison between bleak age distribution at Tivadar and Gergelyiugornya<br />
shows a higher degree of variance of body length of 0+ individuals. These results<br />
may indicate a prolonged spawning season at the area of Szamos river mouth.<br />
These data do not provide evidence that the chemical pollution in 2000 caused a<br />
significant reduction of the abundance of fish elder than one year in the area of River<br />
Szamos confluence.<br />
The reduction of bleak population at Tisa Lake (41,4%) comprises all age classes,<br />
whereas the low abundance of bleak (39%) at Szolnok sampling site is due to the<br />
significantly reduced number of individuals originating from the 2000 spawning<br />
season and a single cohort of 0+ individuals. Data on species diversity at Szolnok do<br />
not provide evidence for the presence of predators or of food competitors of Alburnus<br />
alburnus. These peculiarities of bleak population structure at Szolnok area might be<br />
99
indications of an anthropogenic impact on bleak reproductive success of 2 and 3 year<br />
old individuals in 2001 and a nearly complete elimination of 2000 offspring.<br />
In the area of discharges of the agrochemical plant downstream of Sajo mouth the<br />
predominance of individuals measuring 5 cm total length among the 0+ individuals<br />
may be a hint to growth inhibition or a shift of spawning season (Figure 5.4).<br />
Chub (Leuciscus cephalus)<br />
The second indicator species of the upper Tisa was Leuciscus cephalus. Bleak and<br />
chub differ regarding body growth and generation time and nutritional type. Therefor<br />
the effects of continuous as well as of accidental pollution on population structure of<br />
either species might be different.<br />
Abundance of 0+ year old individuals at Gergelyiugornya is significantly lower than in<br />
Tivadar. This might be a hint to an impairment of reproductive success in the year<br />
2001 of chub inhabiting the area of River Szamos confluence. Sexual maturation of<br />
female chub takes place in the 4+ individuals. Since no chub elder than 3 years were<br />
caught the question arises whether adults of this species don’t live in the areas under<br />
investigation (Figure 5.5).<br />
Ide (Leuciscus idus)<br />
It was intended to investigate Leuciscus idus as the second indicator species of the<br />
downstream sampling sites. Only at Szolnok abundance of this species was sufficient<br />
for statistical analysis. At Szolnok only individuals elder than two year were caught,<br />
although the shallow shore areas under investigation, e.g. at Tisa Lake, are thought<br />
to represent suitable spawning grounds (Figure 5.5).<br />
100
25<br />
Leuciscus cephalus<br />
Tivadar<br />
25<br />
Leuciscus cephalus<br />
Gergelyiugornya<br />
20<br />
20<br />
15<br />
15<br />
10<br />
10<br />
5<br />
5<br />
0<br />
3-4 5-6 7-8 9-10 11-12 13-14 15-16 17-18 19-20 21-22 23-24 25-26 27-28 29-30<br />
0<br />
3-4 5-6 7-8 9-10 11-12 13-14 15-16 17-18 19-20 21-22 23-24 25-26 27-28 29-30<br />
25<br />
Leuciscus idus<br />
Szolnok<br />
20<br />
15<br />
10<br />
5<br />
0<br />
7-9 10-12 13-15 16-18 19-21 22-24 25-27 28-30 31-33 34-36 37-39 40-42<br />
25<br />
20<br />
1+<br />
2+<br />
Leuciscus idus<br />
all sampling sites<br />
15<br />
3+<br />
4+<br />
10<br />
5<br />
5+<br />
6+<br />
0<br />
7-9 10-12 13-15 16-18 19-21 22-24 25-27 28-30 31-33 34-36 37-39 40-42<br />
Figure 5.5 Age structure of chub and ide at different sampling sites<br />
Parasitiziation<br />
The analysis of infection rates show that parasitic infection of fish was elevated in the<br />
area of Sajo mouth and selectively slightly increased in chub in the area of Samosz<br />
confluence (Figure 5.6). Apart from<br />
Infectionen/individual<br />
1,8<br />
1,6<br />
1,4<br />
1,2<br />
0,8 1<br />
0,6<br />
0,4<br />
0,2<br />
0<br />
Tivadar<br />
Gergelyiugornya<br />
Sajo<br />
Parasitiziation of indicator species<br />
Sajo plant<br />
Tisa Lake<br />
Szolnok<br />
Titel<br />
general infection rate<br />
infection rate bleak<br />
infection rate chub<br />
infection rate die<br />
fungal mycosis caused by<br />
Branchiomyces and Basidiobolus<br />
and protozoosis caused by ciliates<br />
occurring in the area of Sajo mouth,<br />
parasite spectra observed in course<br />
of the River Tisa survey did not differ<br />
significantly from parsitiziation of<br />
River Rhine fish.<br />
Figure 5.6a. Parasitiziation of<br />
indicatorspecies<br />
101
Protozoosis caused by ciliates of the genus Amiophrys, observed in the area of Sajo<br />
mouth, are due to the high affinity of this parasite to the dominant species Alburnus<br />
alburnus of River Tisa fish fauna. Sex<br />
Gender specific infection rate<br />
specifc sensitivity of male fish from Sajo<br />
River mouth represents an interesting<br />
1,6<br />
1,4<br />
1,2<br />
1,0<br />
0,8<br />
0,6<br />
males<br />
females<br />
parallel to parasitiziation pattern of River<br />
Rhine fish. Male roach (Rutilus rutilus)<br />
originating from a River Rhine harbour with<br />
a high degree of tributyltin sediment<br />
0,4<br />
0,2<br />
pollution, also showed a significantly<br />
0,0<br />
elevated abundance of gill parasites.<br />
Infection/individual<br />
Figure 5.6b Gender specific infection rate<br />
Investigation of sex ratios<br />
Sex ratio of bleak<br />
Tivadar<br />
Gergelyiugornya<br />
Sajo<br />
Sajo/plant<br />
Tisa Lake<br />
Szolnok<br />
Titel<br />
Sex ratio of bleak varied significantly between the upstream sampling site Tivadar<br />
and the area of Samosz River confluence (Gergelyiugornia). The “unpolluted”<br />
upstream site Tivadar showed a female surplus, whereas 20 km downstream a shift<br />
towards a statistically significant male surplus was observed. Apart from Tisa Lake all<br />
downstream sampling sites showed a more or less pronounced tendency to more<br />
male than female individuals.<br />
Sex ratio of bleak (Alburnus alburnus)<br />
Sex ratio of chop (Leuciscus cephalus)<br />
males<br />
100%<br />
80%<br />
60%<br />
40%<br />
20%<br />
0%<br />
Tivarda<br />
Gergelyiugornya<br />
Sa jo<br />
Sajo/Plant<br />
Tisz Lake<br />
Szolnok<br />
0%<br />
20%<br />
40%<br />
60%<br />
80%<br />
100%<br />
female<br />
m<br />
f<br />
conf max<br />
conf min<br />
males<br />
100%<br />
80%<br />
60%<br />
40%<br />
20%<br />
0%<br />
Tivarda<br />
Gergelyiugornya<br />
Sajo<br />
Sajo/Plant<br />
0%<br />
20%<br />
40%<br />
60%<br />
80%<br />
100%<br />
female<br />
m<br />
f<br />
conf max<br />
conf min<br />
Sex ratio of ide (Leuciscus idus)<br />
males<br />
100%<br />
80%<br />
60%<br />
40%<br />
20%<br />
0%<br />
0%<br />
20%<br />
40%<br />
60%<br />
80%<br />
100%<br />
females<br />
m<br />
f<br />
conf max<br />
conf min<br />
Tivarda<br />
Gergelyiugo...<br />
Sajo<br />
Sajo/Plant<br />
Tisza Lake<br />
Szolnok<br />
Figure 5.7. Sex ratio of indicator species<br />
numbers of chub and ide were not sufficient for statistical analysis at all sampling<br />
sites.<br />
102
Confidence intervals indicate the range of possible values of the real sex ratio of the<br />
population in comparison to the spot check at 95% level.<br />
Data on sex ratios of ide and chub did not provide evidence for a statistical significant<br />
deviation of 1:1 male : female sex distribution. The total number of 14 ide caught in<br />
the area of the Sajo mouth was not sufficient for a statistcal valid analysis of sex ratio<br />
(2 male and 12 female individuals, Figure 5.7).<br />
Vitellogenesis<br />
Vitellogenesis in female fish<br />
Data on number of vitellogenin producing female individuals obviously reflect the age<br />
structure of the population of the sampling sites. E.g. at the area of Sajo mouth<br />
mostly 2+ individuals were caught. Since vitellogensis in ide starts in 3+ individuals<br />
the low number of vitellogenin producing individuals primarily reflects the normal life<br />
cycle of this species. At the downstream sampling sites mostly sexual mature (4+,<br />
5+, 6+) female ide were caught. Also the high amount of vitellogenin producing<br />
female bleak at Szolnok confirms with the analysis of age structure, showing an<br />
extremely low abundance of immature fish (Figure 5.8).<br />
Vitellogenesis in females<br />
Figure 5.8. Vitellogenesis in<br />
females of indicator species<br />
Percentage of female vitellogenin<br />
producing individuals<br />
100%<br />
80%<br />
60%<br />
40%<br />
20%<br />
0%<br />
Tivarda<br />
Gergelyiugornya<br />
SAJO<br />
Sajo/Plant<br />
Tisz Lake<br />
Szolnok<br />
bleak f<br />
ide f<br />
chub f<br />
Vitellogenin identification in<br />
chub created problems since a<br />
protein showing only minor<br />
differences in comparison to<br />
vitellogenin, occurred in wide<br />
varying amounts in male as well<br />
as in female chub. Immunlogical<br />
vitellogenin identifcation of<br />
western blotted cyprinid serum<br />
protein provided evidence for the existence of two closely neighbouring but separate<br />
immuno-reactive bands. Since in chub the alterations of one of the two bands does<br />
not correspond neither to the gender nor to the state of reproduction, a crossreactivity<br />
to a protein with unknown function has to be assumed (Figure 5.9).<br />
Therefore vitellogenin identification in this species requires additional steps of protein<br />
separation. The low number of vitellogenin producing female chub does not reflect<br />
the observed lack of mature individuals. It seems that vitellogenesis in this species<br />
took place randomly and was not related to the age and thereby to the reproductive<br />
state. These results require a critical review of the method of vitellogenin<br />
identification in this species.<br />
103
0,7<br />
serum protein<br />
0,6<br />
0,5<br />
purified<br />
vitellogenin<br />
optical density<br />
0,4<br />
0,3<br />
Vitellogenin<br />
Cross reactive<br />
protein ?<br />
0,2<br />
0,1<br />
0<br />
2,0 2,4 2,8 3,3 3,7<br />
[cm]<br />
Figure 5.9. Densiogramm of serum proteins from female chub<br />
Insertion: Western blot showing immunoreactive proteins in carp serum detected<br />
by vitellogenin antiserum. Two distinct proteins were detected in female (KP)<br />
serum, no vitellogenin in male carp serum (KS) (MGM: molecular weight<br />
standard)<br />
Paradoxical induction of vitellogenesis in male fish<br />
Data on vitellogenin syntheses in chub show similar features in males and females.<br />
The elevated number of vitellogenin producing males might reflect a hint to pollution<br />
with endocrine disrupting compounds.<br />
Data on frequency of vitellogenin induction in male bleak and ide show a definite<br />
paradoxical induction of vitellogenin. downstream the agrochemical producing plant<br />
in the area of Sajo mouth abundance of vitellogenin producing males of the surface<br />
feeding species bleak was elevated while vitellogenesis of the benthivorous species<br />
ide was not affected. Downstream the city of Szolnok the more benthic species ide<br />
showed a clearly elevated number of vitellogenin producing males whereas the<br />
proportion of vitellogenin producing male bleak were only slightly elevated at this<br />
sampling site (Figure 5.10). The underlying basic mechanism of endocrine control of<br />
reproduction are comparable in all cyprinide teleosts. The habitat preference and the<br />
nutritional type of the species represent the decisive factor for the differential reaction<br />
of bleak and ide regarding paradoxical induction of vitellogenin. The consequence of<br />
these results is the assumption that a contamination of water and suspended organic<br />
matter with xenoestrogens may have caused the species specific reaction of bleak<br />
downstream of agrochemical plant and that a sediment born pollution caused<br />
vitellogenin induction in ide at Szolnok.<br />
104
Percentage of vitellogenin producing male<br />
individuals<br />
60%<br />
40%<br />
20%<br />
0%<br />
Tivarda<br />
Gergelyiugornya<br />
Vitellogenesis in males<br />
Sajo<br />
Sajo/Plant<br />
Tisz Lake<br />
Szolnok<br />
bleak m<br />
ide m<br />
chop m<br />
Figure 5.10. Induction of vitellogenin in males of indicator species.<br />
General discussion and conclusions<br />
The results of the investigation of River Tisa fish fauna showed, that the HLUG<br />
strategy of River Rhine monitoring is applicable to the Danubian system. The<br />
combination of faunal and ecotoxicological methods provides useful tools regarding<br />
the retrospective assessment of accidental as well as of continuous pollution of the<br />
riverine environment.<br />
The rapid resettlement in the course of the first year after the accidental pollution<br />
confirms with the data on the compensatory capacity of the riverine environment after<br />
the Sandoz-spill in 1986.<br />
River Rhine was contaminated by organic pollutants, therefore either accidents<br />
should only be compared regarding the compensation of lethal effects.<br />
Since River Tisa survey was the first investigation of an accidental polluted river<br />
using a monitoring strategy comprising both population ecology as well as<br />
reproductive physiology and –health, the final evaluation of the data requires a<br />
repetition of the survey at a later time. Basing on data obtained from a single<br />
sampling it is not possible to decide whether the lack of immature fish, e.g. at<br />
Szolnok, was due to selective toxicity of accidental supplied pollutants or whether<br />
fertility of ide is reduced significantly and the “population” mainly consists of migrating<br />
individuals originating from (unpolluted?) sites.<br />
Analysis of age structure of River Rhine cyprinids did not provide evidence for a<br />
complete elimination of distinct age classes of a single species. To our experience<br />
population structural features which are comparable to the Szolnok results are<br />
restricted to perch (Perca fluviatilis) population of lake habitats and thought to be<br />
related to temporary predatory pressure caused by pike-perch (Stizostedion<br />
lucioperca) and pike (Esox lucius).<br />
Downstream the agrochemical plant and at Szolnok paradoxical induction of<br />
vitellogenesis took place. These findings indicate a local pollution with endocrine<br />
disrupting chemicals. Therefore it can not be excluded, that effects on the population<br />
level are caused by either the accidental pollution and by local pollution. The higher<br />
105
compensatory capacity of the upstream sampling sites might be due to structural<br />
features of the river, e.g. the connection to neighboring unpolluted habitats provides<br />
a higher potential of resettlement.<br />
Findings of the comparative investigation of sex ratio and induction of vitellogenesis<br />
are in accordance with results of River Rhine monitoring. Both studies do not confirm<br />
the hypothesis that induction of vitellogenin indicates a feminisation of the individual<br />
and a shift of sex ratio to a higher portion of females finally resulting in the<br />
feminisation of the population.<br />
In view of the high water volume of River Tisa, the complete elimination of the fish<br />
fauna over a stretch of nearly 1000 m downstream the discharge of the agrochemical<br />
plant and the high amount of vitellogenin producing male bleak in the area 1000-<br />
1500 m downstream the discharge should trigger further investigations. In course of<br />
an ongoing Hessian monitoring studies comparable rates of vitellogenin induction<br />
occur in small creaks containing an extremely high amount (50-80%) of sewage<br />
treatment plant effluents or at harbour sites, where sediments are contaminated with<br />
endocrine disrupting chemicals (tinorganic compounds). A more detailed study<br />
especially of River Tisa downstream Sajo mouth seems to be useful to answer the<br />
general question whether the lower burden of endocrine disrupting chemicals<br />
accompanied by lower incidents of paradoxical induction of vitellogenesis in<br />
continental central European rivers compared to British or western European rivers is<br />
due to water quality management or to differences in hydrogeology (Purdom et al.<br />
1994, Sole et al. 2000). A screening of organic contaminants in order to investigate<br />
the distribution and the fate of the discharged organic contaminants in relation to the<br />
effects on fish fauna is advisable to asses the risk of an irreversible contamination of<br />
drinking water resources and nature protection reserve of the region.<br />
The investigation of Leuciscus idus population in the wild represented a unique<br />
opportunity to asses data of a comprehensive HLUG laboratory study with this<br />
species. The variety Leuciscus idus melanotus is used as a test fish in German water<br />
quality management to determine the lethal toxicity of sewage treatment plant<br />
effluents. The HLUG carried out a research project, which was addressed to modify<br />
the test procedure of the DIN 38412 L 31 in order to monitor lethal effects and<br />
reproductive toxicity simultaneously (Allner et al. 2000). Measurement of reproductive<br />
toxicity is based on vitellogenin determination in blood of golden ide after a 4-7days<br />
lasting exposure to diluted sewage treatment plant discharges. The data regarding<br />
population structure and paradoxical induction of vitellogenesis from Szolnok site<br />
confirm the results of HLUG laboratory experiments, indicating a high sensitivity of<br />
Leuciscus idus to endocrine disrupting compounds. Since the modified fish test using<br />
L. idus as a test species enables to determine the degree of lethal toxicity as well as<br />
the potential to cause chronic damages of fertility this test system might be a useful<br />
tool in water quality management of eastern Europe.<br />
106
6. Conclusions<br />
An international sampling expedition was carried out with the help of the HLUG<br />
(Wiesbaden, Germany) using the ARGUS ship, which had facilities for sample<br />
collection and laboratory analysis. The sampling program was carried out between<br />
28 September and 9 October 2001 from Titel (Republic of Yugoslavia) to Tiszabecs<br />
(Hungary-Ukraine), along the 744 river km river stretch.<br />
The concentrations of the most important inorganic nutrient substances were not<br />
found to be high in case of the Tisza River. There were only few tributaries where the<br />
extreme values were detected such as the Bega River (ammonium and nitrite<br />
nitrogen) and the Zagyva River (orthophosphate phosphorous) most probably due to<br />
permanent organic load. In case of orthophosphate phosphorous concentration the<br />
Sajó River had a little bit increased value due to the communal wastewaters of<br />
Miskolc city. Higher concentrations were found in the Zagyva River.<br />
In the Tisza River - due to the flooding situation - the concentration of chlorophyll-a<br />
generally was not high at all, especially in the Upper Tisza stretch. The maximum<br />
value was measured at the downstream end of the Kisköre Reservoir. However, the<br />
Zagyva River with the detected 73 µg/l chlorophyll-a concentration seems to be an<br />
outstanding water course in that respect, too. Generally it can be stated that the<br />
Tisza and its tributaries are not nutrient limiting water bodies.<br />
Interesting data were collected for the inorganic and organic micropollutants in water,<br />
suspended solids, sediment and mussel species. The mercury, cadmium, lead,<br />
chromium, copper, nickel, zinc, aluminum, iron, manganese and arsenic total<br />
concentrations showed characteristic longitudinal profile in water along the Tisza:<br />
moderately low values in the upper and middle section of the river and significant<br />
increased downstream of the Maros confluence. Only a minor part of the total metal<br />
content was in dissolved form. The dominant proportion of the metals was attached<br />
to suspended particles.<br />
The heavy metal concentrations in suspended solids, sediment and mussel tissues<br />
varied in a wide range. Data on Unio tumidus, U. pictorum and U. crassus are<br />
available as the results of the ITR program referring to the Tisza and its tributaries.<br />
Data indicate that several heavy metals (copper, nickel and mainly zinc) occured at<br />
increased concentrations in suspended solids and sediments . There was an<br />
interesting mixing up/remobilization phenomenon experienced during the ITR mission<br />
concerning the mercury. The largest portion of this element was detected in the<br />
suspended solid phase. Mercury was a characteristic pollutant of the Sajó River in<br />
the past. Although the pollution has been stopped, it is still present and available in<br />
certain sediment depositions. This pollutant can be remobilized by mixing up<br />
processes during flooding.<br />
In case of cadmium, relatively high values were measured in suspended solids,<br />
sediment and mainly in mussel species. Lead and copper generally exceed the limit<br />
values in the sediment compartment. The typical zinc concentrations in the Tisza are<br />
two times higher than the limit. Zinc was found in the mussel tissues in a<br />
considerable amount. It is clear from the diagram that larger concentrations were<br />
107
detected in the lower Tisza (Yugoslavia) and in the Kisköre Reservoir. Maximum<br />
values were near to 2000 mg/kg dry weight, indicating that this compound causes<br />
serious pollution problem in the whole region.<br />
Organic micropollutants were surveyed in water, sediment and mussels. Polar<br />
pesticides - atrazine, simazine, propazine and endosulfan were analysed in water to<br />
estimate the effect of agricultural pesticide application. From these four pesticides<br />
atrazine, simazine and propazine were found above detection level (>1 ng/l) in<br />
moderate concentrations. Remarkable (but below target value) atrazine<br />
concentrations were found in the Maros River and in the Tisza downstream of the<br />
Maros, presumably owing to the intensive surface runoff from arable land in the<br />
Maros river basin.<br />
Selected organochlorine compounds (lindane, pp’-DDT, hexachlorobenzene,<br />
hexachlorobutadiene, pentachlorobenzene), polychlorinated biphenyls (PCBs) and<br />
polyaromatic hydrocarbons (PAHs) were analyzed in suspended solids, sediment<br />
and mussels because these pollutants tend to be accumulated in solid phase. The<br />
mean concentration levels of the above mentioned pollutants were similar in the<br />
Danube and in the Tisza during the JDS and ITR surveys. These pollutants had<br />
moderate mean concentrations in the suspended solids, sediment and mussels in<br />
both rivers. Some PCB-28 values in sediment and suspended solids exceeded target<br />
value in the tributaries Sajó and Bodrog and in the Tisa River at Tiszabercel.<br />
The results of the algological investigations show that phytoplankton species<br />
diversity, abundancy and chlorophyll-a were relatively low from station Titel (the<br />
confluence of the Tisza River to the Danube) along the whole Tisza River. The<br />
reason of that was the flooding situation and high water level. Generally, the diatoms<br />
(Bacillariophyceae), green algae (Chlorococcales) and Euglenophyceae were the<br />
most dominating taxa in the whole investigated stretch of the Tisza and as well as in<br />
its tributaries. Green coccal and flagelate algae created second abundant group from<br />
Titel to the confluence of Bodrog. In the upper part of the Tisza (from Sajó<br />
confluence) numbers of cells of Chrysophyceae increased.<br />
Summarizing the results of the zooplankton investigation series conducted in<br />
September - early October it is concluded in general that only 55 Rotatoria and<br />
Crustacea species lived in the Tisza and at the confluence points of its tributaries – in<br />
lower than usual values. Dominant species were however identical to previously<br />
observed ones. Occurrence of rare species became even more seldom compared to<br />
the results of previous investigations.<br />
Individual abundance values of the animals are usually lower by one-two magnitude<br />
of orders than in previous years during the same season (late summer – early fall).<br />
No increase in individual numbers was observed due to impoundment and on<br />
downstream sections. One possible reason for this is the narrow food resources for<br />
the filter feeder zooplankton species as it is evidenced by the measured low<br />
chlorophyll a concentration values.<br />
Summarizing the results of the macrofauna it can be demonstrated, that beside of the<br />
late autumn season, numerous characteristic macroinvertebrate groups were<br />
collected on the investigated Tisza stretch. Based on the faunal data it can be seen<br />
108
clearly that no evidence of cyanide or heavy metal pollution is detectable on the<br />
Tisza River. All of the most important taxonomic groups are present in relatively large<br />
taxon numbers along the whole river stretch. All of those taxonomic groups that were<br />
affected immediately after the cyanide pollution (Crustaceans, Ephemeropterans,<br />
Trichopterans and Dipterans) were recovered and repopulated the sections both in<br />
terms of taxa and earlier abundance. Crustaceans were especially damaged<br />
immediately after the spill. Nowadays all of the taxa repopulated the affected Tisza<br />
and Szamos stretches well.<br />
Multivariate analysis of macroinvertebrate data indicates that there are two main<br />
stretches on the investigated 744 km long Tisza River. The sampling sites on the<br />
Lower and Middle Tisza form one main group including the lower 14 sampling sites<br />
on the Yugoslavian-Hungarian stretch. The Upper Hungarian Tisza differs very much<br />
from the other section in the macroinvertebrate community. There was an<br />
intermediate section between the Upper and the Middle Tisza stretch having a<br />
transitional invertebrate fauna.<br />
The overall conclusion of the JDS ITR sampling mission is that no detectable effects<br />
of the cyanide pollution were observed in the water, suspended solids, sediment and<br />
the biota. All of those taxonomic groups of aquatic macroinvetrebtares that were<br />
affected badly immediately after the cyanide spill had recovered successfully<br />
according to the findings of the ITR sampling program. However, the level of some<br />
inorganic and organic mictropollutants was significant in certain investigated<br />
compartments. All of the data obtained during the sampling program will be valuable<br />
and useful for the future comparison either within the Tisza River system or<br />
elsewhere in the Danube River Basin.<br />
Concerning the results of the fish study it can be concluded that a more detailed<br />
study especially of River Tisa downstream Sajo mouth seems to be useful to answer<br />
the general question whether the lower burden of endocrine disrupting chemicals<br />
accompanied by lower incidents of paradoxical induction of vitellogenesis in<br />
continental central European rivers is due to water quality management or to<br />
differences in hydrogeology. The data regarding population structure and paradoxical<br />
induction of vitellogenesis from Szolnok site confirm the results of HLUG laboratory<br />
experiments, indicating a high sensitivity of Leuciscus idus to endocrine disrupting<br />
compounds. Since the modified fish test using L. idus as a test species enables to<br />
determine the degree of lethal toxicity as well as the potential to cause chronic<br />
damages of fertility this test system might be a useful tool in water quality<br />
management of eastern Europe.<br />
109
List of participating institutions and persons during the ITR mission<br />
Water Resources Research Center Plc. (VITUKI Rt.), Budapest, Hungary:<br />
Dr. Béla Csányi team leader, biologist<br />
Péter Juhász biologist<br />
Viktória Kavrán biologist<br />
Pál Kaszonyi chemical technician<br />
Hessenische Landesamt für Umwelt und Geologie, Wiesbaden, Germany:<br />
Manfred Wenner captain of ARGUS<br />
Mike Pritsdow sailor of ARGUS<br />
Dr. Petra Stahlschmidt-Alner team leader, biologist<br />
Bernhard Alner biologist<br />
Egbert Korte biologist<br />
Nadia Nikutowsky biologist<br />
Annette Schaat biologist<br />
Silke Dehe biologist<br />
Andre Beltz biologist<br />
Hydrometeorological Institute, Belgrade, Federal Republic of Yugoslavia:<br />
Dragan Trpkovic Yugoslavian co-ordinator<br />
Momir Paunovic Biologist<br />
Jovanka Ignjatovic Chemist<br />
Momcilo Zivkovic Director<br />
Mihajlo Gavric Assistant director of Hydrology<br />
National Research and Development Institute for Environment, ICIM, Bucharest,<br />
Romania:<br />
Carmen Hamchevichi chemist<br />
VUVH, Bratislava, Slovakia:<br />
Dr. Jarmila Makovinská biologist<br />
110
References<br />
ÁDÁMOSI M., BANCSI I., HAMAR J., KATONA S., B. TÓTH M., VÉGVÁRI P. (1974):<br />
Duzzasztás hatása a Tisza vízminőségére a Kiskörei vízlépcső térségében.<br />
Hidrol. Közl. 54, 570-576.<br />
ÁDÁMOSI, M., VÉGVÁRI, P., BANCSI, I., HAMAR, J., B.TÓTH, M., FERENCZI, M.,<br />
SZÍTÓ, A. (1978): Limnological investigations in the longitudinal section of the<br />
river Tisza. TISCIA XIII.: 99-140.<br />
ALLNER, B. WEGENER, G., KNACKER, T., STAHLSCHMID-ALLNER, P.; (1999)<br />
Electrophoretic determination of estrogen-induced protein in fish exposed to<br />
synthetic and naturally ocurring chemicals. Sci. Tot. Environ. 233, 21-31<br />
ALLNER B., THEIMER S., SCHAAT A., STAHLSCHMIDT-ALLNER P. (2000)<br />
Entwicklung eines Fischtests zur Erfassung von Stoffen mit endokrinen<br />
Wirkungen in Oberflächengewässern, Teil 3: Der neue Fischtest in der<br />
Gewässerüberwachung durch eine Landesbehörde. Abschlussbericht, BMBF<br />
Förderkennzeichen 02WU9665/6<br />
AMBRUS A., BÁNKUTI K., CSÁNYI B., JUHÁSZ P., KOVÁCS T. (1995a): Újabb<br />
adatok az Aphelocheirus aestivalis Fabricius, 1794 (Heteroptera, Naucoridae)<br />
magyarországi elterjedéséhez.<br />
Folia ent. hung. 56: 223-227.<br />
AMBRUS A., BÁNKUTI K., KOVÁCS T. (1995b): A Bereg-Szatmári-sík Odonata<br />
faunája. (The Odonata fauna of the Bereg-Szatmári-sík.)<br />
Fol. Hist.-nat. Mus. Matr. 20: 63-83.<br />
AMBRUS, A., BÁNKUTI, K., CSÁNYI, B., JUHÁSZ, P., KOVÁCS, T. (1998): Larval<br />
data to the Odonata fauna of Hungary.<br />
Odonata - stadium larvale 2: 41-52.<br />
ANDRIKOVICS, S. (1988): A Közép-Tisza Ephemeroptera faunájáról, két, a<br />
magyar faunára új Caenida-fajjal.<br />
Folia Ent. Hung. 49: 225-229.<br />
ASKEW, R. R., (1988): The dragonflies of Europe. - Harley Books, Colchester:<br />
291 pp.<br />
BANCSI, I. (1974): Rotatorien fauna des Bodrog-Totarms. - In: Dévai Gy.et al.1974:<br />
Angaben zur Kenntnis der hirobiologischen Verhaltnisse des toten Flussarmes der<br />
Bodrog bei Sárospatak III. Flora und Fauna.- Acta Biol.Debrecen 10-11. (1972-<br />
73), 122-123.<br />
BANCSI, I. (1976a): Zooplankton investigations in the dammed River Tisza reaches.<br />
- Tiscia 11: 119-124.<br />
BANCSI, I. (1976b): Results of the zooplankton investigation of the bay at<br />
Abádszalók. - Tiscia 11: 93-98.<br />
BANCSI, I. (szerk.) (1977): Adatok a Tisza környezettani ismeretéhez, különös<br />
tekintettel a Kiskörei-Vízlépcsõ térségére.- KÖTIVIZIG Kiskörei Laboratóriuma.<br />
Kisköre VIZDOK. Budapest.<br />
BANCSI, I. (1980): The Rotatoria fauna of the flood-plain of the Bodrog at Sárospatak.-<br />
TISCIA 15, 61-92.<br />
BANCSI, I. (1986): A kerekesférgek ROTATORIA kishatározója I. Vízügyi<br />
Hidrobiológia. 15.– VÍZDOK. Budapest. 1-171.<br />
BANCSI, I. (1988): A kerekesférgek ROTATORIA kishatározója II. Vízügyi<br />
Hidrobiológia. 17.– VÍZDOK. Budapest. 1-577.<br />
BANCSI, I., HAMAR, J. (1981): Data on the Rotaria and Zooflagellata fauna of the<br />
sediment in the Tisza and its tributeries - Tiscia (Szeged) 16, 155-159.<br />
111
BANCSI, I., VÉGVÁRI, P (1990): A Kiskörei tározó vizminõsége. Biotechnológia és<br />
környezetvédelem ma és holnap IV., 4.: 14-16.<br />
BAUERNFEIND, E. (1994a) : Bestimmungsschlüssel für die Österreichischen<br />
Eintagsfliegen (Insecta: Ephemeroptera), 1. Teil.<br />
Wasser und Abwasser, Suppl. 4/94: 5-92.<br />
BAUERNFEIND, E. (1994b) : Bestimmungsschlüssel für die Österreichischen<br />
Eintagsfliegen (Insecta: Ephemeroptera), 2. Teil.<br />
Wasser und Abwasser, Suppl. 4/94: 5-90.<br />
BÁBA, K. 1967: Adatok a vízi csigák megoszlását megszabó tényezőkhöz. Szegedi<br />
Tanárképző Főiskola Tud. Közl., Szeged, 3-12.<br />
BÁBA K. (1974) Mollusca communites in the Tisza bed in the region of Szeged.<br />
Tiscia (Szeged) 9.<br />
BÁBA K. (1978) The Mollusca fauna of the Tisza, its research situation and tasks.<br />
Tiscia (Szeged) 13: 197.<br />
BERETZK, P., CSONGOR, GY., HORVÁTH, A., KÁRPÁTI, Á., KOLOSVÁRY, G.,<br />
MARIÁN, M., SZABADOS, M., FERENCZ, M. SZ., VÁSÁRHELYI, I. AND<br />
ZICSI, A. (1958): Das Leben der Tisza VII. Die Tierwelt der Tisza auf Grund<br />
neuerer Sammlungen und Beobachtungen.<br />
Acta Biol.(Szeged) 4.<br />
CARAUSU S., DOBREANU E., MANOLACHE C. (1955): Crustacea Amphipoda,<br />
forme salmastre si de apa dulce. Fauna RP Romina, 4 (4): 1-407, Bucuresti.<br />
CSÁNYI B. (1998) A magyarországi folyók biológiai minősítése a makrozoobenton<br />
alapján. Doktori (PhD) értekezés. Debrecen, 1998.<br />
CSÁNYI , B., JUHÁSZ, P., HASKO, N. (1996): A vízi makroszkópikus gerinctelen fauna<br />
a HNP víztereiben - Ohattól Meggyesig - Budapest, : 144-164.<br />
CSOKNYA, M., FERENCZ, M. (1972): A study of Palingenia longicauda Oliv. in<br />
the zoobenthos of the Tisza and Maros (Ephemeroptera).<br />
Tiscia 7: 47-57.<br />
CSOKNYA M., HALASY K. (1974) Data on the distibution of mayfly larvae<br />
(Ephemeroptera). Tiscia (Szeged) 9.<br />
CZÓGLER K. (1927) A Szegedvidéki kagylók. Faunabiológiai tanulmány. Szeged. 1927.<br />
CZÓGLER K. (1935) Adatok a Szegedvidéki vizek puhatestű faunájához. Szeged.<br />
1935.<br />
DADAY, J. (1888): A magyarországi Cladocerák magánrajza.-MK Term. Tud. Társ.<br />
Budapest 1-28.<br />
DADAY, J. (1891): Adatok Magyarország édesvízi mikroszkópos faunájának<br />
ismeretéhez. Termr. Füz.14. 16-31.<br />
De SMET W. H R. POURRIOT (1997): Rotifera. Volume 5. The Dicranophoridae<br />
(Monogonata). The Ituridae (Monogonata) –SPB Academic Publishing bv. 1-<br />
344.<br />
DÉVAI, I. (1977): Az evezőlábu rákok (Calanoida, Cyclopoida) kishatározója. Vízügyi<br />
Hidrobiológia 5., 1-221. VIZDOK, Budapest.<br />
DUSSART B. H. (1967): Les Copépodes eaux continentales d Europe occidentale. I.<br />
Calanoides et Harpacticoides.- N. Baubee and Cie. Paris. 1-500.<br />
DUSSART B. H. (1969): Les Copépodes eaux continentales d Europe occidentale. II.<br />
Cyclopoides et biologie.- N. Baubee and Cie. Paris. 1-292.<br />
EINSLE U. 1993: Crustacea Copepoda Calanoida und Cyclopoida. –Gustav Fischer<br />
Verlag. Stuttgart., Jena. New York. 1-208.<br />
ÉBER, Z. (1955): A Kárpát-medence folyóinak planktonja.- Hidr. Közl. 35:56-72.<br />
112
FERENCZ M. (1968) Vorstudium über die vertikale verteilung des zoobenthos der<br />
Teiss. Tiscia (Szeged) 4: 53-58.<br />
FERENCZ M. (1969) Occurrence of Hypania invalida (GRUBE) in the Tisza<br />
(Annelida, Polychaeta). Tiscia (Szeged) 5: 69-71.<br />
FERENCZ M. (1974 a) Data on the horizontal and vertical distributions of the<br />
zoobenthos of the Tisza. Tiscia (Szeged) 9: 65-69.<br />
FERENCZ M. (1974 b) Zoobenthic studies on the lower reach of the Tisza and<br />
Maros. Acta Biol. Szeged 20: 143-155.<br />
FERENCZ M. (1981) Studies on the zoobenthos in the longitudinal section of the<br />
Tisza: Oligochaeta, Polychaeta fauna (A Tisza hossz-szelvény zoobentosz<br />
vizsgálata: Oligochaeta, Polychaeta fauna). Tiscia (Szeged) 16: 161-168.<br />
FERENCZ M., SZITÓ A. (1980) Zoobenthos investigation in the longitudinal section<br />
of the Tisza. Tiscia (Szeged) 15: 142.<br />
FLÖSSNER, D. 1972: Krebstiere, Crustacea. Die Tierwelt Deutschlands.- VEB G.<br />
Fischer Verl. Jena. 60: 81-408.<br />
GÁL, D. (1963): Das leben der Tisza XX. Die Zusammensetzung der Mikrofauna das<br />
Wassers der Tisza bei Szolnok. - Acta Biol. Szeged IX/1. 4:69-73.<br />
GULYÁS, P. (1974): Az ágascsápu rákok (Cladocera) kishatározója. Vízügyi<br />
Hidrobiológia 2., 1-248. VIZDOK, Budapest.<br />
GULYÁS P., I. BANCSI & K. V. ZSUGA (1995): Rotatoria and Crustacea fauna of the<br />
Hungarian wateresources. Miscell. Zool. Hung. Budapest. Vol. 10. 21-47.<br />
GULYÁS P. & FORRÓ L. (1999): Az ágascsápú rákok (Cladocera) kishatározója. 2.<br />
(bővített) kiadás.- Budapest, KGI. 1-237.<br />
GULYÁS P. & FORRÓ L. (2001): Az evezőlábú rákok (Calanoida és Cylopoida)<br />
alrendjeinek kishatározója. 2. bővített kiadás.- KGI. Vízi Természet és<br />
Környezetvédelem. 14. 1-198.<br />
HENNIES, M., WIESMANN, M., ALLNER, B., SAUERWEIN, H. Vitellogenin in carp<br />
(Cyprinus carpio) and perch (Perca fluviatilis): Purification, characterization and<br />
development of an ELISA for the detection of estrogenic compounds. in<br />
preparation to be submitted to Biomarkers<br />
HORVÁTH A. (1940) A Szegedvidéki kagylók formaváltozásai és jelentőségük.<br />
Doktori értekezés. Szeged 1940.<br />
HORVÁTH A. (1943) Adatok a Tisza folyó puhatestű faunájának ismeretéhez. Acta<br />
Zool. Szeged 2.<br />
HORVÁTH A. (1955) Die Molluskenfauna der Theiss. Acta Biol. Szeged 1: 174-178.<br />
HORVÁTH A. (1957) Über die Molluskenfauna der Strecke zwischen Tiszabecs und<br />
Tiszafüred. Acta Biol. Szeged 3: 94-97.<br />
HORVÁTH A., (1958) Die Malacologischen Ergebnisse der II. Tisza-expedition. Acta<br />
Biol. Szeged 4: 216-218.<br />
HORVÁTH A. (1962) Kurzbericht über die Molluskenfauna der zwei Tisza<br />
expeditionen im Jahre 1958. Opusc. Zool. Budapest 4: 77-83.<br />
HORVÁTH A. (1965) About the Mollusks of Tisza before the River control. Tiscia<br />
(Szeged) 2: 99-102.<br />
HORVÁTH, A. (1972): Aquatic Mollusca fauna of the flood area and dead arms of the<br />
Tisza. Tiscia (Szeged) 7, 37-46.<br />
JUHÁSZ P., TURCSÁNYI I., KOVÁCS T., OLAJOS P., TURCSÁNYI B., KISS B. (1998):<br />
Vízi makroszkópikus gerinctelen élőlény-együttesek vizsgálata a Felső-Tiszán.<br />
Hidrológiai Közlöny 5-6 sz: 346-347.<br />
113
JUHÁSZ, P., BANCSI, I., VÉGVÁRI, P., KISS B. (1999): A Boroszló-kerti-Holt-Tisza<br />
ökológiai vízminõsége a zoobentosz biomasszája alapján.-Acta biol. debrecina,<br />
Suppl. oecol. hung. 10/2 ( in print)<br />
JUHÁSZ, P., KOVÁCS, T., AND AMBRUS, A. (2000): Leech collection of the Mátra<br />
Museum (Hirudinea). - Miscnea zool. hung. 13: 37-45.<br />
KOSTE W. (1978): Rotatoria. Die Rädertiere Mitteleuropas. 2. Auflage. I-II.-<br />
Gebrüder Borntraeger Berlin. Stuttgart. 1-673., 1-234.<br />
KOVÁCS T., AMBRUS A., BÁNKÚTI K., JUHÁSZ P. (1998): New Hungarian mayfly<br />
(Ephemeroptera) species arising from collegtings of larvae. - Miscnea. zool.<br />
Hung. 12: 55-60.<br />
KOVÁCS, T., AMBRUS, A., BÁNKUTI, K. AND JUHÁSZ, P. (2000): New Hungarian<br />
mayfly (Ephemeroptera) species arising from collectings of larvae II. - Miscnea<br />
zool. hung. 13: 81-83.<br />
KUTIKOVA L. A. (1970): Kolovratki FAUNÜ SzSzSzR. -Izd. NAUKA Leningradszkoe<br />
Otdelenie. 1- 744.<br />
LANTOS, G. (1986): Data to the Amphipoda- and Isopoda fauna of Tőserdő and its<br />
environs in the Tisza Valley. I. Amphipoda, Asellota (Crustacea, Peracarida). -<br />
Tiscia (Szeged) 21, 81-87.<br />
MANUJLOVA, E. F. (1964): Vetvisztouszüe racski (Cladocera) faunü SzSzSzR.- Izd.<br />
Nauka Moszkva -Leningrad 88: 1-326.<br />
MEGYERI, J. (1955): Planktonvizsgálatok a Tisza szegedi szakaszán.- Hidrol. Közl.<br />
35.280-292.<br />
MEGYERI, J. (1957): Planktonvizsgálatok a Felsõ-Tiszán.- Szegedi Ped. Fõisk. Évk.<br />
67-84.<br />
MEGYERI, J. (1959): Comparative plankton investigations in the River Tisza.- Acta<br />
Biol. Acad. Sci Hung. Suppl. 3:21.<br />
MEGYERI, J. (1961): Összehasonlító hidrofaunisztikai vizsgálatok a Tisza holtágain.-<br />
Szegedi Ped. Fõisk. Évk. 121-133.<br />
MEGYERI, J. (1970): A Tisza mezozooplanktonja. I.Rotatoria. - Szegedi Tanárképző<br />
Főiskola Tudományos Közleményei. 115-130.<br />
MEGYERI, J. (1971): A Tisza mesozooplanktonja. II. Entomostraca.- Szegedi<br />
Tanárképzõ Főisk. Tud. Közl. 10 : 99-110.<br />
MEGYERI, J. (1972): Zooplankton vizsgálatok a Tisza mellékfolyóin. - Acta Acad.<br />
Paed. Szeged. 1972/II: 63-73.<br />
NESEMANN H., CSÁNYI B. (1993) On the leech fauna (Hirudinea) of the Tisza river<br />
basin in Hungary with notes on the faunal history.<br />
Lauterbornia 14, 41-70.<br />
NEUBERT E., NESEMANN H. (1999): Annelida, Clitellata: Branchiobdellida,<br />
Acanthobdellea, Hirudinea. Süsswasserfauna von Mitteleuropa Band 6/2.<br />
Spektrum Akademischer Verlag, Heidelberg, Berlin, 1-178.<br />
NOGRADY, T. (edit.) (1993): Rotifera. –SPB Academic Publishing bv. 1-142.<br />
OERTEL N. (2000) Translocation of zebra mussel (Dreissena polymorpha Pallas) as<br />
a tool to monitor heavy metals in the River Danube.<br />
Verh. Internat. Verein. Limnol. 27, pp. 2729-2799.<br />
PITCH T. (1993) Zur Larvaltaxonomie, Faunistik und Ökologie mitteleuropäischer<br />
Flieswasser-Köchelfliegen (Insecta: Trichoptera). Technische Universität Berlin, 1-<br />
319.<br />
114
PURDOM, C.E., HARDIMAN, P.A., BYE, V.J., ENO, N.C., TYLER, C.R., SUMPTER,<br />
J.P., (1994) Estrogenic effects of effluents from sewage treatment works.<br />
Chem. Ecol., 8 275-285<br />
PUJIN, V. (1988): Developments in the composition of biocenosis in the lower Tisa<br />
river (Yugoslavia) caused by hydrobiological changes.<br />
Tiscia (Szeged) 23, 43-49.<br />
PUJIN V., DJUKIC N., MALETIN S., MILJANOVIC B., IVANC A. (1986) Changes of<br />
zoocoenotic structure in Lower reach of river Tisza.<br />
Tiscia (Szeged) 30: 35-38.<br />
PUJIN V., RATAJAC R., DJUKIC N. (1984) Zusammensetzung und Dynamik des<br />
Zooplanktons und der Bodenfauna des Unteren Theisslaufs.<br />
Tiscia (Szeged) 19, 79-87.<br />
PUJIN, V., RATAJAC, R., DJUKIC, N. SVIRCEV, Z. UND KILIBARDA, P. (1987):<br />
Saisonmässige Variationen der Zusammensetzung des Planktons und der<br />
Bodenbesiedlung in der Carska Bara (Jugoslavien).<br />
Tiscia (Szeged) 22, 83-91.<br />
RICHNOVSZKY A., PINTÉR L. (1979) A vízicsigák és kagylók (Mollusca) kishatározója<br />
(Taxonomic keys of aquatic snails and mussels, in Hungarian).<br />
Vízügy Hidrobiológia 6, VIZDOK, Budapest, 1-206.<br />
ROTARIDES M. (1926) Adatok az Alföld puhatestű faunájának ökológiájához.<br />
Állatt. Közl. 1926.<br />
ROTARIDES M. (1927a) Szeged és közvetlen környékének Mollusca (puhatestű)<br />
faunájáról.<br />
Acta Litt. Sci. R. Univ. Hung. Franz. Jos. Szeged. Sectio Sci. Nat. 1927.<br />
ROTARIDESZ, M. (1927b): Über die Molluskenfauna von Szeged und näherer<br />
Umgebung. Acta Univ. Szeged 2, 177-213.<br />
SOLE, M.; LOPEZ DE ALDA, M.J.; CASTILLO, M.; PORTE, C.; LADEGAARD-<br />
PEDERSEN, K.; BARCELO, D. (2000) Estrogenicity Determination in Sewage<br />
Treatment Plants and Surface Waters from the Catalonian Area (NE Spain).<br />
Environ. Sci. Technol., 34(24), 5076-5083<br />
SEGERS H. (1995): Rotifera. Volume 2. The Lecanidae (Monogonata).–SPB<br />
Academic Publishing bv. 1-226.<br />
STAHLSCHMIDT-ALLNER, P., ALLNER, B., RÖMBKE, J., KNACKER, T. (1997)<br />
Endocrine disruptors in the aquatic environment. ESPR Environ. Sci. & Pollut.<br />
Res. 4: 155-162.<br />
SZITÓ A. (1973) Data on the Chironomus fauna of the flood area of the Tisza at<br />
SZÍTÓ A., ZSUGA K., BANCSI I., KOVÁCS P., VÉGVÁRI P. (1997): A hínár- és<br />
mocsári vegetáció haltáplálék-készletének vizsgálata a Kiskörei-tározóban.<br />
Halászat, 90(1), 34-42.<br />
SZITÓ A. (1978) Benthos investigation in the Tisza stretch between Tiszafüred-<br />
Kisköre. Tiscia (Szeged) 13: 97-98.<br />
SZÍTÓ, A. (1979) Midge species (Chironomidae) of the Kisköre Reservoir in the year<br />
of filling up. - Tiscia (Szeged) 14, 234-235.<br />
SZITÓ A. (1987) The sediment-fauna of the river Tisza and its tributaries based on<br />
the longitudinal-segment studies of 1986. Tiscia (Szeged) 21: 134.<br />
SZÍTÓ, A. (1995) A Szamos folyórendszer, mint élőhely. Minősítése az Oligochaeta és<br />
Chironomida fauna alapján. - XXXVII. Hidrobiológus Napok, Tihany, Biomonitorozás<br />
- Biodiverzitás: 75-78.<br />
SZÍTÓ, A. (1996) A Tisza üledéklakó életközösségének változása az első adatoktól<br />
napjainkig - Hidrológiai Közlöny, 1: 19-37.<br />
115
SZITÓ A., BOTOS M. (1989) Makrozoobenthos in the river Tisza and its influents.<br />
Tiscia (Szeged) 23: 65-75.<br />
SZÍTÓ, A., BOTOS, M. (1993) Macrozoobenthos in the shallow Hungarian Kisköre<br />
Reservoir on the River Tisza. - Verh. Internat. Limnol. 25: 1196-1199.<br />
SZÍTÓ, A., BOTOS, M. (1994): Makrozoobentosz a Kiskörei Tározóban. -Hidrológiai<br />
Közlöny 74, 6:367-374<br />
TÓTH, S. (1966a): Ein Beitrag zur Libellen-Fauna des Tisza-Tales. - Tiscia (Szeged)<br />
2, 103-106.<br />
TÓTH, S. (1966b): Neue Angaben zur Dipteren Fauna des Theiss-Tales. - Tiscia<br />
(Szeged) 2, 107-112.<br />
TÓTH, S. (1967): Adatok a Tisza-völgy Diptera faunájához (Tabanidea, Stratiomidea,<br />
Rhagionidea). - Rovartani Közl. 20, 4, 37-45.<br />
TÓTH, S. (1969): Data to the Trypetidae fauna of the Tisza-Valley (Diptera). - Tiscia<br />
(Szeged) 5: 97-105.<br />
TÓTH, S. (1972): Az oszlári Holt-Tisza élővilágáról. - Herman O. Múzeum Évk. 11,<br />
631-670.<br />
TÓTH, S. (1974): Odonata fauna of the area of the second series of locks on the<br />
Tisza. - Tiscia (Szeged) 9, 87-97.<br />
TÓTH B. M., BÁBA K. (1980) The Mollusca fauna in the bed of the Tisza and its<br />
tributaries. Tiscia (Szeged) 15: 143.<br />
TÓTH B. M., BÁBA K. (1981) The Mollusca fanuna of the Tisza and its tributaries (A<br />
Tisza és mellékfolyói puhatestű faunája).Tiscia (Szeged) 16: 169-181.<br />
VARGA A., CSÁNYI B. (1997) Vízicsiga fajok elterjedése magyarországi folyókban<br />
az elmúlt évtized vizsgálatai alapján I (Distribution of aquatic snails in Hungary<br />
based on data of the last decade, in Hungarian). Fol. Hist.-nat. Mus. Matr., 22:<br />
285-322.<br />
VARGA A., CSÁNYI B. (1998-1999) Kagyló fajok elterjedése magyarországi<br />
folyókban az elmúlt évtized vizsgálatai alapján II (Distribution of mussels in<br />
Hungary based on data of the last decade, in Hungarian). (Mollusca - Bivalvia).<br />
Fol. Hist.-nat. Mus. Matr., 23: 347-367.<br />
VARGA, L. (1928): Adatok a szegedi tiszai kubikgödrök limnológiájához, különös<br />
tekintettel azok kerekesféreg-faunájára I. - Acta Biol. Szeged. 1(3), 55-76.<br />
VARGA, L. (1930): Adatok a szegedi tiszai kubikgödrök limnológiájához, különös<br />
tekintettel azok kerekesféreg-faunájára II. - Acta Biol.Szeged 1(3), 207-238.<br />
VARGA, L. (1931): Adatok az egyesült Kõrös két holtágának limnológiájához. – Magyar<br />
Biol. Kut. Int. Munk. 4, 206-221.<br />
VARGA, L. (1953): Bátorliget kerekesféreg faunája (Rotatoria). - In: Székessy V.<br />
(szerk.): Bátorliget élõvilága.- Akadémiai Kiadó, Bp., 121-137.<br />
VARGA, L. (1966): Kerekesférgek (Rotatoria) I. - Magyarország Állatvilága III/7.1-144.<br />
VÁSÁRHELYI, I. (1958): Beträge zur Schneckenfauna der Tisza. Acta Biol.(Szeged)<br />
4, 218-225.<br />
VITUKI (1992) Ökológiai szempontokon alapuló vízminősítő mérőhálózat kidolgozása<br />
(Water quality assessment based on ecological aspects, manuscript in<br />
Hungarian).<br />
-Témajelentés, 7613/3/2163, I-II. kötet.<br />
VITUKI (1994) Dunántúli vízfolyások ökológiai állapotfelmérése (Ecological status of<br />
Trans Danubian running waters, manuscript in Hungarian).<br />
-Témajelentés, 733/3/2651, I-II. kötet.<br />
116
VITUKI (1996) Magyarország felszíni vizei monitoring rendszerének fejlesztése az<br />
EU tagországok tapasztalata alapján (Development of surface water monitoring<br />
system for Hungary based on EU practice, manuscript in Hungarian).<br />
-PHARE Project W-905/90, Összefoglalás, 1-35; Zárójelentés tervezet.<br />
VITUKI (1997) Hazai vízfolyások vízminősítés célú biomonitoring rendszerének<br />
bevezetése (Biomonitoring and water quality assesment for Hungarian running<br />
waters, manuscript in Hungarian).<br />
-Témajelentés, 712/3/3945, 1-58.<br />
VITUKI Rt. 2000: A Szamos és a Tisza folyók romániai eredetű cianid-szennyezése<br />
által okozott környezeti és természeti károk felmérésének vizsgálati eredményei<br />
2000. március 31-i állapot. (Cyanide pollution originated from Romania on the<br />
Szamos and Tisza: results of investigations on dammage caused in the<br />
environment and nature. Manuscript in Hungarian), VITUKI., Budapest, 2000.<br />
április<br />
VITUKI Rt. 2000: A Szamos és a Tisza folyók romániai eredetű cianid- és nehézfémszennyezése<br />
által okozott környezeti és természeti károk felmérésének<br />
vizsgálati eredményei 2000. április 30-i állapot. (Cyanide and heavy metal<br />
pollution originated from Romania on the Szamos and Tisza: results of<br />
investigations on dammage caused in the environment and nature. Status<br />
detected in April 2000. Manuscript in Hungarian), VITUKI., Budapest, 2000.<br />
Augusztus<br />
VITUKI Rt. (2001) A Szamos és Tisza folyók romániai eredetű cianid- és nehézfémszennyezése<br />
által okozott természeti károk felmérése harmadik szakasza<br />
(2001. június-november) (Cyanide and heavy metal pollution originated from<br />
Romania on the Szamos and Tisza: results of investigations on dammage<br />
caused in the environment and nature. Third phase. Status detected in June-<br />
November 2001. Manuscript in Hungarian), VITUKI., Budapest, 2002. Február.<br />
ZICSI, A. (1965): Beträge zur Lumbriciden des Tisza Tales.<br />
Tiscia (Szeged) 1, 59-62.<br />
ZSUGA, K. (1981): Benhic entomostraca fauna of the Tisza and its tributaries. Tiscia<br />
(Szeged). 16: 183-190.<br />
ZSUGA, K. (1994): A Kiskörei-tározó zooplanktonja. In: Bancsi I., Zsuga K. (szerk.):<br />
Komplex műszaki és biológiai eszközrendszer fejlesztése a Tisza-tó környezeti<br />
állapotának védelme és javítása érdekében. OMFB pályázati munka 1993. évi<br />
részeredményei. Szolnok. Kézirat. 234-264.<br />
ZSUGA K. (1995): Rotatoria és Crustacea plankton. In: Zárójelentés a Komplex<br />
műszaki és biológiai eszközrendszer fejlesztése a Kiskörei-tározó (Tisza-tó)<br />
környezeti állapotának védelme és javítása érdekében a prioritások kielégítése c.<br />
OMFB mecenatura pályázati munkáról II. 1. 5. Szolnok. Kézirat. 1-15.<br />
ZSUGA, K. (1996): Zootectonic organisms associated with macrophytes in Kisköre<br />
reservoir. In:Lakatos, Gy. (sd.): Water Quality and Environmental Management.<br />
Proc. The 1 st International ICER TEMPUS PhD Seminar, Debrecen, Hungary.<br />
Acta Biol. Debr. Oecol. Hung. 7:107-119.<br />
ZSUGA, K. (1996a): Intenzív vizsgálatok a Sarudi medence különbözõ jellegű<br />
víztereiben. In: Zsuga K. (szerk.): A Kiskörei-tározó növényzet közötti víztereinek<br />
vizsgálata. Szolnok 67-69., 83-90.<br />
ZSUGA, K. (1996b): Növényzet közötti vízterek szezonális vizsgálata a<br />
vegetációperiódus idõszakában. In: Zsuga K. (szerk.): A Kiskörei-tározó<br />
növényzet közötti víztereinek vizsgálata. Szolnok. 39-65.<br />
117
ZSUGA, K. (1997): Quantitative and qualitative changes of plankton structure in<br />
different reaches of River Tisza. In: Vermes L. (ed.): Investigations of<br />
environmental impacts on river basin and/or flood plain management. Proc. The<br />
2 nd International PhD Seminar. Budapest, Hungary. 5-8 July, 165-172.<br />
ZSUGA, K. (1998): Spatial Heterogeneity and Mosaic-Like Structure of Zooplankton in<br />
Kisköre Reservoir. -Internat. Rev. Hydrobiol. 83. 199-202.<br />
ZSUGA K. (1998a): Zooplankton vizsgálatok a Tisza-tó Poroszlói-medencéjében. In:<br />
Kelemenné Sz. E. (szerk.): A Tisza-tó (Kiskörei-tározó) 1998. évi vizsgálata. Kutatási<br />
jelentés. Kézirat. Szolnok. III. 5. 2. fejezet.<br />
ZSUGA, K. (1999): Zooplankton investigations in the Upper Tisza Region. In: Hamar-<br />
Sárkány Kiss (edit): Tiscia monogrph series. 393-399.<br />
ZSUGA, K., NAGY, M. (1989): Zooplankton vizsgálatok a Tisza vízgyűjtõjén.-<br />
"Természetvédelem 89" Pályázat. Kézirat. Szolnok. 1-39.<br />
ZSUGA, K., NAGY, M. (1991): Regionális zooplankton vizsgálatok a Tisza vízgyűjtõ<br />
területén. II. Magyar Ökol. Kongr. PATE Georgikon Keszthely: 168.<br />
ZSUGA, K., I. BANCSI, I. (1995): Biodiverzitás alakulása a Kiskörei-tározóban. In: Bíró,<br />
P. (szerk.): Biomonitorozás és biodiverzitás. Tihany. 71-74.<br />
ZSUGA K., BANCSI, I. & P. VÉGVÁRI (1998): Növényzettel borított vízterek kémiai<br />
és biológiai állapota. - Hidrológiai Közlöny. 78 (5-6), 327-328.<br />
118