sheets with a two-level ntass-balance paranteterization
sheets with a two-level ntass-balance paranteterization
sheets with a two-level ntass-balance paranteterization

You also want an ePaper? Increase the reach of your titles
YUMPU automatically turns print PDFs into web optimized ePapers that Google loves.
Annals DJ Glaciology 2 1 1995<br />
© In ternational G laciological Society<br />
Therll1.oll1.echanical ll1.odelling of Northern Hell1.isphere ice<br />
<strong>sheets</strong> <strong>with</strong> a <strong>two</strong>-<strong>level</strong> <strong>ntass</strong>-<strong>balance</strong> <strong>paranteterization</strong><br />
PHILlPPE H G YBR ECHTS<br />
Aljred-I Vegener-lnslitlll fiir Po/ar- und Nleel"esjorschllllg . Postfac/i 120161, D-27515 Brelllerhaven . Gerl1Za /~)' .<br />
and<br />
GeograJisch inslilulIl, VriJe Universiteil Brussef, Pleinlaan 2. B-1050 Brt/ssel, BelgiulI1<br />
STEPHE:\ T'SIOBBEL<br />
Geogrc!fisc/Z instiluut , Vrije Uni versiteil BTllssel, Pleill!aall 2. B-1050 Brussel, Belglllll1<br />
ABSTRACT. A three-dimensiona l time-dependent th ermomechanical ice-sheet<br />
model was used together <strong>with</strong> a <strong>two</strong>-l evel (snow-accumulation/runoff) mass- bala nce<br />
model to investigate the Quaternary ice <strong>sheets</strong> of th e Northern H emisphere. The<br />
model fre ely generates the ice-sheet geometry in rcs ponse to spec ifi ed cha nges in<br />
surface temperature a nd mass bala ncc, a nd incl udes bedrock adjustment, basa l sliding<br />
and a full te mpera ture calcul a ti on <strong>with</strong>in the ice. The mass-<strong>balance</strong> para meteri 7.at ion<br />
m akes a d istincti on between snowfall a nd melting. Yearl y sno,\"fa ll ra tes d epend o n the<br />
present precipitation distribution, and a re vari ed proportionall y to cha nges in surface<br />
temperature a nd the moisture content of the air. The a bla ti on model is based on the<br />
positi" e-degree-day method, a nd distinguishes betll'een ice a nd snoll' meltin g. T hi s<br />
paper disc usses stead y-state cha racteristi cs, conditio ns fo r g rowth and retreat, a nd<br />
response time-scales of ice <strong>sheets</strong> as a function of a prescribed lowering of summer<br />
tempera ture. Most notably, the modell ed ex tents of the Eurasia n ice sheet for a<br />
summer temperature lowering of6- 7 K a nd of the La urentide ice sheet for a cooling of<br />
9- 10 K are in reasona ble agreement \Vi th mos t reconstructions based on geological<br />
e"idence, except [or the prese nce of a la rge ice sheet stretching from Alas ka across the<br />
Bering Strait to most of eas tern Siberia. In add ition. wct basal conditions turned out to<br />
be always confined to the margin , whereas centra l areas in these reconstructi o ns<br />
remained a lways cold-based. This is of rele, "a nce fo r processes il1\'o h-in g reduced basal<br />
traction.<br />
1. INTRODUCTION cannot be direc tly inferred from the geological record. but<br />
has to be es ti ma ted from models.<br />
During th e Quaternary, the waxing a nd waning of ice<br />
<strong>sheets</strong> on the continents o[ the Northern H em isphere<br />
constitute a major driving force for global change a nd a re<br />
the main so urce of global sea-<strong>level</strong> flu ctua ti o ns. It is<br />
genera ll y accepted that the m aximum sea -l evel depressio<br />
n during th e last glacial cycle was a ro und 125 m ,<br />
la rgely originating from ice-sheet build-up in North<br />
Ameri ca a nd Eurasia. This corres ponds to a n additiona l<br />
So fa r , m os t ice-shee t mod elling studies, threedimensio<br />
na l a nd <strong>two</strong>-dim ensio na l (horizontal plane)<br />
ha, "e considered only a part of the Northern H emisphere<br />
ice-sheet sys tem (e.g. Budd a nd Smith. 1987; Letreguill y<br />
and R itz, 1993 ) or ha\"C concentrated on th e ice <strong>sheets</strong> as<br />
a lower-bound a ry condition [or cl im ate models (D e<br />
blonde a nd Pcltier, 199 1; :'larsia t. 1992; Verbitsky and<br />
O glesby, 1992 ). None of these mod els included thermod<br />
global ice volume of a ro und 50 x 101 5m 3 (Fairbanks,<br />
1989; Tushing ham and Peltier, 199 1). Whereas the<br />
m aximum ice-sheet ex tent along the southern margins<br />
of th e L a urentide and Fennoscandia n ice <strong>sheets</strong> seems to<br />
be reasonably well documemed (e.g. D em on a nd Hug hes,<br />
198 1), the distribu tion of ice <strong>sheets</strong> along the Russ ian sid e<br />
ynamics. ~ e , "e rthel ess , ice temperature exerts a strong<br />
of the Arctic O cean is till largely unresolved . H ere,<br />
geological reconstructions ra nge from limited ice ex pa n<br />
sion over Scandinavia and Svalbard in the west (Boulto n,<br />
1979) to a n unbroken Eurasian ice sheet ex tending all the<br />
way from Britain to Scandinavia across the Ba rents a nd<br />
K a ra Seas to most of eastern Siberia (Grosswald , 1980).<br />
The thickness of these ice <strong>sheets</strong>, on th e other ha nd,<br />
control on the ice ,·iscosit,· a nd subsequently on the<br />
heigh t/ lV id th ra ti o. i\.lo reover, tem pera te ice a nd mel ti ng<br />
a t the base a re necessary preconditions [or basal sed iment<br />
d efo rmation a nd enhanced basal slidi ng. whi ch are often<br />
menti onecl as mechanisms tha t potentiall y ca n cl es tabili ze<br />
large com inental ice <strong>sheets</strong> by making them much fl a tter<br />
towards the end o[ a glacial cycle (Boul to n and J ones,<br />
1979; O erl ema ns. 1982 ) .<br />
Here, \Ve present res ults obta ined \\"ith a threedimensiona<br />
l th ermo mecha ni cal ice-sheet mod el which<br />
cOl'ers all of the Northern H emisphere \\'here wid espread<br />
continenta l glacia tio n is known to have taken place. T his<br />
11 J
f-fuybm;!zls and T'siobbel : M odelling of Northern HemisjJ/zere ice <strong>sheets</strong><br />
mod el is time-dependent, includes geod yna mi cs and<br />
freely genera tes th e ice-shee t geometry in res ponse to<br />
cha nges in environmenta l conditions. The mod el has been<br />
ex tensively tes ted and valid a ted on th e present-d ay ice<br />
<strong>sheets</strong> of Greenla nd a nd Antarcti ca (Huybrechts, 1990;<br />
H uybrec h t and others, 199 1). The methods adopted to<br />
es tima te th e mass-bala nce components a re simil ar to<br />
those tha t proved their a pplicability on these ice <strong>sheets</strong>.<br />
Though the prescription of clima ti c bounda ry conditions<br />
is likely to be more complex a t mid-la titudes th a n in th e<br />
pola r regions, this is seen as part of an inve rse modelling<br />
exercise, in whi ch an a ttempt is made to inves ti gate th e<br />
clima ti c conditions tha t produced these ice <strong>sheets</strong> in th e<br />
first place. This pa per aims to doc ument so me basic<br />
characteristi cs of th e Northern H emisphere ice <strong>sheets</strong> (ice<br />
volume, ice-shee t geometry, res ponse time-scales and basal<br />
tempera ture co nditions) as a fun c ti on of an imposed<br />
tempera ture 100\·ering. Of special interes t a re th e various<br />
thres holds required to grow and decay the individual ice<br />
shee ts that com posed the Qua terna ry glacial sys tem .<br />
Time-d ependent simula ti ons in voking glacial cyc les will ,<br />
however, be presented elsewh ere (pa per in prepara ti on by<br />
P. Huybrechts and S. T'siobbel).<br />
2. MODEL SET-UP<br />
The ice-shee t model closely resembles th e \'e rSlO n<br />
desc ribed by Huybrechts ( 1993 ). It basica ll y solves<br />
conse rva tion equations for mass a nd heat and has a full<br />
coupling between th e fl ow a nd tempera ture fi elds. Only<br />
grounded ice fl ow is taken into account, <strong>with</strong> a Glen-type<br />
fl ow la w a nd a tempera ture-depend ent ra te factor give n<br />
by a n Arrhenius rela ti onship. Longitudina l d evi a toric<br />
stresses a re disregard ed and basal sliding (of VV ecrtma n<br />
type) is res tricted to a reas a t tb e press ure-melting point.<br />
In th e present formula ti on, the poss ibility of ice shelves<br />
a nd grounding-line d yna mi cs was excluded a nd the<br />
maximum poss ible extent of grounded ice was constrained<br />
by specifyin g a coastline fo ll owing th e - 500 m<br />
isoba th. This a pprox im a tely coincid es <strong>with</strong> th e ma rgin of<br />
the continenta l pla tform in th e Arcti c basin, over whi ch<br />
ice shee ts can freely expa nd provid ed the surface mass<br />
bala nce is sufTi cien tI y p os i ti ve. Beyond th is pre-se t<br />
boundary, a ll ice is los t as calf ice.<br />
The th erm od yna mi c calcula ti ons employ standard<br />
procedures. Heat transfer is consid ered to res ult from<br />
verti ca l diffusion, th ree-di mensiona l ad vecti o n and<br />
deform a ti ona l hea ti ng a t la yeI' interfaces. In the timedep<br />
endent mode, heat can also fl ow in to an underl ying<br />
roc k sla b 0 1' 2 km thickn ess. The lower-bo unda r y<br />
condition on tempera ture corres ponds to a geothermal<br />
heat flu x of 42mW m 2 . Bedrock adjustments are<br />
mod ell ed as a d a mped return <strong>with</strong> a stead y-sta te<br />
del1ec ti on given by local isos ta ti c equi li brium. The e<br />
foldin g time scale is se t a t 3000 years, <strong>with</strong> a mantle<br />
densi ty which is 3.6 times th a t of ice. All calcul a ti ons ta ke<br />
place on the same grid. It comprises 193 x 193 grid cells<br />
tha t a re laid out over a pola r stereogra phic ma p<br />
projection <strong>with</strong> sta ndard pa rallel a t 60° N . With this<br />
standard pa ra ll el, distortions in distance range from a<br />
factor of 0.92 a t 45° N to a factor of 1.07 a t the pole, th e<br />
effec t of which has been ta ken into account to calcula te<br />
the ice [luxes and the ice volume. The horizon tal mesh size<br />
is 50 km , and there a re 11 layers in the vertical , conce<br />
n tra ted towards the base. This resolu ti on is the<br />
minimum required to in corpora te realisti c geogra phy<br />
a nd to capture th e esse n ti al characteristi cs of th e vertical<br />
velocity a nd tempera ture profiles.<br />
The mass-bala nce model distinguishes between snow<br />
accumula tion and abla ti on and is driven by a prescribed<br />
" background" tempera ture change th a t is uniform in<br />
space but 50% hi gher in J a nua ry than inJuly. The la tter<br />
feature is a cha racteristi c common to mos t genera l<br />
circul a ti on model (GCM) simula tions (e.g. M ana be and<br />
Broccoli , 1985) a nd is also supported by palaeoclima ti c<br />
reconstructions based o n geologica l a nd bi ological<br />
evidence (Frenzel and others, 1992). This feature is<br />
usua ll y a ttributed to the a lbedo-tempera ture effect a nd a<br />
sta ble ve rti cal stratificati on in th e lower stra tosp here,<br />
whi ch prevents la rge-scale mi xing of the air, especia ll y<br />
during winter. The basic inputs are data se ts for the mean<br />
monthly sea-l evel temperature and th e mean monthly<br />
precipita ti on ra te over the entire grid. These reference<br />
c1im a tologies were ta ken from precipita ti on maps Uaeger,<br />
1976) and from tempera ture d ata used to initia li ze th e<br />
H a mburg GCM model (ECHAM-I in the T 2 1 mode) a t<br />
the 1000 hPa <strong>level</strong>. Surface tempera tures were calcula ted<br />
using a la pse ra te of 8 K km- I, a va lue so mewh a t higher<br />
tha n the sta ndard la pse ra te for th e free a tmosphere. This<br />
is in I i ne wi th measu remen ts on th e ice <strong>sheets</strong> of<br />
Antarcti ca and Greenland, a nd can be ex plained by<br />
radia tive cooli ng at th e surface, particularly during the<br />
winter season. The corres ponding surface elevati on was<br />
ta ken as th e maximum of either the mean elevation of a<br />
grid ce ll during the calcula ti ons or th e hi ghes t peak<br />
<strong>with</strong>in this grid cell for th e pre ent topogra phy. This is<br />
because the glaciation thres hold is to a la rge ex tent<br />
determined by the mos t el e\'ated terrain , a piece of<br />
info rmation tha t is otherwise lost when valu es a re<br />
averaged on th e 50km grid.<br />
The model consid ers only changes of' precipita ti on<br />
intensity but keeps th e precipita ti on pa ttern uncha nged.<br />
The tota l precipita ti on is se t proportiona l to the moistureholding<br />
capacity of an air column, and has a sensitivity of<br />
4% K- 1 • This seems to be a reasonable ass umption a t<br />
pola r la titudes, supported by ana lyses of Anta rcti c a nd<br />
Greenland ice cores (Vi ou and others, 1985; Cla usen and<br />
others, 1988), but its validity during maximum glacia tion<br />
a t mid-Ia ti tudes can be ques tioned . H ere, preci pi tation is<br />
likely to be increasingly a fun ction 0[' such factors as<br />
a tmospheric circul a tion, continen tali ty a nd orography. A<br />
more sophisti cated a pproach, however, is deemed fa r<br />
beyond the purpose of the present stud y. The fracti on of<br />
prec ipita tion fa lling as snow is determined by the surface<br />
temperature, a nd varies from one to zero for mean<br />
mon thly tempera tures in the range of 263- 280 K. Such a<br />
rela ti on is suggested from meteorological observa tions in<br />
Ca nad a a nd Russia . Ice a nd snow abla tion, on the other<br />
ha nd, a re d ealt <strong>with</strong> locall y. Following a procedure<br />
previously adopted for the Greenl and ice sheet (R eeh ,<br />
1989; Huybrechts and others, 1991 ), the melting ra te is<br />
set proportional to the yearly sum of positive degree d ays<br />
(PDD). Degree-d ay fa ctors were 3 mm a 1 jPDD for snow,<br />
and 8 mm a 1 jPDD for ice. The mass-ba lance pa rameterization<br />
furth ermore incorpora tes th e process of super-<br />
112
Huybrechts and T'siobbel : ,\/odeUing oJ .,"ortliem Hemisphere ice <strong>sheets</strong><br />
imposed ice form a ti on, but neglects a p o. sible contribution<br />
from rainfall , which is assumed to run off entirely. In<br />
the model, summer tempera ture was taken as th e relel'ant<br />
fo rcing p a ra m eter. This m ea ns th a t the "effec tive"<br />
abla ti o n tempera ture ro ug hl y equals the applied tempera<br />
ture drop, but that th e effective (i. e. mean a nnua l)<br />
tempera ture for the calcula ti on of the prec ipita ti o n<br />
intensity is 2S% hig her. For the latter calcula tions, a n<br />
additio na l tempera ture cha nge res ulting from elel'a ti on<br />
cha nges was not ta ken into account.<br />
3. RESULTS<br />
3. 1. Ice-sheet geornetries<br />
First of all, th e mod el was run under present clima ti c<br />
conditions <strong>with</strong> a zero temperature perturbation sta rting<br />
from no ice cover a t a ll. The res ult, a ft er a tota l<br />
integra tion time of 10 5 years, is shown as th e upper left<br />
pa nel in Figure I a. As d emonstra ted in this fi g ure. the<br />
simula tion is quite reali sti c. The Greenl a nd ice sheet is<br />
well reproduced , a nd the sma ll er ice masses turn up in<br />
almost the sam e places as they a re observed today. Thi . is<br />
the case for the Arcti c isla nds (northern Novaya Zemlya,<br />
Svalba rd, Fra nz J osefLa nd a nd Sel'ernaya Zeml ya); but<br />
a lso the location of ice in Scandinavia Uos ted a lsbreen a nd<br />
Svartise n), th e Alps, southeas tern I cela nd (V a tn ajokull ),<br />
Al aska a nd Kamcha tk a is in good agreement <strong>with</strong> the<br />
present situa tion. Apparently, the mass-ba la nce model is<br />
a bl e to id entify th e correct a reas <strong>with</strong> a pos itil'e mass<br />
ba la nce. The onl y real d evia ti on from th e present-day<br />
situa tion is fo und over th e Ca nadi a n Arc ti c. Here, th c<br />
model produces a unified ice cap over Ell es mere Isla nd,<br />
Axel H eiberg Isla nd a nd D evon Isla nd of O\U 2000 m<br />
altitude, proba bly because of a n in ad equa te representati<br />
on of the coastline a nd sma ll er-scale fj ords, a ll owing<br />
sm a ll glaciers a nd ice caps to merge into a la rger ice cap.<br />
The present sta te was then taken as a n initia l<br />
cond i ti on for th e e1i ma te sensi ti I·i ty ex peri men ts, a nd<br />
mod el calcul a ti ons ran until a full stead y sta te was<br />
reached. R es ulting geometries for summer tempera ture<br />
lowerings in the range 0 (' - 2 to - 10 K are shown in Fig ure<br />
I a . I t a ppears tha t maj or ice <strong>sheets</strong> spread from g lacia ti on<br />
centres tha t a re a ll present in proto-form tod ay. In I\o rth<br />
Ameri ca, <strong>two</strong> sepa ra te ice shee ts build up O\'er th e coasta l<br />
R ocki es and the Canadia n Arcti c Isla nds. A cooling o f<br />
more tha n S Kis required for the latter ice sheet to cross<br />
Hudson Bay a nd cove r th e Ungava Peninsul a a nd<br />
La brad or plateaus, which themselves d o no t a ct as<br />
independent in ception a reas. During this evolution, the<br />
summit of the La urentide ice sheet mig ra tes wes t tOI'\'ards<br />
the Atlantic a nd reaches a maximum elcl'a tion of around<br />
4000 m. A very substa ntial summer cooling of 10 K (in the<br />
mod el this corres ponds to - 12.S K in the a nnua l mean<br />
a nd - IS K in winter) is required for th e Laurentide ice<br />
sheet to merge <strong>with</strong> the Cordillera n ice sheet, but the<br />
respecti ve ice domes are well conse rved. The mod el has<br />
difficulty growing the La urentide ice sheet far enough to<br />
the south in the ~lidw es t e rn U.S.A. This may \\'e11<br />
indicate tha t the mod el underes tima tes precipita tion ra tes<br />
there and that a reorgani zation of the a tmos pheri c<br />
circul a ti on produced much wetter conditio ns during<br />
m aximum g lacia ti on in continenta l North Ameri ca.<br />
In Eurasia, th e mod el produces the Ba rents a nd K a ra<br />
ice shee ts for a mod era le cooling of a bout 4 K . a t the sa me<br />
time as the Fennoscand ia n ice sheet is still la rgely<br />
confined to the Norwegia n mo unta ins. This supports the<br />
\·ie\\· th a t the Siberi a n ice <strong>sheets</strong> ori gin a ted in the Arcti c<br />
basin and spread " from th e sea" into th e adjacent<br />
continent (Gross\\'a ld . 1980). tho ug h such a n in fe rence<br />
should be resen 'ed because th e model d oes no t expli citl y<br />
d eal <strong>with</strong> marine ice-sheet d yna mics . For a summer<br />
tempera ture lowering of 6 7 K , the simula ted Eurasia n<br />
ice shee t is in broad agreemen t wi th mos t geologic a l<br />
reconstructions fo r the Last Glacia l ~l ax imum, th oug h<br />
th ere a re so me regio na l d el·ia ti ons . .\fa ximum elel'a ti ons<br />
a re abo ut 3500 m here.<br />
Proba bk th e larges t d el'ia ti on (i'om \I'ha t is kno\l'n of<br />
th e Qua terna ry glacia l cycles is th e continuous ice sheet<br />
cO \'ering Al aska. th e Bering Stra il a nd northeastern<br />
Siberi a, \I'hi ch ultima tely (for a cooling below 8 K )<br />
merges <strong>with</strong> th e Eurasia n ice sheet a nd an ice cap north of<br />
the Sea ofOkh o tsk to fo rm a huge circuma rcti c ice mass.<br />
There is no el'id ence to support glacia li on in northern<br />
Al aska a nd th e Bering Stra it, thoug h se\'era l reconstructi<br />
ons imply a t least some ice in coasta l eastern Si beri a a nd<br />
the hi gher pl a teaus further so uth (D enton a nd Hug hes,<br />
198 1: Tushing ha m a nd Pelti er, 199 1). A pl a usib le<br />
expla na ti on for th e disc repa ncy would be cha nges in<br />
precipita ti on pa tterns, not accounted for in o ur massba<br />
la nce pa ra m eteri zati on. Fo r insta nce, the d Cl'e1opmen l<br />
o f a n ice sheet O\'e r so uthern Al aska a nd perma nent sea<br />
ice in the Arcti c O cean may well hm'e d epri\'Cd th e<br />
northern coasta l a reas o f suffi cient moisture.<br />
3.2. Bas al telIlperature conditions<br />
Fig ure I b shows th e stead y-sta te thermal conditio ns a t the<br />
base associa ted <strong>with</strong> th ese climate sensiti \'it y experiments.<br />
The distribution of a reas a t press ure-melting poinL is<br />
importa nt beca use th e production oC basal water is a<br />
necessary prereq ui site for basal sliding a nd th e possibility<br />
of enha nced ice now due to the d eforma ti on of underl ying<br />
sediments. lnteres ting ly, wet-based a reas in th ese reconstructi<br />
ons a re confin ed to th e ou ter regions, \I'hereas<br />
centra l a reas remain a lways cold-based. Despite lower<br />
accumulation ra tes in cold er clima tes , implying less<br />
adl'ecti on of cold ice to\l'ards the base, a nd centra l ice<br />
thicknesses a bove 34 km , contributing to a basal<br />
wa rming because of th e " insul a ting effect", the simulated<br />
No rthern Hemisphere ice sheels fa il to become temperate<br />
OI'er the large a reas need ed fo r the possibility of some kind<br />
of sliding insta bility. T ypicall y. m ea n a nnual surface<br />
tempera lUres over th e hi gher pa rts of th e ice <strong>sheets</strong><br />
simula ted for a cooling of 10 K a re of th e order of 220-<br />
230 K , <strong>with</strong> correspo nding basal tempera lures d OlI'l1 to<br />
15- 20K below the press ure-melting po int. Consequently,<br />
these simula ti o ns d o no t support ice-dyna mi c th eories<br />
th a t illl'o ke th ermal switches a t th e base.<br />
3.3. Ice volulIle<br />
The corresponding ice I'o lumes a rc summa rized III the<br />
solutio n diagra m sho wn in Fig ure 2 . Two se ts o f m od e l<br />
11 3
HlIybrechts and T'siobbe!: llIodel/il/g qf. \ 'orthem Hemis/Jhere ice <strong>sheets</strong><br />
a<br />
..<br />
b<br />
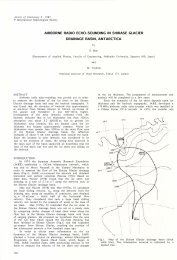
Fig. l.a. Lll odelled stearo'-state ice-sheet geol71etriesjor slimmer tem/Jerature /Jertllrbations below present <strong>level</strong>s as indicated.<br />
Contours areIor slIIJace eLevaliol1 al/d are spaced 500111 a/Jart. These eX/Jeriments started wiliz a simulalio71 01 the /Hesent<br />
ice-sheet distributiol/ (shown ill the upper left /Jallel) as illitial cOl/figuration. b. Basal tem/Jerature cOllditions con esjJonding<br />
to the simulations shown ill Figure 1. Dark shadillg indicates where the base is at the pressure-melting /Joint, and basal<br />
sliding call O[[lIr; intermediate shading is JOT frozen basal cOlldilions; light shaded areas are ice-jree.<br />
114
Hlqbrechts and T'siobbel : M odelling oJ }/orthem HemisjJ /iere ice <strong>sheets</strong><br />
runs a re displ ayed, one in whi ch the present ice-sheet<br />
distribution was used as a n initia l condition (" interglacia<br />
l condirio ns") a nd one in which rhe ice-sheer<br />
confi g ura ti on for 10 K se ryed to sta rt the calcul a ti ons<br />
up ("glacial conditions" ). There a re <strong>two</strong> so lutions,<br />
d epending on whether the ice <strong>sheets</strong> were a lread y<br />
present or no t, a behavio ul' well d escribed for ice <strong>sheets</strong><br />
where the m ass-ba lance field is a fun cti on of surface<br />
e1 e\'ati o ll (O erl em a ns a nd V a n d e r V een , 1984) .<br />
T y pi call y, th e "width" of th e hys teresis is found to be<br />
a bo ut 2 K. An a dditio na l ice \'olume o f a bo ut<br />
4 .5 x 10 16 m 3 , which is a reasona ble es timate [o r rh e<br />
L as t G lacia l ~1 ax imum contribution of th e N orthern<br />
H emisphere ice <strong>sheets</strong>, is seen to be p roduced [or a<br />
summer tempera ture lowering o f" 6- 7 K. This value<br />
12<br />
10<br />
et)<br />
E<br />
<br />
(l)<br />
E.<br />
2<br />
0<br />
-12 -10 -8 -6 -4 -2 0 2<br />
Temperature perturbation relative to present (K)<br />
12<br />
10<br />
M<br />
E<br />
CD 8<br />
a ,....<br />
Q)<br />
6<br />
E<br />
::><br />
~ 4<br />
(l)<br />
E.<br />
2<br />
0<br />
0 25<br />
_---,-10K<br />
~ __ --; -9K<br />
__ ------1 -8 K<br />
__ -----------, -7K<br />
__ -----1 -6 K<br />
__-----~-5K<br />
_------~ -4 K<br />
50 75 100 125 150<br />
Time (kvr)<br />
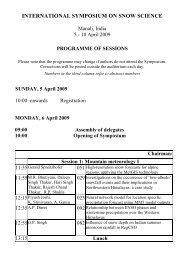
Fig. 3. T ime-scales Jor ice-sheet build-up after the model<br />
was submitted 10 a sudden clwwtic cooling of the<br />
magnitude shown at the right . T he jJresent interglacial<br />
state served as an initial condition.<br />
Another kind of (tenta ti ve) inference can be made<br />
when rela ting the ice-vo lume CLln'es of Figure 2 to the<br />
reconstructi ons shown in Figure 1 b. For insta nce, th e iceshee<br />
t reconstruction (o r a temperature lowering of 6 K<br />
contains roughl y rhe ri ght a mounr o[addiriona l LG~1 ice.<br />
but shows a La urentide ice hee t that spreads fa r less [0<br />
th e so uthwes t th an indicated by the geological record. As<br />
th e ex tent of the Eurasian ice sheet corres ponds better<br />
<strong>with</strong> mos t reconstructi ons, this mi ght indicate th a t ice<br />
shee ts during rh e Last Gl ac ial .\Iax imum were significantly<br />
thinner th a n rh e mod el simula ri ons suggest.<br />
Fig. 2. Solutioll diagram giving stead),-state ice volume as<br />
a jill1ctioll oJ the temjJe1"{/tme perll/rbatioll . T he J II II<br />
jqllares are Jar model rUlls ill wlzich the jJresent<br />
'" intelg/aria/" ' state was taken as an initial conditioll:<br />
tlte open squares started Jrom the "glacial" ice sheet<br />
simulated Jor a a temperature change of - 10 K. As aJirst<br />
estimate, 10 milliollkm J (i.e.lO/GII/) of ice conesjJonds to<br />
a worldwide sea-/e/'el lowering cif abouL 25 m.<br />
4. CONCLUSION<br />
This pa per d isc ussed Northern H emisphere ice-sheet<br />
simula ti ons obtained <strong>with</strong> a three-dimensi onal thermomecha<br />
ni cal ice-sheet model cou pl ed wi th a parameteri zed<br />
mass-ba la nce model. The mos t important find ings th a t<br />
camc out of th ese experiments can be summari zed as<br />
[0 11 0\-\,,5 :<br />
refe rs to a stead y state, however. As d monstra ted in<br />
Fig ure 3, th ere a re lon g time-scales required to build<br />
ice sheers up . T ypical e-folding time-scales a ppear to be<br />
of the order of 40000 60000 yeal's, m a king it quite<br />
unlikely tha t the N o rthern H emisphere ice shee ts<br />
during the LGM were in [ull equilibl'ium w ith the<br />
clima te a r th a t tim e. Consequentl y, the inferred cooling<br />
sho uld be considered as a lower bound. M elting of ice<br />
<strong>sheets</strong>, on the other ha nd , is a much faster process<br />
because oC the hi gher magnitude of a bla ti o n I'ates .<br />
According to the curves displayed in Fi g ure 4, it may<br />
ra ke as little as 5000 6000 years [0 entirely rem ove the<br />
L a ure ntide a nd Euras ia n ice sh eets fro m the ir<br />
continenta l base when the clima te switches from fu ll<br />
g lacia l to fu ll interglacia l conditions. In tha t case, only<br />
a sm a ll ice cap rema ins centred over no rthern No\"aya<br />
Zeml ya and th e adjoining K a ra Sea th a t would require<br />
a n add i ti ona l m echa nism oC perha ps manne o n g Ill [or<br />
its d ecay.<br />
M<br />
E<br />
ID<br />
...<br />
0<br />
(l)<br />
E<br />
::l<br />
0<br />
><br />
(l)<br />
..S:1<br />
12<br />
10<br />
8<br />
6<br />
,<br />
-<br />
- ~<br />
-<br />
~ -<br />
~<br />
4<br />
~<br />
2 -<br />
0 I<br />
o 25<br />
I<br />
I<br />
-9 K<br />
-8K<br />
-7 K<br />
.oK<br />
-5K<br />
-4K<br />
-3K<br />
-2 K<br />
-1 K<br />
OK<br />
\<br />
50 75 100<br />
Time (kyr)<br />
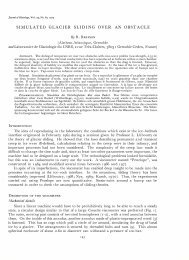
Fig. -I. Evolution curves Jar c 'orLhem Hemisphere ice<br />
volume Jar various temperaLlae rises above - 10 K. T hese<br />
calClllations started <strong>with</strong> Ihe glacial ice-sheet configuration<br />
as an initial condition.<br />
11 5
Huybrechts and T'siobbeL: A10deLling oJ Norlhem Hemisphere ice <strong>sheets</strong><br />
(i)<br />
T he degree-day method es timating runoff based on<br />
m easurements in Greenl a nd seems to have a<br />
continent-wide validity, at least for present-day<br />
climatic conditions. This follows from a basicall y<br />
correct identifi cation oC abla ti on areas for th e prese n t<br />
state.<br />
(ii ) The Eurasian ice sheet reaches approximately its<br />
full extent for a summer temperature lowering of6-<br />
7 K.<br />
(iii ) A North American ice sheet in rough agreement <strong>with</strong><br />
LGM reconstructions is only produced for coolings of<br />
below 9- 10 K.<br />
(iv) The Barents- K ara ice-sheet complex ori ginated on<br />
isla nds in the Arctic O cean and spread from there to<br />
the adjacen t con ti nen t.<br />
(v) Basal temperatures in th e central parts of th e<br />
simulated ice <strong>sheets</strong> remain always well below the<br />
melting point, and wet basal conditions a re confined<br />
to the margins.<br />
(vi) Several ten thousand s of years a re required to grow<br />
the large Northern H emisphere ice <strong>sheets</strong> to their full<br />
sIze.<br />
(vii ) D eca y of full-grown ice <strong>sheets</strong> by surface melting can<br />
be accomplished in a bout 5000 years under an<br />
interglacial climate.<br />
Nevertheless, this study has also highlighted so me of<br />
the shortcomings of the present model. The most<br />
importa nt ones are probably related to the influence of<br />
the ice <strong>sheets</strong> on the a tmospheri c circulation, in particular<br />
<strong>with</strong> res pect to changes in precipitation pa tterns, a nd to<br />
the way marine ice-sheet dynamics are treated in th e<br />
model. A furth er logical step is then also to couple th e icesheet<br />
model <strong>with</strong> an ice-shelf model a nd to incorporate an<br />
a tmospheric-flow model that d eals <strong>with</strong> changes in the<br />
wind fi eld as the ice <strong>sheets</strong> grow into the troposphere.<br />
These developments a re presently under way.<br />
ACKNOWLEDGEMENTS<br />
This paper is a contribution to the Belgian Impulse<br />
Programme on Global Change, initiated by the Science<br />
Poli cy Office (Services of the Prime Ministel-). During this<br />
research, P. Huybrechts was on leave as a postdoctoral<br />
researcher <strong>with</strong> the Belgian National Fund for Scientific<br />
R esearch (NFWO). We thank W. Budd, A. Letreguilly<br />
a nd C. Ritl: for their constructive reviews of the<br />
manusc ript.<br />
REFERENCES<br />
Bouilon, G. S. 1979. Glacial hi tory 01" the Spit sbergen archipelago a nd<br />
the problem ofa Baren ts Shc1fice sheet. Boreas. 8 ( 1). 3 1 ~ 57.<br />
Boulton, G. S. and A. S. J ones. 1979. Stability of tempera te ice caps and<br />
ice <strong>sheets</strong> res ting on beds of deformable sediment. ]. Cla{;ol., 24(90 ),<br />
29-43.<br />
Budd, W. F . a nd 1. N. Smilh . 1987. Conditions for growth a nd retreat of<br />
the La urentide ice sheet. Giographie Ph),siqlle et Qpatemaire, 41 (2), 279~<br />
290.<br />
Clausc n, H . B., l\'. S. Gundestrup. S. J. .1 ohnsen, R . Bindschadler and J.<br />
Zwall y. 1988. Glaciological investi gati ons in the Crete area, cemral<br />
Greenland: A search for a new deep-drilling sil e .. 1111. Claciol .. 10. 1 0~ 15.<br />
D cblonde, G. a nd " .. R. Pelticr. 199 1. Simulations of cominenta l ice<br />
sheet growth over the last g l acia l~int e r g l acia l cycle: ex perimcnts <strong>with</strong><br />
a one- le\'eI seasonal energy ba la nce model including realistic<br />
geography. J. Geopl! ys. Res., 96 (D 5), 9 1 89~92 1 5.<br />
D enton, G. H . and T. J. H ughes, eds. 198 1. The last great ice <strong>sheets</strong>. New<br />
York, etc., W iley a nd Sons.<br />
Fairbanks. R . G. 1989. A 17.000-year glacio-eustatic sea In·cl record :<br />
influence o f g lac ial melting rates on th e Yo unger Dryas C\'cnt a nd<br />
deep-ocean circul a ti on . . Vatllre, 342 (6250), 637 ~642.<br />
F renzel, B., i'vl. Pecsi and A. A. Velichko, eds. 1992. Atlas of palaeoclilllates<br />
and /Jaia eOellvirollmellts oJ the . vorthem Helllis/lilere, Lale Pleistocelle~<br />
Holocelle. Stuttgart, Gustav Fisher Verl ag.<br />
Gross,,·ald. M. G. 1980. Late W eichse li a n ice sheet of northern Eurasia.<br />
Q!,al. Res., 13( I ), 1 ~ 32 .<br />
H uybrechts, P. 1990. A 3-D model for the Antarctic ice shee t: a<br />
sensiti vi ty slud y o n the glac ial- interglac ial contrast. Climate D.,vnamifJ,<br />
5 (2 ), 79 92.<br />
H uybrech ts, P. 1993. G laciologicalmodelling of the L a te Cenozoic East<br />
Antarctic ice sheet: sta bility or d yna mism? Ceogr. Ann. , 75A(4). 22 1 ~<br />
238.<br />
Huybrcc hts, P ., A. Letrcguilly and N. Rceh. 1991. The G reenland ice<br />
sheet and g reenhouse warming. Pttlaeogeogr .. Palarorlimatol., Pa/aeoecol.,<br />
89(4 ), 399-412.<br />
Jaeger, L. 1976. M onatska rten des Niederschlags flir d ie ~a nz e Erde.<br />
Bericllte des Delltschen 'I ·ellerdienstes, 18( 139).<br />
Lc treguilly, A. a nd C. Ritz. 1993. I\lodelling 0 1" the Fennoscandian ice<br />
shee t. III Peltier, "'.R. ed. Ice ill the climate .D'stem . Berlin, Springer<br />
" erl ag, 2 1-46. (NATO AS I Seri es. Series I. G loba l En\'ironmental<br />
C ha nge. Vo!. 12. )<br />
\ia na be, S. a nd A. J. Broccoli . 1985. T he innuencc of contincnta l ice<br />
sheels on the cl imate of a n ice age. ]. Geo/lh)"J. Res .. 90 (D I), 2 1 67 ~<br />
2 190.<br />
\Iarsia t, I. 1992. \Iod clisa ti on d e I'holution d es calottes glaciaires en<br />
rcponsc a u for~age astronomique. i Ph.D. thesis, Universitc Cathol<br />
ique d e Lou"ain. )<br />
Oerlemans, J. 1982. Glacial cycles and ice-shee t modelling. Clillw/ie<br />
Chlll/ge, 4 ('. ), 353 374.<br />
Oerlemans, J . and C ..1. van d er Veen. 1984. Ice shu /J and clill1ale.<br />
Dordrech t, e tc .. D . R eidel Publishing Company.<br />
Rceh, 'i. 1991. Pa ra meleriz a ti on of melt ra te a nd surfilce temperature<br />
on the Greenland ice sheet. PolmJorschllng, 59 (3), 1989, 11 3 ~ 1 28.<br />
Tushingha m , A. 1\1. and \\'. R . Peltier. 1991. Ice-3G: a ne\\" global model<br />
of Late Pl eistocene deglacia ti on based upon geophys ical predictions<br />
of post-glacial relative sea <strong>level</strong> change. J. Geo/)/~)' J. Res., 96(B3),<br />
4497-4523.<br />
Verbitsky, M . Ya. a nd R .J . Oglesby. 1992. The effect 01" a tmospheri c<br />
carbon dioxide concentra tion on the continental glaciation of" the<br />
Northern Hemisphere. J. Geoph)'s. Res., 97 (0 5), 5895~5909.<br />
Yiou, F., G. ~1. Raisbeck, D . Bourles. C. Lorius a nd N . I. Ba rko\'. 1985.<br />
lOBe ill ice a t Vos tok Anta rcli ca during the last climatic cycle. Xalllre,<br />
316 (6029), 6 1 6~617.<br />
ll 6