Antarctic and Southern Ocean, 1949-96 - International Glaciological ...
Antarctic and Southern Ocean, 1949-96 - International Glaciological ...
Antarctic and Southern Ocean, 1949-96 - International Glaciological ...

You also want an ePaper? Increase the reach of your titles
YUMPU automatically turns print PDFs into web optimized ePapers that Google loves.
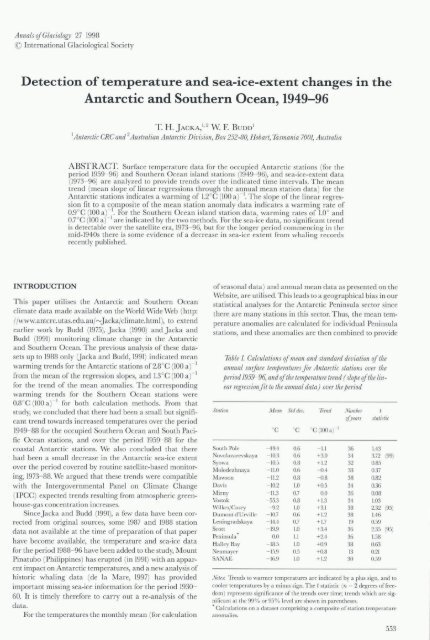
Annals oJGlaciology 27 1998<br />
© <strong>International</strong> <strong>Glaciological</strong> Society<br />
Detection of temperature <strong>and</strong> sea-ice-extent changes in the<br />
<strong>Antarctic</strong> <strong>and</strong> <strong>Southern</strong> <strong>Ocean</strong>, <strong>1949</strong>-<strong>96</strong><br />
T. H. jACKA,I, 2 \tv. F. BUDD 1<br />
1 <strong>Antarctic</strong> CRC <strong>and</strong> 2Australian <strong>Antarctic</strong> Division, Box 252-80, Hobart, Tasmania 7001, Australia<br />
ABSTRACT. Surface temperature data for the occupied <strong>Antarctic</strong> stations (for the<br />
period 1959- <strong>96</strong>) <strong>and</strong> <strong>Southern</strong> O cean isl <strong>and</strong> stations (<strong>1949</strong>- <strong>96</strong>), <strong>and</strong> sea-ice-extent data<br />
(1973- <strong>96</strong>) are analyzed to provide trends over the indicated time intervals. The mean<br />
trend (mean slope of linear regressions through the annual mean station data) for the<br />
<strong>Antarctic</strong> stations indicates a warming of 1.2°C (100 a) I. The slope of the linear regression<br />
fit to a composite of the mean station anomaly data indicates a warming rate of<br />
0.9°C (100 a ) I. For the <strong>Southern</strong> <strong>Ocean</strong> isl<strong>and</strong> station data, warming rates of 1.0° <strong>and</strong><br />
O.7°C (100 a )- I are indicated by the two methods. For the sea-ice data, no significant trend<br />
is detectable over the satellite era, 1973- <strong>96</strong>, but [or the longer period commencing in the<br />
mid-1940s there is some evidence o[ a decrease in sea-ice ex tent from whaling records<br />
recently published.<br />
INTRODUCTION<br />
This paper utilises the <strong>Antarctic</strong> <strong>and</strong> <strong>Southern</strong> <strong>Ocean</strong><br />
climate data made available on the World Wide Web (http:<br />
//www.antcrc.utas.edu.au/ ... Jacka/climate. html), to extend<br />
earlier work by Budd (1975), Jacka (1990) <strong>and</strong> Jacka <strong>and</strong><br />
Budd (1991) monitoring climate change in the <strong>Antarctic</strong><br />
<strong>and</strong> <strong>Southern</strong> O cean. The previous analysis of these datasets<br />
up to 1988 only Uacka <strong>and</strong> Budd, 1991) indicated mean<br />
warming trends [or the <strong>Antarctic</strong> stations of2.8°C (lOO a) 1<br />
from the mean of the regression slopes, <strong>and</strong> 1.3 °C (100 a r l<br />
for the trend of the mean anomalie . The corresponding<br />
warming trends [or the <strong>Southern</strong> O cean stations were<br />
0.8°C (100 a ) 1 for both calculation methods. From that<br />
study, we concluded that there had been a small but significant<br />
trend towards increased temperatures over the period<br />
<strong>1949</strong>- 88 for the occupied <strong>Southern</strong> <strong>Ocean</strong> <strong>and</strong> South Pacific<br />
O cean stations, <strong>and</strong> over the period 1959- 88 for the<br />
coastal <strong>Antarctic</strong> stations. \,ye also concluded that there<br />
had been a small decrease in the <strong>Antarctic</strong> sea-ice extent<br />
over the period covered by routine satellite-based monitoring,<br />
1973- 88. We argued that these trends were compatible<br />
with the Intergovernmental Panel on Climate Change<br />
(IPCC) ex pected trends resulting from atmospheric greenhouse-gas<br />
concentration increases.<br />
SinceJacka a nd Budd (1991), a few data have been corrected<br />
from original sources, some 1987 <strong>and</strong> 1988 station<br />
data not available at the time of preparation of that paper<br />
have become available, the temperature <strong>and</strong> sea-ice data<br />
for the period 1988-<strong>96</strong> have been added to the study, Mount<br />
Pinatubo (Philippines) has erupted (in 1991) with an apparent<br />
impact on <strong>Antarctic</strong> temperatures, a nd a new analysis of<br />
historic whaling data (de la Mare, 1997) has provided<br />
important missing sea-ice information for the period 1930-<br />
60. It is timely therefore to carry out a re-analysis of the<br />
data.<br />
For the temperatures the monthly mean (for calculation<br />
of seasonal data) <strong>and</strong> annual mean data as presented on the<br />
Website, are utilised. This leads to a geographical bias in our<br />
statistical analyses for the <strong>Antarctic</strong> Peninsula sector since<br />
there are many stations in this sector. Thus, the mean temperature<br />
anomalies are calculated for individual Peninsula<br />
stations, <strong>and</strong> these anomalies are then combined to provide<br />
Table 1. Calculations oJ mean <strong>and</strong> st<strong>and</strong>ard deviation oJ the<br />
annual surface temperatures Jor <strong>Antarctic</strong> stations over the<br />
period1959-<strong>96</strong>, <strong>and</strong> oJthe temperature trend (slope oJthe linear<br />
regression fit to the annual data) over the period<br />
Station Mean Std dev. Trend Number<br />
qfyears<br />
QC QC QC (100 a ) I<br />
statistic<br />
South Pole --49.4 0.6 - 1.1 36 1.43<br />
Novolazarevskaya - 10.3 0.6 +3.0 34 3.72 (99)<br />
Syowa - 10.5 0.8 + 1.2 32 0.85<br />
Molodezhnaya - 11.0 0.6 - 0.4 33 0.37<br />
Mawson - 11.2 0.8 - 0.8 38 0.82<br />
Davis - 10.2 1.0 +0.5 34 0.36<br />
Mirny - 11.3 0.7 0.0 36 0.08<br />
Vostok - 55.3 0.8 + 1.3 34 1.03<br />
WilkesjCasey - 9.2 1.0 + 3.1 38 2.32 (95)<br />
Dumont d'Urville - 10.7 0.6 + 1.2 38 1.46<br />
Leningradskaya - 14.4 0.7 + 1.7 19 0.59<br />
SCOll - 19.9 1.0 +3.4 36 2.35 (95)<br />
Peninsula 0.0 1.1 +2.4 36 1.58<br />
Ha lley Bay - 18.5 1.0 +0.9 38 0.63<br />
Neumayer - 15.9 0.5 +0.8 13 0.21<br />
SANAE - 16.9 1.0 + 1.2 30 0.59<br />
Notes: Trends to warmer temperatures are indicated by a plus sign, <strong>and</strong> to<br />
cooler temperatures by a minus sign. The t statistic (n - 2 degrees of freedom)<br />
represents significance of the trends over time; trends which are significant<br />
at the 99% or 95% level are shown in parentheses.<br />
• Calculations on a dataset comprising a composite of station temperature<br />
anomali es.<br />
553
Jacka <strong>and</strong> Budd: Temperature <strong>and</strong> sea -ice-extent changes in <strong>Antarctic</strong> <strong>and</strong> <strong>Southern</strong> <strong>Ocean</strong><br />
Table 2. Calculations if mean <strong>and</strong> st<strong>and</strong>ard deviation if the<br />
annual surface temperatures for <strong>Southern</strong> <strong>and</strong> South Pacific<br />
<strong>Ocean</strong> stations over the period <strong>1949</strong>- <strong>96</strong>, <strong>and</strong> if the temperature<br />
trend (slope qf the linear regression fit to the annual<br />
data) over the period<br />
8<br />
6<br />
a<br />
Station<br />
Mean<br />
Std dev.<br />
Trend<br />
Number<br />
qfy ears<br />
statistic<br />
Marion Isl<strong>and</strong><br />
Crozet<br />
Kerguelen<br />
New Amsterdam<br />
Cape Naturaliste<br />
Maatsuyker Isl<strong>and</strong><br />
Macquarie Isl<strong>and</strong><br />
CampbeU Isl<strong>and</strong><br />
Raoul<br />
Chat ham Isl<strong>and</strong><br />
RoraLOnga<br />
Tahiti<br />
R apa<br />
Pitcairn Isl<strong>and</strong><br />
Easter IsI <strong>and</strong><br />
Juan Fern<strong>and</strong>ez<br />
Punta Arenas<br />
Stanley<br />
Signy Isl<strong>and</strong><br />
Orcadas<br />
Crytviken<br />
Cough Isl<strong>and</strong><br />
5.5<br />
5.3<br />
4.7<br />
13.8<br />
16.7<br />
11.2<br />
4.8<br />
7.0<br />
19.0<br />
11.3<br />
24.0<br />
25.9<br />
20.7<br />
20.9<br />
20.6<br />
15.4<br />
6. 1<br />
5.7<br />
- 3.4<br />
- 3.6<br />
2.0<br />
11.6<br />
0.4<br />
0.4<br />
0.4<br />
0.5<br />
0.6<br />
0.4<br />
0.4<br />
0.4<br />
0.3<br />
0.4<br />
0.4<br />
0.4<br />
0.4<br />
0.3<br />
0.4<br />
0.3<br />
0.4<br />
0.3<br />
l.l<br />
1.0<br />
0.4<br />
0.4<br />
+ 2.5<br />
+2.9<br />
+ 1.6<br />
+2.4<br />
+2.3<br />
0.0<br />
+ 1.3<br />
+1.3<br />
+0.2<br />
+0.9<br />
+ 1.4<br />
+ 1.6<br />
+0.7<br />
- 0.5<br />
- 1.2<br />
- 0.5<br />
- 1.0<br />
+0.2<br />
+2.0<br />
+ 1.9<br />
+ 1.3<br />
+0.1<br />
48<br />
20<br />
39<br />
36<br />
47<br />
45<br />
48<br />
46<br />
38<br />
44<br />
42<br />
47<br />
43<br />
29<br />
43<br />
46<br />
47<br />
32<br />
45<br />
46<br />
32<br />
41<br />
8.60 (99)<br />
2.19 (95)<br />
2.89 (95)<br />
3.21 (99)<br />
4.79 (99)<br />
0.23<br />
3.28 (99)<br />
3.55 (99)<br />
0.41<br />
1.95 (95)<br />
3.41 (99)<br />
4.16 (99)<br />
1.47<br />
0.74<br />
3.34 (99)<br />
1.23<br />
2.10 (95)<br />
0.40<br />
170 (95)<br />
1.81 (95)<br />
1.74 (95)<br />
0.21<br />
Notes: Trends to warmer temperatures are indicated by a plus sign, <strong>and</strong> to<br />
cooler temperatures by a minus sign. The t statistic (n-2 degrees of freedam)<br />
represents signjficance of the trends over time; trends which are significant<br />
at the 99% or 95% level are shown in parentheses.<br />
8<br />
6<br />
4<br />
2<br />
-10 -8 -6 -4 -2 0 2 4 6 8 10<br />
b<br />
o +-T"""T"......-H~H"-+;<br />
-10 -8 -6 -4 -2 0 2 4 6 8 10<br />
8<br />
>-<br />
o<br />
6<br />
C<br />
Q)<br />
::J<br />
0-<br />
4<br />
~<br />
U. 2<br />
c<br />
o+-.... ...,...,~<br />
-10 -8 -6 -4 -2 0 2 4 6 8 10<br />
just one record for this region. For the same reason, data<br />
from Scott Base, but not McMurdo Station, are utilised. In<br />
addition, it should be noted that the earlier analysis did not<br />
include the inl<strong>and</strong> stations, South Pole <strong>and</strong> Vostok. The<br />
current analysis does include these stations. With these considerations,<br />
a total of up to 16 <strong>Antarctic</strong> stations are included<br />
in the analyses below for the full period 1959- <strong>96</strong>. For the<br />
ocean isl<strong>and</strong>s, up to 15 <strong>Southern</strong> O cean <strong>and</strong> 7 South Pacific<br />
O cean isl<strong>and</strong>s are included for the full period, <strong>1949</strong>- <strong>96</strong>.<br />
8<br />
6<br />
d<br />
1.1<br />
-10 -8 -6 -4 -2 0 2 4 6 8 10<br />
STATION TEMPERATURE TRENDS<br />
Statistical examination of the temperature data records on<br />
the time domai n reveals that most stations' data continue to<br />
exhibit warming trends similar to those given by Jacka <strong>and</strong><br />
Budd (1991). Details of the calculations for the individual stations<br />
are shown inTable I for the <strong>Antarctic</strong> stations, <strong>and</strong> Table<br />
2 for the <strong>Southern</strong> <strong>and</strong> South Pacific O cean stations. To clarify<br />
the significance of the trends,Jacka <strong>and</strong> Budd presented a<br />
series of histograms for the <strong>Antarctic</strong> stations <strong>and</strong> for the isl<strong>and</strong><br />
stations. That procedure is repeated here, adding a<br />
further histogram for each region, with the data to 19<strong>96</strong>.<br />
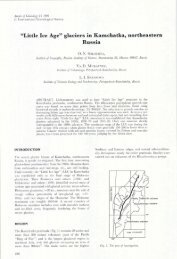
The new histograms (Figs I <strong>and</strong> 2) show the frequencies<br />
of stations with annual mean temperature data exhibiting<br />
different linear regression-line slopes. Regression slopes<br />
were calculated over a series of increasing time periods, beginning<br />
in <strong>1949</strong> for the <strong>Southern</strong> O cean stations, <strong>and</strong> 1959<br />
for the <strong>Antarctic</strong> stations, then adding a further 10 years for<br />
each new calculation up to 1988, <strong>and</strong> then the 8 years from<br />
-10 -8 -6 -4 -2 0 2 4 6 8 10<br />
Slope of regression line, cC (100a)-1<br />
Fig. 1. Histograms showing the frequency qf <strong>Southern</strong> <strong>and</strong><br />
Pacific <strong>Ocean</strong> stations ( Pacific <strong>Ocean</strong> station data shown<br />
hatched) with annual temperature data exhibiting different<br />
linear regression -line slopes. Data periods are (a) <strong>1949</strong>- 58,<br />
(b) <strong>1949</strong>- 68, (c) <strong>1949</strong>- 78, (d) <strong>1949</strong>- 88 <strong>and</strong> (e) <strong>1949</strong>-<br />
<strong>96</strong>. The means qf the regression slopes are indicated.<br />
554
Jacka <strong>and</strong> Budd: Temperature <strong>and</strong> sea-ice-extent changes in <strong>Antarctic</strong> <strong>and</strong> <strong>Southern</strong> <strong>Ocean</strong><br />
8<br />
6<br />
4<br />
a<br />
6.5<br />
For the first 10year period for the ocean isl<strong>and</strong> stations,<br />
the distribution of frequencies about a near-zero regressionline<br />
slope is (as expected) similar to that for a r<strong>and</strong>om<br />
sample of data with no trend. As each 10 years of data is<br />
added, a convergence towards a positive trend develops.<br />
For the <strong>Southern</strong> <strong>and</strong> South Pacific <strong>Ocean</strong> data, particularly<br />
with the addition of the past 8 years, this trend is now<br />
-1 0 -8 -6 -4 -2 0 2 4 6 8 10<br />
Table 3. Changes in mean annual temperature trend, in<br />
QC (100 a) - I, over time, as indicated by means <strong>and</strong> st<strong>and</strong>ard<br />
deviations of the slopes through individual station data, <strong>and</strong><br />
by slopes of regression lines through annual mean anomaly data<br />
8<br />
b<br />
( a) <strong>Southern</strong> <strong>Ocean</strong><br />
station data<br />
<strong>1949</strong>-58 <strong>1949</strong>-68 <strong>1949</strong>-78 <strong>1949</strong>-88 194.9-<strong>96</strong><br />
6<br />
4<br />
2<br />
3.7<br />
Trend of mean anomalies<br />
Mean of station trends<br />
Std dev. of station trends<br />
Number of stations<br />
t statistic<br />
+3.2<br />
+3.5<br />
7.9<br />
18<br />
1.83 (95)<br />
-0.5<br />
- 0.4<br />
2.7<br />
22<br />
0.679<br />
+0.3<br />
+0.6<br />
1.7<br />
22<br />
1.62<br />
+0.8<br />
+ 1.1<br />
1.5<br />
22<br />
3.36 (99)<br />
+0.7<br />
+ 1.0<br />
1.2<br />
22<br />
3.82 (99)<br />
O+T'"""I'~'T""''''''''''''''''<br />
-10 -8 -6 -4 -2<br />
o 2 4 6 8 10<br />
( b) <strong>Antarctic</strong><br />
station da.ta<br />
1959-68 1959-78 1959-88 1959-<strong>96</strong><br />
8<br />
6<br />
c<br />
Trend of mean anomalies<br />
Mean of station trends<br />
Std dev. of station trends<br />
Number of stations<br />
t statistic<br />
+ 7.0<br />
+6.5<br />
7.2<br />
+4.0<br />
+3.7<br />
3.1<br />
+2.7<br />
+2.7<br />
2.2<br />
+0.9<br />
+ 1.2<br />
1.4<br />
14 15 17 16<br />
3.25 (99) 4.47 (99) 4.91 (99) 3.32 (99)<br />
4<br />
2<br />
2.7<br />
Notes: Trends to warmer temperatures are indicated by a plus sign, <strong>and</strong> to<br />
cooler temperatures by a minus sign. The t statistic (n - 1 degrees of freedom)<br />
represents significance of the mean of the trends; means which are<br />
significant at the 99% or 95% level are shown in parentheses.<br />
o +-............................ -r-r-<br />
8<br />
6<br />
4<br />
2<br />
-10 -8 -6 -4 -2 0 2 4 6 8 10<br />
d<br />
1.2<br />
o +-......... ....,...... .......... "'T"""r-<br />
-10 -8 -6 -4 -2 0 2 4 6 8 10<br />
Slope of regression line, QC (100a)-1<br />
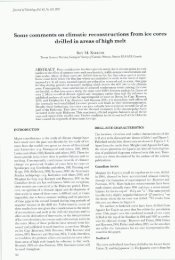
Fig. 2. Histograms showing the frequency of <strong>Antarctic</strong> stations<br />
with annual temperature data exhibiting different linear<br />
regression-line slopes. Data periods are (a) 1959-68, (b)<br />
1959-78, (c) 1959- 88 <strong>and</strong> ( d) 1959- <strong>96</strong>. The means if the<br />
regression slopes are indicated.<br />
1989- <strong>96</strong> for the final calculations. Summaries of the mean<br />
trends <strong>and</strong> their st<strong>and</strong>ard deviations are given in Table 3<br />
along with the regression slopes of the mean anomalies discussed<br />
below.<br />
more firmly established. The mean trend for these stations is<br />
l.O°e (100 a r l with a st<strong>and</strong>ard deviation of 1.2°e (100 a r l<br />
Jacka <strong>and</strong> Budd's (1991) estimate of the mean trend was<br />
0.8°C (100 a r \ but the figure for the period up to 1988 is revised<br />
here to l.l °C (lOO a r l as a result of additional data<br />
now available. The hatched areas of these histograms represent<br />
the South Pacific <strong>Ocean</strong> data. While the mean of<br />
these data is not significantly different from that for the<br />
ocean isl<strong>and</strong> data as a whole, we note that every station bar<br />
one exhibiting a cooli ng trend is a South Pacific <strong>Ocean</strong> station.<br />
The geographical distribution of the trends is discussed<br />
in more detail below.<br />
For the <strong>Antarctic</strong> stations, the mean of the regression<br />
slopes to 19<strong>96</strong> indicates a warming trend of 1.2°e (100 ar l<br />
with a st<strong>and</strong>ard deviation of 1.4°e (100 a r l. J acka <strong>and</strong> Budd<br />
(1991) calculated a mean warming trend for the period up to<br />
1988 of 2.8°C (100 ar l. The <strong>Antarctic</strong> data are more variable<br />
than the <strong>Southern</strong> <strong>Ocean</strong> data, <strong>and</strong> the trend is not as<br />
well established as that for the <strong>Southern</strong> <strong>Ocean</strong>, since the<br />
range of the slopes is greater. The decrease in mean slope<br />
from the earlier estimate [or the <strong>Antarctic</strong> data is partly<br />
due to a sharp decrease in the trend, beginning in 1991, with<br />
lower temperatures persisting for about 4 years. We attribute<br />
this to the volcanic eruption or Mount Pinatubo, <strong>and</strong><br />
possibly Mount Hudson in South America in 1991. Mount<br />
Pinatubo i~ected ",20 Mt of sulphur dioxide into the stratosphere<br />
(Bluth <strong>and</strong> others, 1992) <strong>and</strong> has been linked to<br />
decreased areas o[ melt <strong>and</strong> decreased mean annual temperatures<br />
on the Greenl<strong>and</strong> ice sheet (Abdalati <strong>and</strong> Steffen,<br />
555
Jacka <strong>and</strong> Budd: Temperature <strong>and</strong> sea-ice-extent changes in <strong>Antarctic</strong> <strong>and</strong> <strong>Southern</strong> <strong>Ocean</strong><br />
1997) <strong>and</strong> to changes in global mean temperature (Houghton<br />
<strong>and</strong> others, 19<strong>96</strong>).<br />
When individual stations are considered separately, the<br />
trends for most stations, as indicated by the regression-line<br />
slopes through the annual means, are not significant. The<br />
significance of the difference of the trends from zero may<br />
be represented by the Student's t statistic with n - 2 degrees<br />
of freedom, given by<br />
t=b<br />
where x is the long-term mean temperature, Xi are the individual<br />
annual temperatures, b is the regression-line slope,<br />
<strong>and</strong> n is the number of years, Yi, for which data are included.<br />
The values of this t statistic are listed inTables 1 <strong>and</strong> 2. Seven<br />
<strong>Southern</strong> <strong>Ocean</strong> stations exhibit warming trends significant<br />
at the 99% level, <strong>and</strong> a further six exhibit warming trends<br />
significant at the 95% level. Easter Isl<strong>and</strong> <strong>and</strong> Punta<br />
Arenas exhibit cooling trends, significant at the 99% <strong>and</strong><br />
95 % levels, respectively. Of the <strong>Antarctic</strong> stations, Novolazarevskaya<br />
exhibits a warming trend significant at the 99%<br />
level, while Casey <strong>and</strong> Scott exhibit warming trends significant<br />
at the 95 % level.<br />
The mean of the station trends, however, is much more<br />
significant, <strong>and</strong> is becoming more highly significant over<br />
time, so that the <strong>Southern</strong> <strong>Ocean</strong> station data trends are<br />
now as clearly significant as the <strong>Antarctic</strong> data trends. The<br />
significance of the difference from zero of the group mean, x<br />
(over all n stations <strong>and</strong> with sample st<strong>and</strong>ard deviation, s),<br />
of the regression slopes may be represented by the t statistic<br />
with n - 1 degrees of freedom, given by<br />
x..)(n - 1)<br />
t= .<br />
S<br />
The t values (Table 3) show that the mean trends up to recent<br />
times are highly significant in spite of the recent downturn<br />
for the <strong>Antarctic</strong> stations after the Pinatubo eruption.<br />
Using data up to 1994 in a similar study to the one outlined<br />
here, Jones (1995) noted that most of the warming<br />
trend for the <strong>Antarctic</strong> stations occurred during the first<br />
half of the time period, i.e. from 1957 to the early 1970s.<br />
Although this is true, the present results indicate that some<br />
warming has continued at a lower rate through the second<br />
half of the record, <strong>and</strong> the warming trend over the whole<br />
record has maintained its high significance even up to the<br />
most recent period. The high interannual <strong>and</strong> multi-year<br />
variability gives rise to large variability in shorter-term<br />
trends. Also, as mentioned above, the reductions in mean<br />
temperature after 1991 contributed substantially to the<br />
decreased trend of the later half of the record. 10 clarify this,<br />
the trends for the different periods of the mean <strong>Antarctic</strong><br />
temperature anomalies were 6.4°C (100 a ) I for 1957- 75,<br />
3.2°C (lOO a r l for 1976- 91 <strong>and</strong> 0.4°C (100 a r l for 1976- <strong>96</strong><br />
compared with the trend for the whole period (1957- <strong>96</strong>) of<br />
1.2 °C (100 a f '. This latter, longer-term trend is more significant<br />
than the trends for the shorter periods <strong>and</strong> is considered<br />
to be the more robust indicator of the average longterm<br />
trend for the <strong>Antarctic</strong> continent.<br />
SEA-ICE-EXTENT TREND<br />
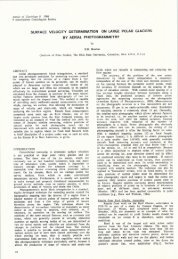
Figure 3 shows a histogram of the frequencies of longitudes<br />
(based on a total of3610ngitudes at 10° intervals) with mean<br />
annual sea-ice-extent data exhibiting different regressionline<br />
slopes. These data are from the U.S. avy- National<br />
<strong>Ocean</strong>ic <strong>and</strong> Atmospheric AdministrationJoint Ice Center<br />
UIC) weekly ice charts (one map is chosen per month) <strong>and</strong><br />
cover the period 1973- <strong>96</strong>. There is a wide distribution (from<br />
- 6° to +4° lat. (100 a r l) of trends of sea-ice change, but the<br />
mean trend over this period is near zero. As noted below,<br />
the four 10° longitude locations exhibiting high negative<br />
slopes (i.e increased sea-ice extent) are from one sectol~<br />
while the six with high positive slopes (i.e decreased sea-ice<br />
extent) are from another. Apart from these two sectors of<br />
clear advance <strong>and</strong> retreat, the sea-ice-extent trends over<br />
the satellite era are small.<br />
TRENDS OF THE MEAN ANOMALY DATA<br />
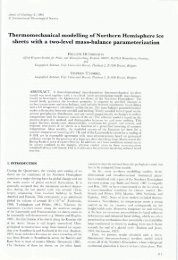
Figure 4 shows the time series for the means, across all stations,<br />
of the annual temperature anomalies for the <strong>Southern</strong><br />
<strong>and</strong> South Pacific <strong>Ocean</strong> stations <strong>and</strong> for the <strong>Antarctic</strong> stations,<br />
<strong>and</strong>, across all longitudes, the annual mean latitude<br />
8<br />
6<br />
4<br />
2<br />
o -+-',...........-fIII....J<br />
-10 -8 -6 -4 -2 0 2 4 6 8 10<br />
Slope of regression line, °lat (1 OOa)-1<br />
Fig. 3. Histogram showing the frequency qf locations (qf<br />
36 x 10° longitudinal intervals) with annual sea-ice-extent<br />
data over time exhibiting different linear regression-line<br />
slopes. The data period is 1973- <strong>96</strong>. The mean qf the regression<br />
slopes is indicated. A positive regression slope indicates a<br />
trend towards higher latitudes or less sea ice.<br />
from the sea-ice-extent data. Only stations with records<br />
longer than 14 years are considered, <strong>and</strong> the annual anomalies<br />
for each station are taken from their long-term average.<br />
This allows the combination of anomalies for all stations<br />
available in individual years to give group mean annual<br />
anomalies, even though some stations may not be included<br />
in the mean change over some part of the record. The<br />
decrease in temperatures in the period 1991 - 93 for the <strong>Antarctic</strong><br />
stations, attributed above to the Mount Pinatubo<br />
eruption, is immediately clear. It can be seen also that the<br />
temperatures by 19<strong>96</strong> appear to have "recovered" from the<br />
Pinatubo effect. Although the <strong>Southern</strong> <strong>Ocean</strong> temperatures<br />
show no clear Pinatubo effect, there is some evidence of<br />
increased sea ice in the 4 years immediately after the eruption.<br />
The next few years will be particularly important for<br />
monitoring the trend in these parameters "post-Pinatubo".<br />
For the <strong>Southern</strong> <strong>Ocean</strong> mean temperature anomaly<br />
data the regression slope indicates a warming trend of<br />
O.7°C (lOO a r l , <strong>and</strong> for the corresponding <strong>Antarctic</strong> data a<br />
556
Jacka <strong>and</strong> Budd: Temperature <strong>and</strong> sea-ice-extent changes in <strong>Antarctic</strong> <strong>and</strong> <strong>Southern</strong> <strong>Ocean</strong><br />
0<br />
0<br />
Q)<br />
....<br />
:J<br />
-ctl<br />
....<br />
1.0<br />
0.0<br />
Q)<br />
c..<br />
E<br />
Q)<br />
-1 .0<br />
~<br />
61<br />
...•<br />
•<br />
••• •<br />
(j)<br />
0<br />
62 • •<br />
Q)<br />
"0 •<br />
:J<br />
•<br />
-:p<br />
ctI<br />
63<br />
Q)<br />
•<br />
0)<br />
"0<br />
Q)<br />
Q)<br />
.2<br />
ctI<br />
Q)<br />
(j)<br />
0<br />
0<br />
Q)<br />
....<br />
:J<br />
-ctl<br />
....<br />
Q)<br />
c..<br />
E<br />
Q)<br />
~<br />
64<br />
•<br />
65 •<br />
• b<br />
66<br />
1.0<br />
0.0<br />
-1.0<br />
-2.0 C<br />
1950 1<strong>96</strong>0 1970 1980 1990 2000<br />
Year<br />
Fig. 4. M ean across alllongitudes qf (a) <strong>Southern</strong> <strong>and</strong> South<br />
Pacific <strong>Ocean</strong> station mean temperature anomalies, (b)<br />
annual sea-ice extent <strong>and</strong> (c) coastal <strong>Antarctic</strong> station mean<br />
temperature anomalies. The dots superimposed on the sea-iceextent<br />
curve are from estimates based on southemmost positions<br />
qf whaling-Jactory ships (after de la Mare, 1997).<br />
a<br />
r2 = 0.88 between the data derived from the whaling<br />
records <strong>and</strong> the sea-ice positions reported by the Discovery<br />
expeditions.<br />
While there is not a strong correlation between the de la<br />
Mare data <strong>and</strong> theJIe data on an annual basis, Figure 4<br />
does confirm that the data derived from whaling observations<br />
during the period 1973- 87 are within 0.5° lat. of the<br />
JIe data. Given that the whaling-based data are compiled<br />
from observations from O ctober to April only <strong>and</strong> that they<br />
are not evenly distributed around the <strong>Antarctic</strong> continent, it<br />
is not surprising that a stronge r correlation with the annual<br />
satellite data is not found.<br />
With the addition of the whaling-based data, we can conclude<br />
that there appears to have been a significant decrease<br />
in sea-ice area over our period of interest here (<strong>1949</strong>-<strong>96</strong>),<br />
highlighted by an apparent marked drop in ice extent<br />
between the early 1950s <strong>and</strong> the mid-1970s (de la Mare<br />
1997), but very little net change since then. The observation<br />
of a decrease in duration of fast ice at Signy <strong>and</strong> Laurie<br />
Isl<strong>and</strong>s over the period 1930 to the mid-1950s (Murphy <strong>and</strong><br />
others, 1995) would seem also to be compatible with a<br />
decrease in sea-ice area in the Weddell Sea region over that<br />
period.<br />
SEASONAL TRENDS<br />
The mean trends for the different seasons (summer: December-February;<br />
autumn: M arch- M ay; winter: June-August;<br />
spring: September-November ), as well as the annual mean<br />
trends, are given inTable 4. Results are shown for the means<br />
of the individual regression slopes <strong>and</strong> for the regressions of<br />
the mean anomalies. The relative seasonal variations from<br />
these different regressions are similar.<br />
lilble 4. Trends qf seasonal <strong>and</strong> annual mean temperature, in<br />
o C (lOO a) I, <strong>and</strong> sea-ice extent, in 0 lat. (lOO a) - I, calculated<br />
from (a) the means qf the slopes through individual station<br />
data, <strong>and</strong> ( b) slopes rif regression lines through annual mean<br />
anomaly data<br />
(a) Means if regression slopes Summer Autumn JI 'inter Spring Annual<br />
warming trend of 0.9°e (100 a) I. These trends (summarised<br />
in Table 4) are slightly less than those indicated by<br />
taking the means of the slopes of the regression lines for the<br />
individual station datasets. For the sea-ice-extent data, the<br />
trend of the mean data is to 0.2 ° lat. (100 ar l more sea ice<br />
(cf. zero trend for the mean of the individual trends).<br />
In Figure 4, we have added to the sea-ice-extent plot<br />
data of the latitude of the southern most whale-factory-ship<br />
positions (after de la Mare, 1997) for the period 1946- 87. For<br />
these data for the period 1973- 87, de la Mare reports a mean<br />
latitude of 64.3° S. The JIe sea-ice-extent data indicate a<br />
mean annual latitude of 64.2° S. The datasets are overlain<br />
in Figure 4 with the mean for the satellite era at 64.3 ° S.<br />
The de la Mare data were derived from the positions of<br />
whaling-factory ships which were stationed near the sea-ice<br />
edge, an area of high biological activity. De la M are argued<br />
that these data are a good proxy for sea-ice extent, <strong>and</strong>, for<br />
the months (mid-October to mid-April) covered by his<br />
data, he obtained a high correlation with theJIe sea-iceedge<br />
data for the period 1973 to 1986-87 of r2 = 0.832. For<br />
the period 1932- 39, de la Mare found a correlation of<br />
<strong>Antarctic</strong> +0.9 - 0.7 + 2.1 + l.0 + l.2<br />
<strong>Southern</strong> <strong>Ocean</strong> +0.7 + l.4 + l.0 +0.5 + l.0<br />
Peninsula +2.1 +2.7 +4.5 +0.4 +2.4<br />
Sea-ice latilUde +0.2 +0.4 +0.2 - 0.4 0.0<br />
(h) Regression slope if Summer Autumn Winter Spring Annual<br />
mean anomaly data<br />
<strong>Antarctic</strong> +0.6 - 0.2 + 2.6 +0.9 + 0.9<br />
<strong>Southern</strong> <strong>Ocean</strong> +0.4 + l.0 + 0.7 + 0.4 + 0.7<br />
Peninsula +2.1 +2.1 + 3.5 0.0 +2.+<br />
Sea-ice latitude +0.2 +0.4 + 0.1 - 0.4 - 0.2<br />
Notes: Trends to wanner temperatures are indicated by a plus sign, <strong>and</strong> to<br />
cooler temperatures by a minus sign. Trends to greater sea-ice latitude (i. e.<br />
to less extensive ice cover) are indicated by a plus sign, a nd to lesser sea-ice<br />
latitude (more extensive ice cover) by a minus sign.<br />
The means for the group of <strong>Antarctic</strong> Peninsula stations<br />
are also shown since they show a consistent regional rate of<br />
change more than twice the average for the total of the <strong>Antarctic</strong><br />
stations. It is worth noting, however, that a few other<br />
individual <strong>Antarctic</strong> stations (e.g. Novolazarevskaya,<br />
557
Jacka <strong>and</strong> Budd: Temperature <strong>and</strong> sea-ice-extent changes in <strong>Antarctic</strong> <strong>and</strong> <strong>Southern</strong> <strong>Ocean</strong><br />
Casey, Scott) exhibit warming trends greater than the mean<br />
Peninsula trend (see Table 1).<br />
For the <strong>Antarctic</strong> stations, the warming trends are largest<br />
in winter <strong>and</strong> smallest in autumn. For the <strong>Southern</strong><br />
<strong>Ocean</strong> stations, the trends are largest in autumn <strong>and</strong> smallest<br />
in spring <strong>and</strong> summer. The sea-ice changes show a small<br />
trend towards an increase in spring, with decreases in the<br />
other seasons, the largest being in autumn. The relative<br />
seasonal trends for the <strong>Antarctic</strong> Peninsula stations as a<br />
group are more like those of the <strong>Southern</strong> <strong>Ocean</strong> stations<br />
than those of the other <strong>Antarctic</strong> stations.<br />
with the addition of the past 8 years of data (Molodezhnaya:<br />
0.4°C (100 a f l; Mawson 0.8°C (100 a f l).<br />
For the <strong>Southern</strong> <strong>Ocean</strong> isl<strong>and</strong>s, Jacka <strong>and</strong> Budd (1991)<br />
noted that every station displayed a warming trend, while a<br />
cooling trend was exhibited only by the South Pacific isl<strong>and</strong><br />
stations included in the dataset. With the addition of the past<br />
8 years of data, the western Pacific <strong>Ocean</strong> stations are now<br />
trending ("'+ l.O°C (lOO af l) to warmer temperatures,<br />
while the eastern Pacific isl<strong>and</strong>s <strong>and</strong> Punta Arenas are<br />
trending (-0.5° to - LOoC (100 a f l) to cooler temperatures.<br />
The eastern Pacific region is now the only sector of the isl<strong>and</strong>s<br />
record still displaying a cooling.<br />
The geographical distribution of the sea-ice-extent<br />
trends is noteworthy. While the mean trend is zero, the sector<br />
0- 40° east of the Weddell Sea has a clear trend towards<br />
increased sea ice. This is matched by a large sector of decreasing<br />
extent around the South Pacific sector of the West<br />
<strong>Antarctic</strong> coast, near the Bellingshausen <strong>and</strong> Amundsen<br />
Seas from about 65° to 160° W. Elsewhere, the sea-ice-extent<br />
trends are relatively small.<br />
DISCUSSION AND CONCLUSIONS<br />
Fig. 5. The slopes if regression lines through the annual mean<br />
temperature data for each station are plotted for <strong>Antarctic</strong><br />
coastal stations about the inner circle <strong>and</strong> for <strong>Southern</strong> <strong>and</strong><br />
Pacific <strong>Ocean</strong> inl<strong>and</strong> stations about the outer circle. The<br />
slopes if regression lines through the annual mean sea-iceextent<br />
data (for the period 1973- <strong>96</strong>) at each 10° if longitude<br />
are plotted about the middle circle. The scale indicates 0-<br />
5°C (100 aT J for the temperatures, <strong>and</strong> 0-5° tat. (100 aT '<br />
jor the sea-ice extent. Sectors exhibiting a warming trend,<br />
<strong>and</strong> sectors exhibiting a reduced sea-ice extent are indicated<br />
by shading, <strong>and</strong> the opposite changes by hatching.<br />
GEOGRAPHICAL DISTRIBUTION OF TRENDS<br />
Figure 5 is a revision of Jack a <strong>and</strong> Budd's (1991) figure 8. It<br />
presents a plot of the slopes of the regression lines through<br />
the time series of annual mean temperature data for each<br />
station, plotted at the longitude of the station. Coastal <strong>Antarctic</strong><br />
stations are plotted about the inner circle, <strong>and</strong> <strong>Southern</strong><br />
<strong>and</strong> South Pacific <strong>Ocean</strong> stations about the outer circle.<br />
The sea-ice-extent slopes are plotted about the middle circle.<br />
Mawson <strong>and</strong> Molodezhnaya, neighbouring stations in<br />
East <strong>Antarctic</strong>a, are the only coastal <strong>Antarctic</strong> stations sti ll<br />
displaying a cooling trend. We have suggested earlier Uacka<br />
<strong>and</strong> Budd, 1991) that these two stations may be affected by<br />
increased air Oow from the cold interior, as indicated by<br />
the analysis of seasonal pressure anomalies Uones <strong>and</strong> Wigley,<br />
1988). Even at these two stations, however, the trends to<br />
cooler conditions have become smaller <strong>and</strong> less significant<br />
Addition of the 8 years of data from 1989- <strong>96</strong> results in little<br />
change in the mean warming trend (0.8- LO oe (100 a) I) for<br />
the isl<strong>and</strong> stations, but a slight reduction in the st<strong>and</strong>ard<br />
deviation of the trends from 1.5° to 1.2 °C (100 a) I. The<br />
western Pacific <strong>Ocean</strong> stations now exhibit a warming<br />
trend, whi le the eastern Pacific stations <strong>and</strong> Punta Arenas<br />
exhibit a cooling trend. There is little effect on the <strong>Southern</strong><br />
<strong>Ocean</strong> isl<strong>and</strong> annual mean temperatures from the eruption<br />
of Mount Pinatubo, with a < 0.3 °C departure below the<br />
mean regression-line trend, somewhat smaller than the<br />
global departures given by the IPCC (Houghton <strong>and</strong><br />
others, 19<strong>96</strong>, fig. 5.20). However, the eruption seems to have<br />
had a more significant effect on the trends for the <strong>Antarctic</strong><br />
stations. The mean <strong>Antarctic</strong> temperature shows a decrease<br />
of '" I °C immediately following the eruption, <strong>and</strong> it has<br />
taken about 4 years for the mean annual temperature to "recover"<br />
to the pre-Pinatubo values. It will be important to<br />
monitor the <strong>Antarctic</strong> temperatures over the next few years<br />
to establish the new post-Pinatubo trend. The warming calculated<br />
from the mean of the individual trends for the <strong>Antarctic</strong><br />
stations for the data up till 1988 was +2.rC (100 af l.<br />
The corresponding mean trend for the 1959- <strong>96</strong> data has<br />
been lowered to + 1.2°C (100 ar l. The st<strong>and</strong>ard deviations<br />
of the regression slopes for the two periods were 2.2° <strong>and</strong><br />
l.4°e (100 a)- I, respectively. The trend of the annual mean<br />
temperature deviations changed from +2.7°e (100 a f l for<br />
data to 1988 to +0.9°C (100 a f l for data to 19<strong>96</strong>. Thus there<br />
appears to be a convergence of these trends with the longer<br />
record, along with a reduction in the st<strong>and</strong>ard deviations of<br />
the trends across the stations. The decrease in the mean of<br />
the regressions appears to be largely a consequence of the<br />
lower post-eruption temperatures. Despite the effects of Pinatubo,<br />
we still see a tendency for all the stations to exhibit a<br />
similar trend, with only two stations exhibiting a cooli ng;<br />
but even for these, the cooling trend is smaller than in the<br />
previous analysis, <strong>and</strong> is now only - 0.4° to - O.8°C (100 a f l.<br />
The sea-ice dataset from the satellite era, now extended<br />
to include 1973-<strong>96</strong>, shows no significant overall trend. In the<br />
1991 analysis, we found a small trend to decreased extent.<br />
There has, however, been a trend towards increased sea ice<br />
558
Jacka <strong>and</strong> Budd: Temperature <strong>and</strong> sea-ice-extent changes in <strong>Antarctic</strong> <strong>and</strong> <strong>Southern</strong> <strong>Ocean</strong><br />
over the past 5 years, possibly in response to the <strong>Antarctic</strong><br />
cooling as a consequence of the Pinatubo eruption. The<br />
trend to less sea ice over the period 1973- 88 had been due<br />
in part to relatively extensive ice extent, as indicated by the<br />
JIC charts, in 1973 <strong>and</strong> 1974. The reliability of these data has<br />
been questioned by H.J. Zwally (personal communication,<br />
1997). On the other h<strong>and</strong>, these 1973 <strong>and</strong> 1974 data agree<br />
reasonably well with data now available from the positions<br />
of the factory whaling ships (de la Mare, 1997). T he agreement<br />
between the sea-ice edge <strong>and</strong> the position of whaling<br />
ships for theJIC era is encouraging <strong>and</strong> provides some confidence<br />
that the earlier data from the whaling-ship positions<br />
are reasonable proxies for the sea-ice extent. In this case, (i)<br />
the 1973 <strong>and</strong> 1974 data would seem to be validated, <strong>and</strong> (ii )<br />
there was an apparent marked decrease (of ~2 ° lat.) in the<br />
sea-ice extent in ~30 years from the mid-1940s. vVith these<br />
new data, further work is now required to establish relationships<br />
between climatic patterns <strong>and</strong> sea-ice-extent changes.<br />
In particular, it may become possible to examine the time<br />
series of changes for different longitudes in order to ascertain<br />
whether the changes have been systematically distributed<br />
around the <strong>Southern</strong> <strong>Ocean</strong>. The evidence from the<br />
1973- <strong>96</strong> sea-ice-extent data is that some sectors (the Atlantic)<br />
have exhibited more extensive sea ice, while fo r others<br />
(the eastern Pacific ) the extent has decreased. By combining<br />
the archived climatic data for sea ice, atmosphere <strong>and</strong><br />
ocean with modelling it may become possible to determine<br />
the interrelationships between the sea-ice <strong>and</strong> temperature<br />
changes.<br />
REFERENCES<br />
Abdalati, W. <strong>and</strong> K. Stcffen. 1997. The apparent effects of the Mt. Pinatubo<br />
eruption on the Greenl<strong>and</strong> ice-sheet melt extent. Geophys. Res. Lett. ,<br />
24(14), 1795- 1797.<br />
Bluth, G.]. S. , S. D. Doiron, C. C. Schnetzler, A.]. Krueger <strong>and</strong> L. S. Wa I<br />
ter. 1992. Globallracking of [he S02 clouds from theJune, 1991 Mount<br />
Pinatubo eruptions. Geoph)!s. Res. Lett., 19 (2), 151- 154.<br />
Budd, W. F. 1975. <strong>Antarctic</strong> sea-ice variations from satellite sensing in relati<br />
on to climate. ] Glacial. , 15 (73), 417- 427.<br />
De la Mare, W. K. 1997. Abrupt mid-twentieth century decli ne in <strong>Antarctic</strong><br />
sea-ice extent from whaling records. Nature, 389(6646), 57- 61.<br />
Houghton,]. T , L. G. M . Fi lho, B. A. CaJl<strong>and</strong>er, N. Harris, A. K attenberg<br />
<strong>and</strong> K. Maskell, eds .. 19<strong>96</strong>. CLimate change 1995: the science if climate change.<br />
Cambridge, etc. , Cambridge University Press.<br />
Jacka, T. H. 1990. <strong>Antarctic</strong> <strong>and</strong> <strong>Southern</strong> <strong>Ocean</strong> sea-ice <strong>and</strong> climate trends.<br />
Ann. Glacial. , 14, 127- 130.<br />
J acka, T H. <strong>and</strong> W. F. Budd. 1991. Detecti on of tcmpcrature <strong>and</strong> sea ice extent<br />
changes in the <strong>Antarctic</strong> <strong>and</strong> <strong>Southern</strong> <strong>Ocean</strong>. [nvVell er, G., C. L.<br />
vVil son <strong>and</strong> B. A. B. Severin, eds. international Conference on the Role,!! the<br />
PoLar Regions in Global Change: proceedings,!! a conference held ]une 1/- 15,<br />
1990 at the University if ALaska Fairbanks. Vo!. f. Fairbanks, AK, University<br />
of Alaska. Geophysical Institute/Center for Global Change <strong>and</strong> Arctic<br />
System Research, 63-70.<br />
J ones, P. D. 1995. Recent vari ations in mean temperature <strong>and</strong> the diurnal<br />
temperature range in the <strong>Antarctic</strong>. Geoph)ls. Res. Lell., 22 (11), 1345-1348.<br />
Jones, P. D. <strong>and</strong> T M. L. Wigley. 1988. <strong>Antarctic</strong> grided sea level pressure data:<br />
an analysis <strong>and</strong> reconstruction back to 1957. ] Climate, I (12), 1199- 1220.<br />
Murphy, E.]., A. Clarke, C. Symon <strong>and</strong>]. Priddle. 1995. Temporal variation<br />
in <strong>Antarctic</strong> sea-ice: analysis of a long term fa st-ice record from the<br />
South Orkney Isl<strong>and</strong>s. Deep -Sea Res. , 42 (7), Part I, 1045- 1062.<br />
559