Antarctic and Southern Ocean, 1949-96 - International Glaciological ...
Antarctic and Southern Ocean, 1949-96 - International Glaciological ...
Antarctic and Southern Ocean, 1949-96 - International Glaciological ...

Create successful ePaper yourself
Turn your PDF publications into a flip-book with our unique Google optimized e-Paper software.
Jacka <strong>and</strong> Budd: Temperature <strong>and</strong> sea -ice-extent changes in <strong>Antarctic</strong> <strong>and</strong> <strong>Southern</strong> <strong>Ocean</strong><br />
Table 2. Calculations if mean <strong>and</strong> st<strong>and</strong>ard deviation if the<br />
annual surface temperatures for <strong>Southern</strong> <strong>and</strong> South Pacific<br />
<strong>Ocean</strong> stations over the period <strong>1949</strong>- <strong>96</strong>, <strong>and</strong> if the temperature<br />
trend (slope qf the linear regression fit to the annual<br />
data) over the period<br />
8<br />
6<br />
a<br />
Station<br />
Mean<br />
Std dev.<br />
Trend<br />
Number<br />
qfy ears<br />
statistic<br />
Marion Isl<strong>and</strong><br />
Crozet<br />
Kerguelen<br />
New Amsterdam<br />
Cape Naturaliste<br />
Maatsuyker Isl<strong>and</strong><br />
Macquarie Isl<strong>and</strong><br />
CampbeU Isl<strong>and</strong><br />
Raoul<br />
Chat ham Isl<strong>and</strong><br />
RoraLOnga<br />
Tahiti<br />
R apa<br />
Pitcairn Isl<strong>and</strong><br />
Easter IsI <strong>and</strong><br />
Juan Fern<strong>and</strong>ez<br />
Punta Arenas<br />
Stanley<br />
Signy Isl<strong>and</strong><br />
Orcadas<br />
Crytviken<br />
Cough Isl<strong>and</strong><br />
5.5<br />
5.3<br />
4.7<br />
13.8<br />
16.7<br />
11.2<br />
4.8<br />
7.0<br />
19.0<br />
11.3<br />
24.0<br />
25.9<br />
20.7<br />
20.9<br />
20.6<br />
15.4<br />
6. 1<br />
5.7<br />
- 3.4<br />
- 3.6<br />
2.0<br />
11.6<br />
0.4<br />
0.4<br />
0.4<br />
0.5<br />
0.6<br />
0.4<br />
0.4<br />
0.4<br />
0.3<br />
0.4<br />
0.4<br />
0.4<br />
0.4<br />
0.3<br />
0.4<br />
0.3<br />
0.4<br />
0.3<br />
l.l<br />
1.0<br />
0.4<br />
0.4<br />
+ 2.5<br />
+2.9<br />
+ 1.6<br />
+2.4<br />
+2.3<br />
0.0<br />
+ 1.3<br />
+1.3<br />
+0.2<br />
+0.9<br />
+ 1.4<br />
+ 1.6<br />
+0.7<br />
- 0.5<br />
- 1.2<br />
- 0.5<br />
- 1.0<br />
+0.2<br />
+2.0<br />
+ 1.9<br />
+ 1.3<br />
+0.1<br />
48<br />
20<br />
39<br />
36<br />
47<br />
45<br />
48<br />
46<br />
38<br />
44<br />
42<br />
47<br />
43<br />
29<br />
43<br />
46<br />
47<br />
32<br />
45<br />
46<br />
32<br />
41<br />
8.60 (99)<br />
2.19 (95)<br />
2.89 (95)<br />
3.21 (99)<br />
4.79 (99)<br />
0.23<br />
3.28 (99)<br />
3.55 (99)<br />
0.41<br />
1.95 (95)<br />
3.41 (99)<br />
4.16 (99)<br />
1.47<br />
0.74<br />
3.34 (99)<br />
1.23<br />
2.10 (95)<br />
0.40<br />
170 (95)<br />
1.81 (95)<br />
1.74 (95)<br />
0.21<br />
Notes: Trends to warmer temperatures are indicated by a plus sign, <strong>and</strong> to<br />
cooler temperatures by a minus sign. The t statistic (n-2 degrees of freedam)<br />
represents signjficance of the trends over time; trends which are significant<br />
at the 99% or 95% level are shown in parentheses.<br />
8<br />
6<br />
4<br />
2<br />
-10 -8 -6 -4 -2 0 2 4 6 8 10<br />
b<br />
o +-T"""T"......-H~H"-+;<br />
-10 -8 -6 -4 -2 0 2 4 6 8 10<br />
8<br />
>-<br />
o<br />
6<br />
C<br />
Q)<br />
::J<br />
0-<br />
4<br />
~<br />
U. 2<br />
c<br />
o+-.... ...,...,~<br />
-10 -8 -6 -4 -2 0 2 4 6 8 10<br />
just one record for this region. For the same reason, data<br />
from Scott Base, but not McMurdo Station, are utilised. In<br />
addition, it should be noted that the earlier analysis did not<br />
include the inl<strong>and</strong> stations, South Pole <strong>and</strong> Vostok. The<br />
current analysis does include these stations. With these considerations,<br />
a total of up to 16 <strong>Antarctic</strong> stations are included<br />
in the analyses below for the full period 1959- <strong>96</strong>. For the<br />
ocean isl<strong>and</strong>s, up to 15 <strong>Southern</strong> O cean <strong>and</strong> 7 South Pacific<br />
O cean isl<strong>and</strong>s are included for the full period, <strong>1949</strong>- <strong>96</strong>.<br />
8<br />
6<br />
d<br />
1.1<br />
-10 -8 -6 -4 -2 0 2 4 6 8 10<br />
STATION TEMPERATURE TRENDS<br />
Statistical examination of the temperature data records on<br />
the time domai n reveals that most stations' data continue to<br />
exhibit warming trends similar to those given by Jacka <strong>and</strong><br />
Budd (1991). Details of the calculations for the individual stations<br />
are shown inTable I for the <strong>Antarctic</strong> stations, <strong>and</strong> Table<br />
2 for the <strong>Southern</strong> <strong>and</strong> South Pacific O cean stations. To clarify<br />
the significance of the trends,Jacka <strong>and</strong> Budd presented a<br />
series of histograms for the <strong>Antarctic</strong> stations <strong>and</strong> for the isl<strong>and</strong><br />
stations. That procedure is repeated here, adding a<br />
further histogram for each region, with the data to 19<strong>96</strong>.<br />
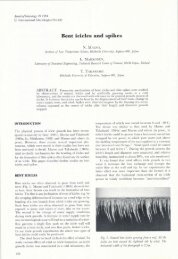
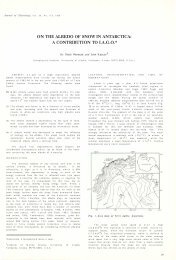
The new histograms (Figs I <strong>and</strong> 2) show the frequencies<br />
of stations with annual mean temperature data exhibiting<br />
different linear regression-line slopes. Regression slopes<br />
were calculated over a series of increasing time periods, beginning<br />
in <strong>1949</strong> for the <strong>Southern</strong> O cean stations, <strong>and</strong> 1959<br />
for the <strong>Antarctic</strong> stations, then adding a further 10 years for<br />
each new calculation up to 1988, <strong>and</strong> then the 8 years from<br />
-10 -8 -6 -4 -2 0 2 4 6 8 10<br />
Slope of regression line, cC (100a)-1<br />
Fig. 1. Histograms showing the frequency qf <strong>Southern</strong> <strong>and</strong><br />
Pacific <strong>Ocean</strong> stations ( Pacific <strong>Ocean</strong> station data shown<br />
hatched) with annual temperature data exhibiting different<br />
linear regression -line slopes. Data periods are (a) <strong>1949</strong>- 58,<br />
(b) <strong>1949</strong>- 68, (c) <strong>1949</strong>- 78, (d) <strong>1949</strong>- 88 <strong>and</strong> (e) <strong>1949</strong>-<br />
<strong>96</strong>. The means qf the regression slopes are indicated.<br />
554