Forma # 1.ai - ICAB
Forma # 1.ai - ICAB
Forma # 1.ai - ICAB

Create successful ePaper yourself
Turn your PDF publications into a flip-book with our unique Google optimized e-Paper software.
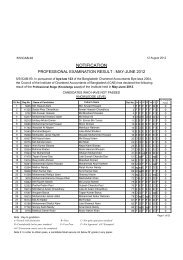
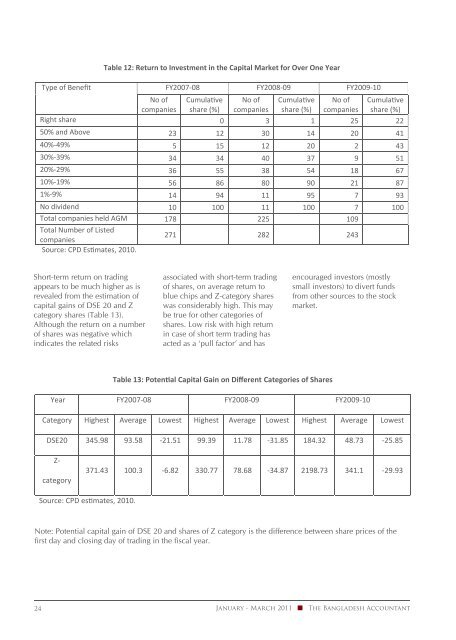
Table 12: Return to Investment in the Capital Market for Over One Year<br />
Type of Benefit FY2007 08 FY2008 09 FY2009 10<br />
No of<br />
companies<br />
Cumulave<br />
share (%)<br />
No of<br />
companies<br />
Cumulave<br />
share (%)<br />
No of<br />
companies<br />
Cumulave<br />
share (%)<br />
Right share 0 3 1 25 22<br />
50% and Above 23 12 30 14 20 41<br />
40% 49% 5 15 12 20 2 43<br />
30% 39% 34 34 40 37 9 51<br />
20% 29% 36 55 38 54 18 67<br />
10% 19% 56 86 80 90 21 87<br />
1% 9% 14 94 11 95 7 93<br />
No dividend 10 100 11 100 7 100<br />
Total companies held AGM 178 225 109<br />
Total Number of Listed<br />
companies<br />
271 282 243<br />
Source: CPD Esmates, 2010.<br />
Short‐term return on trading<br />
appears to be much higher as is<br />
revealed from the estimation of<br />
capital gains of DSE 20 and Z<br />
category shares (Table 13).<br />
Although the return on a number<br />
of shares was negative which<br />
indicates the related risks<br />
associated with short‐term trading<br />
of shares, on average return to<br />
blue chips and Z‐category shares<br />
was considerably high. This may<br />
be true for other categories of<br />
shares. Low risk with high return<br />
in case of short term trading has<br />
acted as a ‘pull factor’ and has<br />
encouraged investors (mostly<br />
small investors) to divert funds<br />
from other sources to the stock<br />
market.<br />
Table 13: Potenal Capital Gain on Different Categories of Shares<br />
Year FY2007 08 FY2008 09 FY2009 10<br />
Category Highest Average Lowest Highest Average Lowest Highest Average Lowest<br />
DSE20 345.98 93.58 21.51 99.39 11.78 31.85 184.32 48.73 25.85<br />
Z<br />
category<br />
371.43 100.3 6.82 330.77 78.68 34.87 2198.73 341.1 29.93<br />
Source: CPD esmates, 2010.<br />
Note: Potential capital gain of DSE 20 and shares of Z category is the difference between share prices of the<br />
first day and closing day of trading in the fiscal year.<br />
24<br />
January - March 2011<br />
The Bangladesh Accountant