History of Raman Technology Development - Academic Program ...
History of Raman Technology Development - Academic Program ...
History of Raman Technology Development - Academic Program ...

Create successful ePaper yourself
Turn your PDF publications into a flip-book with our unique Google optimized e-Paper software.
Waters Symposium: <strong>Raman</strong> Spectroscopy<br />
(24, 25) that showed that the loss <strong>of</strong> signal would be fully compensated<br />
by the advantages <strong>of</strong> a microprobe, which include<br />
• Tight laser focus at sample (resolution ∼1 µm)<br />
• <strong>Raman</strong> collection efficiency<br />
• Effective coupling <strong>of</strong> the sample volume on a small<br />
entrance slit.<br />
[According to Delhaye the only <strong>Raman</strong> researcher who<br />
showed an interest was Tomas Hirschfeld, but because <strong>of</strong> his<br />
involvement with the military, little <strong>of</strong> his work had been<br />
published with one exception (26).]<br />
It was only in 1973 when <strong>Raman</strong> microscopy was proven<br />
simultaneously in two locations. Paul Dhamelincourt, then a<br />
student <strong>of</strong> Delhaye, assembled a system that proved that a<br />
<strong>Raman</strong> microscope really was feasible. The initial experiments<br />
in Delhaye’s laboratory showed that it was possible to record<br />
a picture <strong>of</strong> a sample through its <strong>Raman</strong> light. Subsequently<br />
spectra <strong>of</strong> microparticles were measured. Simultaneously Greg<br />
Rosasco and Edgar Etz at the National Bureau <strong>of</strong> Standards<br />
assembled a microprobe based on an elliptical reflector in order<br />
to study environmental microparticles. The first publications<br />
documenting these experiments appeared in the abstracts<br />
for the <strong>Raman</strong> spectroscopy conference in 1974 (27, 28).<br />
Delhaye and Dhamelincourt (29) described their imaging<br />
<strong>Raman</strong> concepts in a publication in 1975 where they<br />
A<br />
showed several possibilities for creating a <strong>Raman</strong> image. These<br />
possibilities are illustrated in Figure 18. Based on these concepts<br />
the first commercial instrument, the MOLE, was introduced<br />
in 1974. The prototype is shown in Figure 19.<br />
This instrument had three modes <strong>of</strong> operation. It was<br />
based on a double monochromator using 1 m concave holographic<br />
gratings. When used as a microprobe, a 1-µm laser<br />
spot was imaged onto the entrance slit and then onto a PMT.<br />
When used as a spectrograph, a SIT or SEC camera was<br />
mounted at the exit focal plane and a range <strong>of</strong> about 100 cm 1<br />
could be viewed for kinetic measurements. When used as a<br />
<strong>Raman</strong> microscope, the sample was illuminated globally and<br />
it was imaged onto the grating rather than the slit. The image<br />
<strong>of</strong> the sample, after being diffracted by the grating, was<br />
projected onto the camera. Figure 20 shows the results <strong>of</strong> these<br />
three modes <strong>of</strong> operation on a mixture <strong>of</strong> MoO 3 and K 2 CrO 4 .<br />
<strong>Raman</strong> Microprobe<br />
The success <strong>of</strong> a <strong>Raman</strong> microprobe is based on four<br />
optical properties:<br />
• Laser focal spot at the sample<br />
• Collection efficiency <strong>of</strong> the microscope optics<br />
• Efficiency <strong>of</strong> the coupling <strong>of</strong> the light coming from<br />
the laser focal volume and the spectrometer or spectrograph<br />
• Confocal principle<br />
B<br />
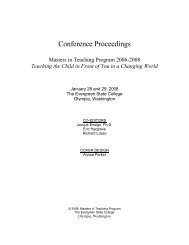
Figure 16. (A) Principle <strong>of</strong> triple <strong>Raman</strong> spectrograph with double<br />
subtractive foremonochromator. (B) Optical layout <strong>of</strong> T64000 in subtractive<br />
mode. Because <strong>of</strong> the reversal <strong>of</strong> the sense <strong>of</strong> dispersion <strong>of</strong><br />
gratings G 1 and G 2 , the slit S 3 sees nondispersed light that has been<br />
filtered by the foremonochromator. The coverage is determined by<br />
the size <strong>of</strong> the slit S 2 , which can be as large as 50 mm.<br />
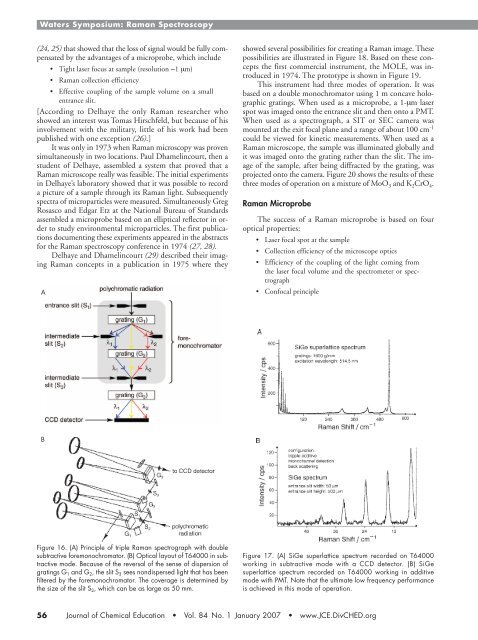
Figure 17. (A) SiGe superlattice spectrum recorded on T64000<br />
working in subtractive mode with a CCD detector. (B) SiGe<br />
superlattice spectrum recorded on T64000 working in additive<br />
mode with PMT. Note that the ultimate low frequency performance<br />
is achieved in this mode <strong>of</strong> operation.<br />
56 Journal <strong>of</strong> Chemical Education • Vol. 84 No. 1 January 2007 • www.JCE.DivCHED.org