Animal magnetocardiography using superconducting quantum ...
Animal magnetocardiography using superconducting quantum ...
Animal magnetocardiography using superconducting quantum ...

You also want an ePaper? Increase the reach of your titles
YUMPU automatically turns print PDFs into web optimized ePapers that Google loves.
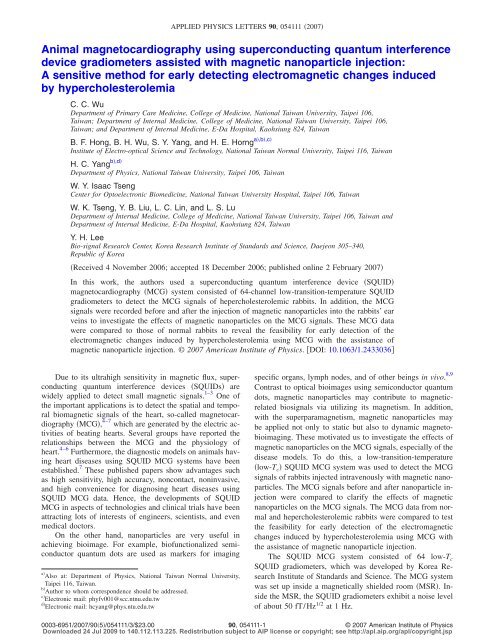
APPLIED PHYSICS LETTERS 90, 054111 2007<br />
<strong>Animal</strong> <strong>magnetocardiography</strong> <strong>using</strong> <strong>superconducting</strong> <strong>quantum</strong> interference<br />
device gradiometers assisted with magnetic nanoparticle injection:<br />
A sensitive method for early detecting electromagnetic changes induced<br />
by hypercholesterolemia<br />
C. C. Wu<br />
Department of Primary Care Medicine, College of Medicine, National Taiwan University, Taipei 106,<br />
Taiwan; Department of Internal Medicine, College of Medicine, National Taiwan University, Taipei 106,<br />
Taiwan; and Department of Internal Medicine, E-Da Hospital, Kaohsiung 824, Taiwan<br />
B. F. Hong, B. H. Wu, S. Y. Yang, and H. E. Horng a,b,c<br />
Institute of Electro-optical Science and Technology, National Taiwan Normal University, Taipei 116, Taiwan<br />
H. C. Yang b,d<br />
Department of Physics, National Taiwan University, Taipei 106, Taiwan<br />
W. Y. Isaac Tseng<br />
Center for Optoelectronic Biomedicine, National Taiwan University Hospital, Taipei 106, Taiwan<br />
W. K. Tseng, Y. B. Liu, L. C. Lin, and L. S. Lu<br />
Department of Internal Medicine, College of Medicine, National Taiwan University, Taipei 106, Taiwan and<br />
Department of Internal Medicine, E-Da Hospital, Kaohsiung 824, Taiwan<br />
Y. H. Lee<br />
Bio-signal Research Center, Korea Research Institute of Standards and Science, Daejeon 305–340,<br />
Republic of Korea<br />
Received 4 November 2006; accepted 18 December 2006; published online 2 February 2007<br />
In this work, the authors used a <strong>superconducting</strong> <strong>quantum</strong> interference device SQUID<br />
<strong>magnetocardiography</strong> MCG system consisted of 64-channel low-transition-temperature SQUID<br />
gradiometers to detect the MCG signals of hepercholesterolemic rabbits. In addition, the MCG<br />
signals were recorded before and after the injection of magnetic nanoparticles into the rabbits’ ear<br />
veins to investigate the effects of magnetic nanoparticles on the MCG signals. These MCG data<br />
were compared to those of normal rabbits to reveal the feasibility for early detection of the<br />
electromagnetic changes induced by hypercholesterolemia <strong>using</strong> MCG with the assistance of<br />
magnetic nanoparticle injection. © 2007 American Institute of Physics. DOI: 10.1063/1.2433036<br />
Due to its ultrahigh sensitivity in magnetic flux, <strong>superconducting</strong><br />
<strong>quantum</strong> interference devices SQUIDs are<br />
widely applied to detect small magnetic signals. 1–3 One of<br />
the important applications is to detect the spatial and temporal<br />
biomagnetic signals of the heart, so-called <strong>magnetocardiography</strong><br />
MCG, 4–7 which are generated by the electric activities<br />
of beating hearts. Several groups have reported the<br />
relationships between the MCG and the physiology of<br />
heart. 4–6 Furthermore, the diagnostic models on animals having<br />
heart diseases <strong>using</strong> SQUID MCG systems have been<br />
established. 7 These published papers show advantages such<br />
as high sensitivity, high accuracy, noncontact, noninvasive,<br />
and high convenience for diagnosing heart diseases <strong>using</strong><br />
SQUID MCG data. Hence, the developments of SQUID<br />
MCG in aspects of technologies and clinical trials have been<br />
attracting lots of interests of engineers, scientists, and even<br />
medical doctors.<br />
On the other hand, nanoparticles are very useful in<br />
achieving bioimage. For example, biofunctionalized semiconductor<br />
<strong>quantum</strong> dots are used as markers for imaging<br />
a Also at: Department of Physics, National Taiwan Normal University,<br />
Taipei 116, Taiwan.<br />
b Author to whom correspondence should be addressed.<br />
c Electronic mail: phyfv001@scc.ntnu.edu.tw<br />
d Electronic mail: hcyang@phys.ntu.edu.tw<br />
specific organs, lymph nodes, and of other beings in vivo. 8,9<br />
Contrast to optical bioimages <strong>using</strong> semiconductor <strong>quantum</strong><br />
dots, magnetic nanoparticles may contribute to magneticrelated<br />
biosignals via utilizing its magnetism. In addition,<br />
with the superparamagnetism, magnetic nanoparticles may<br />
be applied not only to static but also to dynamic magnetobioimaging.<br />
These motivated us to investigate the effects of<br />
magnetic nanoparticles on the MCG signals, especially of the<br />
disease models. To do this, a low-transition-temperature<br />
low-T c SQUID MCG system was used to detect the MCG<br />
signals of rabbits injected intravenously with magnetic nanoparticles.<br />
The MCG signals before and after nanoparticle injection<br />
were compared to clarify the effects of magnetic<br />
nanoparticles on the MCG signals. The MCG data from normal<br />
and hepercholesterolemic rabbits were compared to test<br />
the feasibility for early detection of the electromagnetic<br />
changes induced by hypercholesterolemia <strong>using</strong> MCG with<br />
the assistance of magnetic nanoparticle injection.<br />
The SQUID MCG system consisted of 64 low-T c<br />
SQUID gradiometers, which was developed by Korea Research<br />
Institute of Standards and Science. The MCG system<br />
was set up inside a magnetically shielded room MSR. Inside<br />
the MSR, the SQUID gradiometers exhibit a noise level<br />
of about 50 fT/Hz 1/2 at 1 Hz.<br />
0003-6951/2007/905/054111/3/$23.00<br />
90, 054111-1<br />
© 2007 American Institute of Physics<br />
Downloaded 24 Jul 2009 to 140.112.113.225. Redistribution subject to AIP license or copyright; see http://apl.aip.org/apl/copyright.jsp
054111-2 Wu et al. Appl. Phys. Lett. 90, 054111 2007<br />
FIG. 2. Temporal variations in the normalized peak-to-peak magnetic signal,<br />
B/B 0 , in the MCG contour map for a P, b Q, c R, d S, ande<br />
T waves of normal rabbits injected with magnetic fluid dashed lines and<br />
pure dextran solution solid lines.<br />
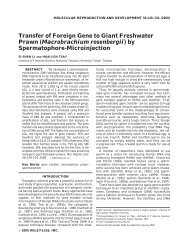
FIG. 1. Color online a Picture to show the chest area, which is enveloped<br />
with supersternal, right axillar, and left axillar, for MCG measurement. Typical<br />
MCG contour map for Q wave of a hepercholesterolemic rabbit b<br />
before and c after being injected with magnetic fluid.<br />
Three normal and another three hypercholesterolemic<br />
rabbits were used for MCG studies. To make the rabbits hypercholesterolemic,<br />
we fed the rabbits with standard rabbit<br />
chow enriched with 0.5% cholesterol, 0.2% vitamins, 0.8%<br />
minerals, and 12.1% coconut oil for 3 weeks. Statistically,<br />
the serum concentrations of cholesterol were around 500 and<br />
50 mg/dL for hepercholesterolemic and normal rabbits, respectively.<br />
For MCG measurement, each rabbit was anesthetized.<br />
The MCG measurement was performed just before the<br />
injection of magnetic nanoparticles. The following MCG<br />
measurement was done immediately after the injection. The<br />
following MCG measurements were conducted every<br />
20 min. The other normal rabbit was used for magnetic resonance<br />
imaging MRI study before and after the injection of<br />
magnetic nanoparticles. Experiments on rabbits were performed<br />
in accordance with the regulations set by the National<br />
Taiwan University <strong>Animal</strong> Care and Use Committee<br />
and approved by National Taiwan University.<br />
The injected magnetic nanoparticles are dextran-coated<br />
Fe 3 O 4 nanoparticles GABC Co., which are homogeneously<br />
dispersed in water. The mean diameter of the nanoparticles is<br />
52 nm. The saturated magnetization of the magnetic fluid<br />
containing magnetic nanoparticles is 0.3 emu/g. The volume<br />
of magnetic fluid injected into each rabbit was 2 ml. The<br />
magnetic fluid was injected into the rabbits’ ear vein. Hemodynamically,<br />
the injected magnetic fluid flew from the right<br />
to the left heart, and then perfused the myocardium through<br />
the coronary arteries. It was observed that the magnetic fluid<br />
flew into the heart in a short period of time after injection, as<br />
evidenced by the MRI study not shown here.<br />
The MCG signals within the chest area of a hypercholesterolemic<br />
rabbit were detected, as shown in Fig. 1a. The<br />
typical averaged MCG contour map within the detected area<br />
for a certain instant, say, Q wave, is plotted in Fig. 1b. The<br />
maximum intensity B max was observed at the lower-right<br />
part, and the minimum intensity B min occurred at the upperleft<br />
part. After the injection of magnetic fluid, the MCG contour<br />
map of Q wave is probed, as shown in Fig. 1c. Itwas<br />
found that the B max became higher than that before the injection.<br />
To quantitatively describe the variation in the intensities<br />
of MCG contour maps due to the injection of magnetic fluid,<br />
the peak-to-peak magnetic signal B, defined as B max −B min ,<br />
was analyzed as a function of time after the injection of<br />
magnetic fluid into rabbits. To eliminate the individual difference<br />
among rabbits, the B was normalized to B 0 ,<br />
which corresponds to B max −B min just before the injection of<br />
magnetic fluid. Since the magnetic nanoparticles Fe 3 O 4 are<br />
coated with dextran, the effect on B may be attributed to<br />
the Fe 3 O 4 magnetic nanoparticles or dextran. To clarify this<br />
point, the time-dependent B/B 0 for the rabbits injected<br />
with pure dextran solution was also investigated. The timedependent<br />
normalized values, B/B 0 , for P, Q, R, S, and T<br />
Downloaded 24 Jul 2009 to 140.112.113.225. Redistribution subject to AIP license or copyright; see http://apl.aip.org/apl/copyright.jsp
054111-3 Wu et al. Appl. Phys. Lett. 90, 054111 2007<br />
FIG. 3. Temporal variations in the normalized peak-to-peak magnetic signal,<br />
B/B 0 , in the MCG contour map for a P, b Q, c R, d S, and e<br />
T waves of hypercholesterolemic rabbits injected with magnetic fluid<br />
dashed lines and pure dextran solution solid lines.<br />
waves for normal and hypercholesterolemic rabbits are plotted<br />
in Figs. 2 and 3, respectively. The data at time being zero<br />
correspond to B/B 0 ’s before the injection of magnetic<br />
fluid. The squares and solid lines represent for the data after<br />
dextran injection, and the circles and dashed lines for those<br />
after magnetic fluid injection, respectively.<br />
In order to identify any effect on B of the P, Q, R, and<br />
S waves, the MCG contour map of normal rabbits injected<br />
with magnetic fluid or pure dextran solution were measured.<br />
Furthermore, the B/B 0 as a function of time was analyzed<br />
and is shown in Fig. 2. It is obvious that both dashed lines<br />
and solid lines in Figs. 2a–2d for P, Q, R, and S waves<br />
overlap and are kept at a constant value of 1. This means that<br />
both magnetic fluid and pure dextran solution hardly affect<br />
the cardiac electromagnetic activities during P to S wave.<br />
However, the data shown in Fig. 2c reveal that the B in<br />
the MCG contour map for T wave was depressed when normal<br />
rabbits were injected with magnetic fluid. The suppressed<br />
B was probable due to most of the magnetic nanoparticles<br />
flowing downstream through the coronary arteries<br />
during the cardiac diastolic phase, which was compatible<br />
with T wave on MCG tracings.<br />
In contrast, it could be observed in Fig. 3 that, except<br />
that of T wave, the time-dependent B/B 0 curves for P, Q,<br />
R, and S waves exhibited a similar behavior. The B/B 0 ’s<br />
became higher than 1 after the injection of magnetic fluid.<br />
This result implies that the difference between B max and B min<br />
in the MCG contour map was enhanced for hypercholesterolemic<br />
rabbits after the injection of magnetic fluids. The results<br />
are shown with solid lines in Figs. 3a–3e for P, Q,<br />
R, S, and T waves, respectively. Remarkably, the B/B 0<br />
almost remains at 1 for the solid lines in Figs. 3a–3e. This<br />
reveals that the enhancement in B in the MCG contour map<br />
for P, Q, R, and S waves of hypercholesterolemic rabbits<br />
was caused only by the Fe 3 O 4 magnetic nanoparticles. Although<br />
the detailed mechanism responsible for the enhancement<br />
in B of MCG contour map is not clear, it is strongly<br />
suggested that the Fe 3 O 4 magnetic nanoparticles leaking<br />
from the coronary arteries into myocardium through tiny<br />
clefts of the coronary arteries of hypercholesterolemic rabbits<br />
may be the most possible candidate. Thus, the electromagnetic<br />
signals generated by the action potential of myocardium<br />
are modified with the surrounding magnetic<br />
nanoparticles.<br />
Through comparing the magnetic-fluid induced variations<br />
in B of MCG contour maps in Figs. 2 and 3, a significantly<br />
different behavior between normal and hypercholesterolemic<br />
rabbits was obtained. It is worthy to note that<br />
the conventional diagnosis such as electrocardiography cannot<br />
distinguish the difference between normal and hypercholesterolemic<br />
rabbits until having been hypercholesterolemic<br />
for 6 weeks. 10 However, according to the results shown in<br />
Figs. 2 and 3, an abnormal magnetic-fluid induced B of<br />
MCG contour map could be observed in rabbits having<br />
hypercholesterolemia only for 3 weeks. Therefore, the measurement<br />
of magnetic-fluid induced B in MCG is promising<br />
for the early-stage diagnosis for hypercholesterolemic<br />
rabbits.<br />
This work is supported by the National Science Council<br />
of Taiwan under Grant Nos. 95-2120-M-003-001, 95-2112-<br />
M-003-017-MY2, 95-2112-M-003-019, 95-2221-E-212-054-<br />
MY3, and 95-2752-M-002-016-PAE.<br />
1 C. Carr, A. Cochran, J. Kuznik, D. McA. McKirdy, and G. B. Donaldson,<br />
Cryogenics 36, 691 1996.<br />
2 A. H. Miklich, D. Koelle, F. Ludwig, D. T. Nemeth, E. Dantsker, and J.<br />
Clarke, Appl. Phys. Lett. 66, 230 1995.<br />
3 H. E. Horng, S. Y. Yang, Chin-Yih Hong, C. M. Liu, P. S. Tsai, H. C.<br />
Yang, and C. C. Wu, Appl. Phys. Lett. 88, 252506 2006.<br />
4 Y. Tavrin, Y. Zhang, M. Mück, A. I. Brazinski, and C. Heiden, Appl. Phys.<br />
Lett. 62, 18241993.<br />
5 K. Yokosawa, A. Tsukamoto, A. Suzuki, T. Miyashita, M. Ogata, Y. Seki,<br />
and K. Tsukada, Supercond. Sci. Technol. 16, 1383 2003.<br />
6 K. Kim, H. Kwon, Y. H. Lee, J. M. Kim, Y. K. Park Y. G. Ko and N.<br />
Chung, J. Korean Phys. Soc. 48, 1123 2006.<br />
7 H. C. Yang, T. Y. Wu, H. E. Horng, C. C. Wu, S. Y. Yang, S. H. Liao, C.<br />
H. Wu, J. T. Jeng, J. C. Chen, K. L. Chen, and M. J. Chen, Supercond. Sci.<br />
Technol. 19, S297 2006.<br />
8 Y. M. Huh and Y. J. Kim, Curr. Appl. Phys. 6, e22 2006.<br />
9 F. Pinaud, X. Michalet, L. A. Bentolila, J. M. Tsay, S. Doose, J. J. Li, G.<br />
Iyer, and S. Weiss, Biomaterials 27, 1679 2006.<br />
10 Y. B. Liu, C. C. Wu, L. S. Lu, M. J. Su, C. W. Lin, S. F. Lin, L. S. Chen,<br />
M. Fishbein, and Y. T. Lee, Circ. Res. 30, 11452003.<br />
Downloaded 24 Jul 2009 to 140.112.113.225. Redistribution subject to AIP license or copyright; see http://apl.aip.org/apl/copyright.jsp