sensors
sensors
sensors

You also want an ePaper? Increase the reach of your titles
YUMPU automatically turns print PDFs into web optimized ePapers that Google loves.
Sensors 2007, 7, 3366-3385<br />
<strong>sensors</strong><br />
ISSN 1424-8220<br />
© 2007 by MDPI<br />
www.mdpi.org/<strong>sensors</strong><br />
Full Research Paper<br />
A Novel Pulse Measurement System by Using Laser<br />
Triangulation and a CMOS Image Sensor<br />
Jih-Huah Wu 1 , Rong-Seng Chang 2 , and Joe-Air Jiang 3, *<br />
1 Department of Biomedical Engineering, Ming Chuan University, No. 5, Deming Rd., Gweishan<br />
Township, Taoyuan 333, Taiwan.<br />
2 Department of Optics and Photonics, National Central University, No. 300, Jung-Da Rd., Chung-Li<br />
City, Taoyuan 320, Taiwan.<br />
3 Department of Bio-Industrial Mechatronics Engineering, National Taiwan University, No. 1, Sec. 4,<br />
Roosevelt Rd., Taipei 106, Taiwan.<br />
*Author to whom correspondence should be addressed. E-mail: jajiang@ntu.edu.tw<br />
Received: 2 November 2007 / Accepted: 18 December 2007 / Published: 19 December 2007<br />
Abstract: This paper presents a novel, non-invasive, non-contact system to measure pulse<br />
waveforms of artery via applying laser triangulation method to detect skin surface<br />
vibration. The proposed arterial pulsation measurement (APM) system chiefly consists of a<br />
laser diode and a low cost complementary metal-oxide semiconductor (CMOS) image<br />
sensor. Laser triangulation and centroid method are combined with the Fast Fourier<br />
Transform (FFT) in this study. The shape and frequency of the arterial pulsation can be<br />
detected rapidly by using our APM system. The relative variation of the pulse at different<br />
measurement points near wrist joint is used as a prognostic guide in traditional Chinese<br />
medicine (TCM). An extensive series of experiments was conducted to evaluate the<br />
performance of the designed APM system. From experimental results, the pulse amplitude<br />
and frequency at the Chun point (related to the small intestine) of left hand showed an<br />
obvious increase after having food. In these cases, the peak to peak amplitudes and the<br />
frequencies of arterial pulsations range from 38 to 48 µm and from 1.27 to 1.35 Hz,<br />
respectively. The height of arterial pulsations on the area near wrist joint can be estimated<br />
with a resolution of better than 4 µm. This research demonstrates that applying a CMOS<br />
image sensor in designing a non-contact, portable, easy-to-use, low cost pulse measurement<br />
system is feasible. Also, the designed APM system is well suited for evaluating and prediagnosing<br />
the health of a human being in TCM clinical practice.
Sensors 2007, 7 3367<br />
Keywords: Arterial pulsation; Centroid method; CMOS image sensor; Laser triangulation;<br />
Pulse frequency.<br />
1. Introduction<br />
The waveform of arterial pulsation is considered a fundamental indicator for the diagnosis of<br />
cardiovascular disease, which can guide therapeutic decisions in complex clinical situations [1].<br />
Abnormalities of the waveform shape and frequency of the arterial palpitation are indicators of certain<br />
cardiovascular disorders. Thus, how to distinguish arterial pulse waveforms without distortion has<br />
become an important issue in biomedical signal processing. In addition, pulse diagnosis is one of four<br />
kinds of diagnostic methods used in TCM clinical practice to determine the physiological condition of<br />
the patients [2]. The most commonly used clinical methods to measure the behavior of the pulse<br />
include the stethoscope, sphygmomanometer, and Doppler-based instrumentation. Recently, some<br />
practitioners in TCM use a pulse diagnosis machine or other device to record changes in the pulse [3].<br />
A set of three pressure transducers for sensing the pulses at three locations has already been developed<br />
[4]. Lu et al. analyzed the harmonics of the frequency spectrum of arterial pulse waves and correlated<br />
some illness conditions to certain harmonics [5]. Hong et al. described a non-touch pulse measurement<br />
method based on optical interferometer [6], which could estimate skin vibration velocity. However, the<br />
devices used in the above-mentioned studies could either interfere with the measurement results<br />
because of making contact with the body, or were more costly because of having additional <strong>sensors</strong> for<br />
probing multiple points. An optical non-contacting technology, which is based on optical triangulation,<br />
is proposed in this study. Laser triangulation is a well-known method in thickness and contour<br />
measurement, and has been applied to many industrial fields [7-9]. It was also used to examine the<br />
vertical movements of the vocal folds during phonation [10].<br />
Laser triangulation is normally used in conjunction with light centroid measuring devices, e.g.<br />
position sensing detectors (PSDs) and charge coupled devices (CCDs). Since the manufacturing<br />
technology behind the CMOS image <strong>sensors</strong> has now been advanced sufficiently to achieve good<br />
stability and low cost, the CMOS image <strong>sensors</strong> have become increasingly significant in industrial<br />
optical <strong>sensors</strong> [11-12]. The CMOS image <strong>sensors</strong> possess several programmable features including<br />
electronic exposure (ET) control, continuous or single frame capture, and progressive or interlaced<br />
scanning modes. The first of these features is very important to our experiments, especially for<br />
reducing noise and locating measurement point of laser spot.<br />
In general, the relationship between pulse waves and physiological or healthy conditions of the<br />
tested subjects is quite complex. Such relationship might exhibit nonlinear characteristic and might<br />
also vary person to person due to characteristics of the artery, deep or shallow, healthy or hardened, etc.<br />
Basically, the more pulse waveforms are obtained, the more information including pulse rates and<br />
harmonics related to the diagnosis in TCM can be achieved. In TCM clinical practice, an experienced<br />
TCM physician can do the pulse diagnosis by palpation treatment conducted on multiple measurement<br />
points (i.e., Chun, Guan, and Chy points) to determine the relationships between the organs health and<br />
the wave patterns of pulses. These facts have been demonstrated in many literatures [13-14]. Of course,
Sensors 2007, 7 3368<br />
a more complex and accurate arterial pulse measurement system is necessary if more factors are taking<br />
into consideration in TCM clinical practice.<br />
This paper describes the design of the arterial pulsation measurement (APM) system, and presents<br />
the results of tests conducted to verify the pulse measurement accuracy. The pulsation rate was derived<br />
from the frequency spectrum of the laser spot vibration, and showed great consistence with data taken<br />
from loudspeaker movement driven by a function generator at a specific frequency. Frequency<br />
validation was also conducted by comparing the experimental results with data obtained from a<br />
standard blood pressure monitor. The amplitude and frequency variation at each point measured on the<br />
tested subject’s wrist is an important symptom for some illness during the patient’s medical<br />
examinations in TCM clinical practice. The evaluation of pulse variation gives us some valuable<br />
information concerning about the tested subjects’ health.<br />
2. Principles of Measurement<br />
The proposed APM system combines the Fast Fourier Transform (FFT), the centroid method, and<br />
the optical triangulation method. The frequency spectrum of the arterial pulse waveforms measured at<br />
the specified point is obtained by FFT method. The calculations were conducted by MATLAB 7.0 and<br />
Origin 6.0. It is possible by using the FFT theory [15] to build a variety of non-sinusoidal waveforms<br />
consisting of many sinusoidal waveforms. In other words, a non-sinusoidal waveform can be<br />
decomposed into many sinusoidal waveforms with different frequencies, amplitudes, and phases. Due<br />
to the speed limitation of the CMOS image sensor, we discuss only the fundamental sinusoidal<br />
waveform in this paper.<br />
The laser triangulation method is simple in structure. It makes possible to measure the subject’s<br />
arterial pulse waveforms in a non-contact way. The experimental data show that changes in the arterial<br />
pulse waveforms can be detected by analyzing the centroid movements of a laser spot. The changes of<br />
the centroid of the laser spot, which is measured at certain points on the wrist, can be transformed into<br />
the changes in magnitude of relative height caused by skin vibration.<br />
The basic operation principle of the proposed APM system is described as follow. A laser diode, a<br />
laser driver, and a CMOS image sensor are used to establish an optical non-contact pulse measurement<br />
device. The laser diode emits laser light onto the measurement site of skin surface where its arterial<br />
pulsation needs to be determined. The laser spot is formed on the skin surface of the wrist of tested<br />
subject and the variation of the spot image is captured by the CMOS image sensor and then projected<br />
onto the scattered points that represent arterial pulsations. These scattered light points are processed by<br />
FFT method to determine the amplitude and frequency of arterial pulses of tested subjects. In this work,<br />
the proposed APM system adopts a simple structure based on optical triangulation. The geometrical<br />
layout of the designed APM system is depicted in Fig. 1. In Fig. 1, X represents the distance between<br />
the target and the collimated lens of laser diode and δX is the small fluctuation (i.e., the distance<br />
between measured points A and B) of skin surface due to arterial pulsation. The target distance X is<br />
measured continuously. Using a simple triangulation principle, the measured X target coordinates are<br />
mapped onto the detection position d on the CMOS sensor, as shown in Fig. 1. The target distance X is<br />
given by
Sensors 2007, 7 3369<br />
Figure 1. Geometrical layout of the arterial pulse measurement system.<br />
X<br />
=<br />
θ<br />
L<br />
−1<br />
tan(<br />
o<br />
+ tan ( d / f ))<br />
, (1)<br />
where L is the distance between the laser and the CMOS image sensor, d is the distance between the<br />
two spots mapped onto the CMOS image sensor, f is the focal length of the lens, Z is the distance<br />
between the measured point A and the center C of the lens of CMOS sensor, α is the angle between the<br />
axis and the measured point A, δX′ is the distance between the measured point A and the optical axis of<br />
the lens, and θ 0 is the angle between the two axes of the CMOS image sensor and the laser. In our<br />
APM system, these parameters are X = 94 mm, L = 110 mm, Z = 144.7 mm, and f = 16 mm (the focal<br />
length of the lens of CMOS image sensor). The diameter of the lens in front of the CMOS image<br />
sensor is 6 mm.<br />
Differentiating Eq. (1) with respect to the measured distance and rearranging the result yields<br />
2<br />
Z d<br />
δ X = . (2)<br />
f L<br />
where δX is also regarded as the resolution of the designed APM system.<br />
For the experiments conducted in this study, the smallest resolvable amplitude change to a subpixel<br />
size of d = 0.8 µm on the CMOS image sensor can be achieved. After calibration, this value<br />
corresponds to a measurement resolution of 9.5 µm achieved by the designed APM system, i.e., δX =<br />
9.5 µm in Eq. (2). Such a measurement resolution is sufficient to detect the vibration of human<br />
pulsation.<br />
The actual implementation of the APM system is shown in Fig. 2. The sampling area in Fig.2 was<br />
located by a TCM physician. Using simple triangulation method, the displacement δX of the variation<br />
of the laser spot mapped onto the CMOS image sensor can be determined. The amplitude and<br />
frequency of the arterial pulse can be obtained by analyzing the spot position.<br />
The centroid method has been widely used to locate a light spot with respect to various types of<br />
image features, to sub-pixel accuracy [16-17]. The resolution of the APM system can be increased by
Sensors 2007, 7 3370<br />
Figure 2. The actual implementation of the proposed APM system.<br />
introducing sub-pixel processing technique [16-17]. The threshold level of image pixel is deliberately<br />
set so that in the captured laser spot image a pixel with intensity below the threshold level will be<br />
neglected. In our experiments, the threshold of the gray level of image pixel is set to 20% below the<br />
highest full range level. Also, note that the vibration frequency of arterial pulsation can be obtained by<br />
processing the recorded image by means of FFT method.<br />
A CMOS image sensor with a 5.3 × 3.8 mm 2 active area (HV7131D, manufactured by Hynix<br />
Semiconductor Incorporated.) was used to detect the laser light spot with high accuracy and stability.<br />
The sensor has a 648 × 488 pixels array and each compact active pixel element has high photosensitivity<br />
(3150 mV/lux-sec). It can convert the photon energy to analog voltage signal with a<br />
resolution of 8 µm. The CMOS sensor utilizes three On-chip 8-bit Digital to Analog Converts (DAC)<br />
and 648 comparators to digitize the pixel output.<br />
The output power of the adopted laser diode (Model no.: QL63d5sA, MORETEC, Inc.) is 1.3 mW,<br />
its wavelength is 650 nm, and its spectral width is about 20 nm. The diameter of the laser spot on the<br />
skin surface is approximately 1 mm, giving a spot on the CMOS sensor of tens of pixels in both<br />
directions.<br />
At normal incidence of laser light, about a 4 ~ 7% power reflection occurs due to the differences in<br />
the refractive indices of the skin layers [18]. Also, some photons are scattered by superficial skin. The<br />
light scattered from the skin surface is the most important signal for this pulse measurement. However,<br />
photons penetrating into skin layers are also scattered, providing diffuse reflections which are of lower<br />
power than the first kind of light scattered by the superficial skin. The exposure time (ET, equivalent to<br />
gain level) of the CMOS sensor can be adjusted to different levels for different situations. This means<br />
that the signal-to-noise ratio (SNR) can be improved by setting the gain level.<br />
There is a large amount of stray light due to the diffusely scattering nature of the skin tissue. By<br />
decreasing the ET of the CMOS sensor, the undesirable light can be eliminated. For example, Fig. 3(a)<br />
shows the experimental result when the ET value of the CMOS image sensor was set to 40. In the case<br />
of Fig. 3(b), the ET value of the CMOS image sensor was set to 1. The contours of the laser spot
Sensors 2007, 7 3371<br />
(a)<br />
(b)<br />
Figure 3. The contours of laser spots after ET values of the CMOS image sensor were set to: (a) 40<br />
and (b) 1.<br />
shown in Fig. 3(b) are obviously smaller than that in Fig. 3(a). In a normal image capturing situation,<br />
as shown in Fig. 3(a), the previously measured point can be approximately relocated by comparing the<br />
two consecutively captured frames. The signal processing flowchart is shown in Fig. 4. The software<br />
packages of MATLAB 7.0 and Origin 6.0 were used to develop the signal processing program. The<br />
program we developed can calculate the amplitude and frequency of the arterial pulse of the tested<br />
subject via examining the relative movements of the measured laser spots.<br />
3. Calibration and validation of the arterial pulse measurement system<br />
The image data were recorded by a CMOS image sensor and transmitted to a personal computer for<br />
further analysis. The images were saved in bitmap format for later image processing and frequency
Sensors 2007, 7 3372<br />
Figure 4. Signal processing flowchart for the proposed arterial pulse measurement system.<br />
spectrum analysis. Fifteen frames per second were captured by the CMOS image sensor. The pictures<br />
captured by the CMOS image sensor lasted for 10 or 20 seconds in each measurement. The more<br />
frames are recorded; the better resolution of the image data can be achieved.<br />
The calibration of the APM system was very straightforward and easy. A precise translator was<br />
used to calibrate the linearity of the APM system. A white paper was placed above the translator as a<br />
reference panel, and then the shift of the laser spot can be calibrated by adjusting the elevation of the<br />
translator step-by-step. The adopted step size of the translator that can mimic pulsation amplitude<br />
measurement is 20 µm. The schematic drawing of the linearity calibration of the APM system is shown<br />
in Fig. 5. The amplitude calibration of pulsation height measured by the APM system was conducted<br />
on an isolated optical table. The results for the linearity calibration experiments are shown in Fig. 6(a).<br />
The one standard deviation (1σ) is obtained by conducting the measurements 30 times, and the<br />
results are as shown in Fig. 6(b). Examining Fig. 6(b) indicates that the one standard deviation of the<br />
APM system achieved is less than 0.04 pixels, i.e., approximately equivalent to 3.8 µm. This fact<br />
demonstrates that the APM system provides pretty good performance on measurement stability.<br />
The frequency calibration was conducted by comparing the experimental results with the drumhead<br />
movements of a loudspeaker driven by a high-precision function generator (LFG-1300, Leader, Inc.).<br />
In this experiment, we used a function generator with a specific frequency to drive the loudspeaker. So,<br />
the drumhead variation of the loudspeaker referred to a standard frequency can be provided as the
Sensors 2007, 7 3373<br />
Figure 5. The schematic drawing of the linearity calibration of the APM system.<br />
(a)<br />
(b)<br />
Figure 6. Calibration for the pulsation amplitude measurement of the proposed APM system: (a) the<br />
results for linearity calibration experiments and (b) the one standard deviation of amplitude calibration<br />
experiments.<br />
reference of the frequency calibration of our APM system. The schematic drawing of the frequency<br />
calibration of the APM system is shown in Fig. 7. For the loudspeaker operated at 1.0 Hz, the<br />
amplitude variation of the loudspeaker drumhead movements in the time domain and its frequency<br />
spectrum are shown in Fig. 8(a) and 8(b), respectively. The calibration results, from 0.6 to 2.0 Hz, are<br />
shown in Table 1. In this test, the frame capture rate of CMOS image sensor of the APM system is set
Sensors 2007, 7 3374<br />
Figure 7. The schematic drawing of the frequency calibration of the APM system.<br />
to 15 frames/sec. The accuracy of pulse measurement could reach 2.5%, i.e. the error in the pulse rate<br />
would be less than 1.5 pulses per minute.<br />
The accuracy of the frequency measurement of our APM system was also validated by comparing<br />
the experimental results with the data obtained from a blood pressure monitor (Model No.: OS-512,<br />
OSIM, Inc.). Ten healthy volunteers participated in this study. The experimental results are<br />
summarized in Table 2. The difference between the measured results obtained from the APM system<br />
and the blood pressure monitor was no more than 2.8%, i.e., 2 pulses/min.<br />
Table 1. Frequency calibration of the APM system from 0.6 − 2.0 Hz with a function generator and a<br />
loudspeaker.<br />
Standard frequency (Hz) Frequency obtained from the APM system Error (%)<br />
0.6 0.585 2.5<br />
0.7 0.703 0.4<br />
0.8 0.820 2.5<br />
0.9 0.879 2.3<br />
1.0 0.995 0.4<br />
1.1 1.113 1.2<br />
1.2 1.230 2.5<br />
1.3 1.288 0.9<br />
1.4 1.406 0.4<br />
1.5 1.523 1.5<br />
1.6 1.581 1.2<br />
1.7 1.698 0.2<br />
1.8 1.816 0.9<br />
1.9 1.874 1.4<br />
2.0 1.991 0.4
Sensors 2007, 7 3375<br />
(a)<br />
(b)<br />
Figure 8. Frequency calibration of the APM system: (a) the spot variation versus time (time domain)<br />
and (b) the frequency spectrum analysis of the data in (a) using FFT method.<br />
The position variations of the laser spot centers measured in the time domain are illustrated by the<br />
thin line in Fig. 9(a). This variation curve contains a full region of information associated with<br />
vibration frequencies and amplitudes of the arterial pulses, breathings, hand movements, and
Sensors 2007, 7 3376<br />
Table 2. Comparison of the frequency measurements made by the APM system and a blood pressure<br />
monitor (Model No.: OS-512, OSIM, Inc.).<br />
Volunteer No. OSIM OS-512 (pulse rate) APM system (pulse rate) Error (%)<br />
1 69 68 −1.4<br />
2 76 77 1.3<br />
3 75 76 1.3<br />
4 84 86 2.4<br />
5 90 92 2.2<br />
6 82 81 −1.2<br />
7 78 78 0.0<br />
8 72 74 2.8<br />
9 94 96 2.1<br />
10 78 78 0.0<br />
involuntary body tremors. Generally, the human pulse is about 0.7 to 2 Hz. The measurement data after<br />
being filtered with a band pass filter is depicted by a thick line as shown in Fig.9 (a). The amplitude of<br />
vibration of laser spot center (in terms of pixels) has been enlarged in Fig. 9(b). It can be seen that the<br />
change of the center of the laser spot is proportional to the change in distance to the skin as calculated<br />
in Eq. (1). In Fig. 9(b), the peak to peak values of the spot center variation curve are almost fallen<br />
within 0.6 pixels, i.e., the arterial pulse amplitude is approximately equal to 57 µm. The full spectrum<br />
in frequency domain for Fig. 9(a) is shown in Fig. 10 (a). An inspection of both Fig. 9(a) and Fig. 10(a)<br />
indicates that there was low frequency vibration caused by noise, hand movements, and breathings.<br />
After filtering, the pulse frequency (1.17 Hz) could be obtained easily, as seen in Fig. 10(b).<br />
4. Experimental results<br />
In TCM there are four diagnostic methods: inspection, auscultation, questioning, and palpation.<br />
Among these methods, the pulse diagnosis by palpation is the most important and also the most<br />
difficult one. According to Chinese medical literature [13], there are in total of 29 wave patterns of the<br />
arterial pulse, each having a specific name. However, it is too difficult and too subjective for most<br />
people to distinguishing 29 different wave patterns with the finger tips. The TCM physician usually<br />
needs to use an auxiliary device to determine these patterns. The relationships between the organs<br />
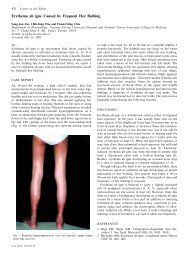
health and the measurement points are illustrated in Fig. 11. This is especially meaningful in TCM<br />
clinical practice, because for pulse diagnosis the physician places his index, middle, and ring fingers on<br />
the patient’s wrist, in accordance with the three locations called Chun, Guan, and Chy [14]. In our<br />
experiments, we found that variations in the pulse at relative measurement points on the wrist<br />
mentioned-above could reveal something about the physiology of the tested subjects.<br />
Some of the measurement results for pulse amplitude and frequency obtained under different<br />
conditions are shown in Figs. 12 and 13, respectively. In Fig. 12, the pulse amplitude and frequency<br />
measured at the Chun point of left hand (related to the small intestine) showed an obvious increase<br />
after having food. Fig.12 (a) shows results observed before the meal and Fig. 12(b) are those after<br />
meal,
Sensors 2007, 7 3377<br />
(a)<br />
(b)<br />
Figure 9. Laser spot centers measured by APM system: (a) the original data of centroid variation of<br />
laser spot center and (b) the data after enlarged amplitude scale and with filtering.<br />
respectively. The measurements were conducted 30 minutes before and 30 minutes after eating the<br />
meal.<br />
In Fig. 12(a), the peak to peak value of pulsation amplitude is approximately within 0.4 pixels, i.e.,<br />
the maximum variation in pulse amplitude is approximately equal to 38 µm. In Fig. 12(b), the peak to<br />
peak value of pulsation amplitude is approximately ranged from − 0.32 to 0.28 pixels. This means that<br />
the maximum variation in pulse amplitude of the tested subject after meal 30 min will increase to 48<br />
µm. An examination of Figs. 12(a) and 12(b) also observes that the pulse frequency measured at the<br />
Chun point of left hand of the tested subject is changed from 1.27 to 1.35 Hz.
Sensors 2007, 7 3378<br />
(a)<br />
(b)<br />
Figure 10. Full spectrum analysis of the data in Figure 9: (a) the results of without using filter and (b)<br />
the results of using filter.
Sensors 2007, 7 3379<br />
Figure 11. Illustration of palpation positions for pulse diagnosis used in traditional Chinese medicine.<br />
The other test showed that staying up late caused changes in the amplitude and frequency of the<br />
pulse at the Guan point of left hand. The pulsation at the Guan point of left hand is closely related to<br />
the liver activity. Without staying up late, the amplitude and frequency of the pulsation of the tested<br />
subject measured at Guan point were normal, as shown in Fig. 13(a). But after staying up late, it<br />
showed an apparent increase in the amplitude of measurement data, as shown in Fig. 13(b). In Fig.<br />
13(a), the peak to peak amplitude of pulsation measured at the Guan point on the left hand of the tested<br />
subject varies in small range, approximately equal to 0.2 pixels (i.e., equivalent to 19 µm). In Fig.<br />
13(b), for the tested subject staying up late the pulse variation in peak to peak amplitude measured at<br />
the Guan point enlarged approximately to 0.6 pixels (for most portion), which is equivalent to 57 µm.<br />
In this case, the pulse frequency is also changed from 1.29 to 1.64 Hz. In TCM practice, this<br />
measurement indicated the state of the liver’s health.<br />
5. Conclusions<br />
Based on optical laser triangulation theory, a non-invasive and non-contact arterial pulsation<br />
measurement (APM) system to detect micro-vibration on skin surface is developed in this work. The<br />
APM system consists chiefly of a laser diode and a CMOS image sensor, and the implementation cost<br />
is pretty low. An extensive series of experiments to evaluate the performance of the APM system was<br />
conducted. The pulse waveforms of the tested subject can be detected by our APM system easily. The<br />
APM system achieves a measurement resolution of µm order. Experimental results also show that the<br />
amplitude and frequency of the pulse of tester have been changed under different conditions. These<br />
tests demonstrate the performance of the proposed APM system for measuring micro-pulsation on skin<br />
surface is pretty good. If a speedier CMOS or CCD image sensor, such as 200 frames per second or<br />
more and a smaller pixel size can be used, the pulse waveform obtained by our APM system would be<br />
more accurate and clearer. To reduce the speckle effect of the laser, a non-coherent light could be
Sensors 2007, 7 3380<br />
(a)<br />
Figure 12. Pulse information measured at the Chun point on the left hand (small intestine) of the tested<br />
subject: (a) 30 min before a meal (to be continued).
Sensors 2007, 7 3381<br />
(b)<br />
Figure 12. Pulse information measured at the Chun point on the left hand (small intestine) of the tested<br />
subject (continued): (b) 30 min after a meal.
Sensors 2007, 7 3382<br />
(a)<br />
Figure 13. Pulse information for the Guan point on the left hand (liver) of the tested subject: (a) before<br />
staying up late (to be continued).
Sensors 2007, 7 3383<br />
(b)<br />
Figure 13. Pulse information for the Guan point on the left hand (liver) of the tested subject<br />
(continued): (b) after staying up late.
Sensors 2007, 7 3384<br />
chosen. This would also reduce the noise caused by laser light.<br />
Our experimental results have shown the feasibility of using the optical triangulation method and a<br />
CMOS image sensor to measure arterial pulsation. Although the demonstrated examples are not yet<br />
sufficient to clinical bearings, they serve to test the method and evaluate the performance of the<br />
proposed APM system. In the future, this arterial pulse measurement system can be improved by using<br />
3 light sources to simultaneously check the pulsation of three or six different TCM points on the wrist<br />
(i.e., Chun, Guan, and Chy points on one hand or two hands, respectively). And the relation between<br />
the pulse signal and the healthy condition of the subject will be established. We hope that we can<br />
report the investigation results in future.<br />
Acknowledgements<br />
The authors are grateful to the National Science Council of the Republic of China for financially<br />
supporting this research under contract no.: NSC 94-2213-E-002-120 and NSC 95-2218-E-002-073.<br />
References and Notes<br />
1. Martin, J. F.; Volfson, L. B.; Kirzon-Zolin, V.V.; Schukin,V.G. Application of pattern recognition<br />
and image classification techniques to determine continuous cardiac output from the arterial<br />
pressure waveform. IEEE Trans. Biomed. Eng. 1994, 41(10), 913-920.<br />
2. Fu, S. E.; Lai, S. P. A system for pulse measurement and analysis of Chinese medicine.<br />
Proceedings of IEEE Engineering in Medicine & Biology Society’s 11 th Annual International<br />
Conference 1989, 1695-1696.<br />
3. Min, S. G.; Yoon, D. H. Convergence characteristics of MADF algorithm in the pulse diagnostic<br />
apparatus. Proceedings of IEEE Region 10 Conference 1999, Vol. 2, 1551-1554.<br />
4. Yoon, S. H.; Koga, Y.; Matsumoto, I.; Ikezono, E. An objective method of pulse diagnosis.<br />
American J. of Chinese Medicine 1987, 15(3/4), 147-153.<br />
5. Lu, W.A.; Lin, Y.Y.; Wang, W. K. Pulse analysis of patients with severe liver problems. IEEE<br />
Eng. in Med. and Bio. 1999, 18(1), 73-75.<br />
6. Hong, H. D.; Fox, M. D. No touch pulse measurement by optical interferometry. IEEE Trans.<br />
Biomed. Eng. 1994, 41(11), 1096-1099.<br />
7. Sequeira, V.; Goncalves, J. G. H.; Isabel Ribeiro, M. 3D environment modeling using laser range<br />
sensing. Robotics and Autonomous Systems 1995, 16, 81-91.<br />
8. Amann, M. C.; Bosch, T.; Myllylä, R.; Rioux, M. Laser ranging: a critical review of usual<br />
techniques for distance measurement. Opt. Eng. 2001, 40(1), 10-19.<br />
9. Wu, J. H.; Horng, K. Y.; Chang, R. S. Triangulation-based range finder using a complementary<br />
metal-oxide semiconductor (CMOS) image sensor for application to automotive systems. Opt.<br />
Eng. 2006, 45(4), 043603, 1-7.<br />
10. Manneberg, G.; Hertegard, S.; Liljencrantz, J. Measurement of human vocal fold vibrations with<br />
laser triangulation. Opt. Eng. 2001, 40(9), 2041-2044.
Sensors 2007, 7 3385<br />
11. Agwani, S.; Domer, S.; Rubacha, R.; Stanley, S. High performance, VGA resolution digital color<br />
CMOS imager. Conference on Sensors, Cameras, and Systems for Scientific/Industrial<br />
Applications 1999, SPIE 3649, 154-164.<br />
12. Wong, H. S. Technology and device scaling considerations for CMOS imagers. IEEE Trans. on<br />
Electron Devices 1996, 43(12), 2131-2342.<br />
13. Wang, S. H. (265-317AD) The classic of the Pulse (in Chinese). reprinted by Wen Kuan<br />
Publishing Co., Taipei, Taiwan, ROC; 1972.<br />
14. Dharmananda, S. The significance of traditional pulse diagnosis in the modern practice of Chinese<br />
medicine. Institute for Traditional Medicine, Portland, Oregon, 2000. http://www.itmonline.org/<br />
arts/pulse.htm.<br />
15. Ramirez, R. W. The FFT Fundamentals and Concepts; Tektronix Inc.: Englewood Cliffs, New<br />
Jersey, 1986; pp 12-13.<br />
16. Dorsch, R. G.; Häusler, G.; Herrmann, J. M. Laser triangulation: fundamental uncertainty in<br />
distance measurement. Appl. Opt. 1994, 33 (7), 1306-1314.<br />
17. Fillard, J. P. Subpixel accuracy location estimation from digital signals. Opt. Eng. 1992, 31(11),<br />
2465-2471.<br />
18. Van Gemert, M. J. C.; Jacques, S. L.; Sterenborg, H. J. C. M.; Star, W. M. Skin optics. IEEE<br />
Trans. Biomed. Eng. 1989, 36(12), 1146-1154.<br />
© 2007 by MDPI (http://www.mdpi.org). Reproduction is permitted for noncommercial purposes.