Estimators based in adaptively trimming cells in the mixture model
Estimators based in adaptively trimming cells in the mixture model
Estimators based in adaptively trimming cells in the mixture model
Create successful ePaper yourself
Turn your PDF publications into a flip-book with our unique Google optimized e-Paper software.
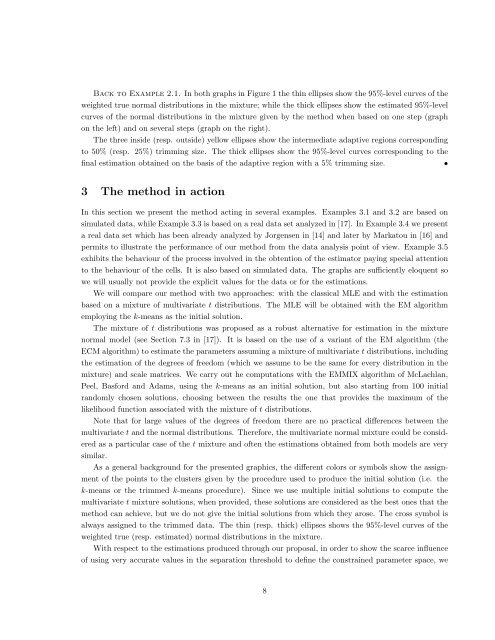
Back to Example 2.1. In both graphs <strong>in</strong> Figure 1 <strong>the</strong> th<strong>in</strong> ellipses show <strong>the</strong> 95%-level curves of <strong>the</strong><br />
weighted true normal distributions <strong>in</strong> <strong>the</strong> <strong>mixture</strong>; while <strong>the</strong> thick ellipses show <strong>the</strong> estimated 95%-level<br />
curves of <strong>the</strong> normal distributions <strong>in</strong> <strong>the</strong> <strong>mixture</strong> given by <strong>the</strong> method when <strong>based</strong> on one step (graph<br />
on <strong>the</strong> left) and on several steps (graph on <strong>the</strong> right).<br />
The three <strong>in</strong>side (resp. outside) yellow ellipses show <strong>the</strong> <strong>in</strong>termediate adaptive regions correspond<strong>in</strong>g<br />
to 50% (resp. 25%) trimm<strong>in</strong>g size. The thick ellipses show <strong>the</strong> 95%-level curves correspond<strong>in</strong>g to <strong>the</strong><br />
f<strong>in</strong>al estimation obta<strong>in</strong>ed on <strong>the</strong> basis of <strong>the</strong> adaptive region with a 5% trimm<strong>in</strong>g size.<br />
•<br />
3 The method <strong>in</strong> action<br />
In this section we present <strong>the</strong> method act<strong>in</strong>g <strong>in</strong> several examples. Examples 3.1 and 3.2 are <strong>based</strong> on<br />
simulated data, while Example 3.3 is <strong>based</strong> on a real data set analyzed <strong>in</strong> [17]. In Example 3.4 we present<br />
a real data set which has been already analyzed by Jorgensen <strong>in</strong> [14] and later by Markatou <strong>in</strong> [16] and<br />
permits to illustrate <strong>the</strong> performance of our method from <strong>the</strong> data analysis po<strong>in</strong>t of view. Example 3.5<br />
exhibits <strong>the</strong> behaviour of <strong>the</strong> process <strong>in</strong>volved <strong>in</strong> <strong>the</strong> obtention of <strong>the</strong> estimator pay<strong>in</strong>g special attention<br />
to <strong>the</strong> behaviour of <strong>the</strong> <strong>cells</strong>. It is also <strong>based</strong> on simulated data. The graphs are sufficiently eloquent so<br />
we will usually not provide <strong>the</strong> explicit values for <strong>the</strong> data or for <strong>the</strong> estimations.<br />
We will compare our method with two approaches: with <strong>the</strong> classical MLE and with <strong>the</strong> estimation<br />
<strong>based</strong> on a <strong>mixture</strong> of multivariate t distributions. The MLE will be obta<strong>in</strong>ed with <strong>the</strong> EM algorithm<br />
employ<strong>in</strong>g <strong>the</strong> k-means as <strong>the</strong> <strong>in</strong>itial solution.<br />
The <strong>mixture</strong> of t distributions was proposed as a robust alternative for estimation <strong>in</strong> <strong>the</strong> <strong>mixture</strong><br />
normal <strong>model</strong> (see Section 7.3 <strong>in</strong> [17]). It is <strong>based</strong> on <strong>the</strong> use of a variant of <strong>the</strong> EM algorithm (<strong>the</strong><br />
ECM algorithm) to estimate <strong>the</strong> parameters assum<strong>in</strong>g a <strong>mixture</strong> of multivariate t distributions, <strong>in</strong>clud<strong>in</strong>g<br />
<strong>the</strong> estimation of <strong>the</strong> degrees of freedom (which we assume to be <strong>the</strong> same for every distribution <strong>in</strong> <strong>the</strong><br />
<strong>mixture</strong>) and scale matrices. We carry out he computations with <strong>the</strong> EMMIX algorithm of McLachlan,<br />
Peel, Basford and Adams, us<strong>in</strong>g <strong>the</strong> k-means as an <strong>in</strong>itial solution, but also start<strong>in</strong>g from 100 <strong>in</strong>itial<br />
randomly chosen solutions, choos<strong>in</strong>g between <strong>the</strong> results <strong>the</strong> one that provides <strong>the</strong> maximum of <strong>the</strong><br />
likelihood function associated with <strong>the</strong> <strong>mixture</strong> of t distributions.<br />
Note that for large values of <strong>the</strong> degrees of freedom <strong>the</strong>re are no practical differences between <strong>the</strong><br />
multivariate t and <strong>the</strong> normal distributions. Therefore, <strong>the</strong> multivariate normal <strong>mixture</strong> could be considered<br />
as a particular case of <strong>the</strong> t <strong>mixture</strong> and often <strong>the</strong> estimations obta<strong>in</strong>ed from both <strong>model</strong>s are very<br />
similar.<br />
As a general background for <strong>the</strong> presented graphics, <strong>the</strong> different colors or symbols show <strong>the</strong> assignment<br />
of <strong>the</strong> po<strong>in</strong>ts to <strong>the</strong> clusters given by <strong>the</strong> procedure used to produce <strong>the</strong> <strong>in</strong>itial solution (i.e. <strong>the</strong><br />
k-means or <strong>the</strong> trimmed k-means procedure). S<strong>in</strong>ce we use multiple <strong>in</strong>itial solutions to compute <strong>the</strong><br />
multivariate t <strong>mixture</strong> solutions, when provided, <strong>the</strong>se solutions are considered as <strong>the</strong> best ones that <strong>the</strong><br />
method can achieve, but we do not give <strong>the</strong> <strong>in</strong>itial solutions from which <strong>the</strong>y arose. The cross symbol is<br />
always assigned to <strong>the</strong> trimmed data. The th<strong>in</strong> (resp. thick) ellipses shows <strong>the</strong> 95%-level curves of <strong>the</strong><br />
weighted true (resp. estimated) normal distributions <strong>in</strong> <strong>the</strong> <strong>mixture</strong>.<br />
With respect to <strong>the</strong> estimations produced through our proposal, <strong>in</strong> order to show <strong>the</strong> scarce <strong>in</strong>fluence<br />
of us<strong>in</strong>g very accurate values <strong>in</strong> <strong>the</strong> separation threshold to def<strong>in</strong>e <strong>the</strong> constra<strong>in</strong>ed parameter space, we<br />
8


