Using Cluster Analysis in Persona Development
Using Cluster Analysis in Persona Development
Using Cluster Analysis in Persona Development

Create successful ePaper yourself
Turn your PDF publications into a flip-book with our unique Google optimized e-Paper software.
can use the standard measurement scale tool to convert the<br />
responses <strong>in</strong>to the 1 to 7 rat<strong>in</strong>g. The questions asked were:<br />
1: If you are a teacher, what course do you prefer to teach?<br />
A: Courses discuss about facts<br />
B: Courses discuss about theory<br />
2: Which one do you th<strong>in</strong>k is a better compliment?<br />
A: You are rational<br />
B: You are emotional<br />
3: When mak<strong>in</strong>g a decision, which one is more important?<br />
A: Take all factors <strong>in</strong>to consideration<br />
B: Focus on the feel<strong>in</strong>gs and viewpo<strong>in</strong>ts of people.<br />
etc.<br />
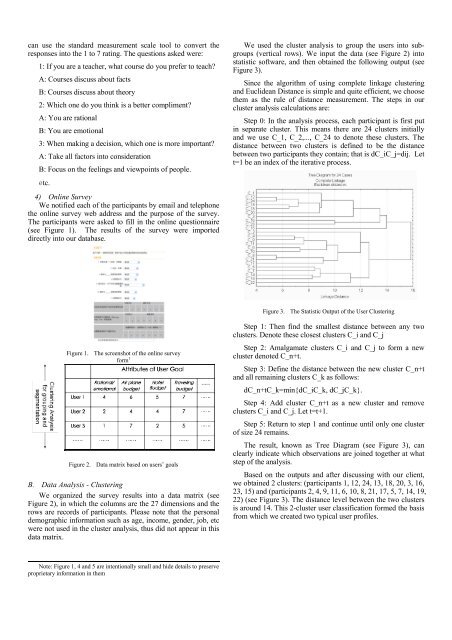
4) Onl<strong>in</strong>e Survey<br />
We notified each of the participants by email and telephone<br />
the onl<strong>in</strong>e survey web address and the purpose of the survey.<br />
The participants were asked to fill <strong>in</strong> the onl<strong>in</strong>e questionnaire<br />
(see Figure 1). The results of the survey were imported<br />
directly <strong>in</strong>to our database.<br />
We used the cluster analysis to group the users <strong>in</strong>to subgroups<br />
(vertical rows). We <strong>in</strong>put the data (see Figure 2) <strong>in</strong>to<br />
statistic software, and then obta<strong>in</strong>ed the follow<strong>in</strong>g output (see<br />
Figure 3).<br />
S<strong>in</strong>ce the algorithm of us<strong>in</strong>g complete l<strong>in</strong>kage cluster<strong>in</strong>g<br />
and Euclidean Distance is simple and quite efficient, we choose<br />
them as the rule of distance measurement. The steps <strong>in</strong> our<br />
cluster analysis calculations are:<br />
Step 0: In the analysis process, each participant is first put<br />
<strong>in</strong> separate cluster. This means there are 24 clusters <strong>in</strong>itially<br />
and we use C_1, C_2,..., C_24 to denote these clusters. The<br />
distance between two clusters is def<strong>in</strong>ed to be the distance<br />
between two participants they conta<strong>in</strong>; that is dC_iC_j=dij. Let<br />
t=1 be an <strong>in</strong>dex of the iterative process.<br />
Figure 3. The Statistic Output of the User <strong>Cluster</strong><strong>in</strong>g<br />
Figure 1. The screenshot of the onl<strong>in</strong>e survey<br />
form 1<br />
Figure 2. Data matrix based on users’ goals<br />
B. Data <strong>Analysis</strong> - <strong>Cluster</strong><strong>in</strong>g<br />
We organized the survey results <strong>in</strong>to a data matrix (see<br />
Figure 2), <strong>in</strong> which the columns are the 27 dimensions and the<br />
rows are records of participants. Please note that the personal<br />
demographic <strong>in</strong>formation such as age, <strong>in</strong>come, gender, job, etc<br />
were not used <strong>in</strong> the cluster analysis, thus did not appear <strong>in</strong> this<br />
data matrix.<br />
Step 1: Then f<strong>in</strong>d the smallest distance between any two<br />
clusters. Denote these closest clusters C_i and C_j<br />
Step 2: Amalgamate clusters C_i and C_j to form a new<br />
cluster denoted C_n+t.<br />
Step 3: Def<strong>in</strong>e the distance between the new cluster C_n+t<br />
and all rema<strong>in</strong><strong>in</strong>g clusters C_k as follows:<br />
dC_n+tC_k=m<strong>in</strong>{dC_iC_k, dC_jC_k}.<br />
Step 4: Add cluster C_n+t as a new cluster and remove<br />
clusters C_i and C_j. Let t=t+1.<br />
Step 5: Return to step 1 and cont<strong>in</strong>ue until only one cluster<br />
of size 24 rema<strong>in</strong>s.<br />
The result, known as Tree Diagram (see Figure 3), can<br />
clearly <strong>in</strong>dicate which observations are jo<strong>in</strong>ed together at what<br />
step of the analysis.<br />
Based on the outputs and after discuss<strong>in</strong>g with our client,<br />
we obta<strong>in</strong>ed 2 clusters: (participants 1, 12, 24, 13, 18, 20, 3, 16,<br />
23, 15) and (participants 2, 4, 9, 11, 6, 10, 8, 21, 17, 5, 7, 14, 19,<br />
22) (see Figure 3). The distance level between the two clusters<br />
is around 14. This 2-cluster user classification formed the basis<br />
from which we created two typical user profiles.<br />
Note: Figure 1, 4 and 5 are <strong>in</strong>tentionally small and hide details to preserve<br />
proprietary <strong>in</strong>formation <strong>in</strong> them