Substance Use and Abuse in Durham County - Stablerack
Substance Use and Abuse in Durham County - Stablerack
Substance Use and Abuse in Durham County - Stablerack

Create successful ePaper yourself
Turn your PDF publications into a flip-book with our unique Google optimized e-Paper software.
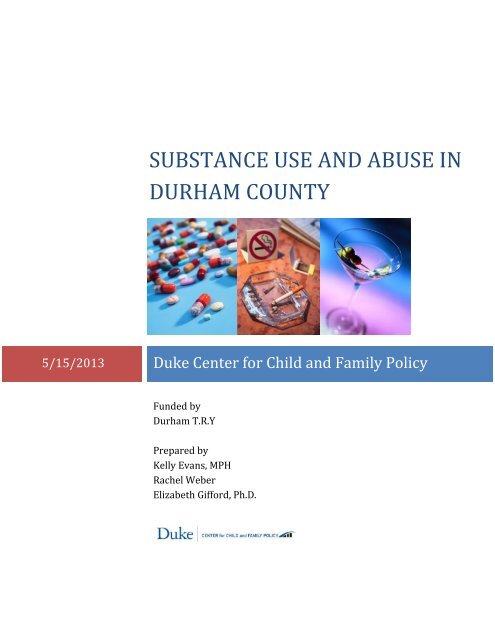
SUBSTANCE USE AND ABUSE IN<br />
DURHAM COUNTY<br />
5/15/2013 Duke Center for Child <strong>and</strong> Family Policy<br />
Funded by<br />
<strong>Durham</strong> T.R.Y<br />
Prepared by<br />
Kelly Evans, MPH<br />
Rachel Weber<br />
Elizabeth Gifford, Ph.D.
Contents<br />
EXECUTIVE SUMMARY ............................................................................................................. 5<br />
INTRODUCTION TO THE SURVEILLANCE NETWORK ............................................................. 9<br />
What are Surveillance Networks? ..................................................................................................... 9<br />
The Benefits of Surveillance Networks ........................................................................................... 10<br />
Underst<strong>and</strong><strong>in</strong>g the Community <strong>and</strong> the Community’s Needs ....................................................... 11<br />
DEMOGRAPHICS OF DURHAM COUNTY ................................................................................. 12<br />
SCOPE OF THE PROBLEM IN DURHAM COUNTY ................................................................... 13<br />
TRACKING THE PROBLEM...................................................................................................... 14<br />
Health-related Outcomes ................................................................................................................. 14<br />
Emergency Department Visits ...................................................................................................... 14<br />
Deaths Reported by the NC Office of the Chief Medical Exam<strong>in</strong>er ............................................. 15<br />
HIV <strong>and</strong> Injection Drug <strong>Use</strong> ........................................................................................................... 18<br />
<strong>Substance</strong> <strong>Abuse</strong> <strong>and</strong> Social Services .............................................................................................. 21<br />
Substantiated Cases <strong>in</strong> DSS ........................................................................................................... 21<br />
Homelessness................................................................................................................................. 22<br />
<strong>Substance</strong> <strong>Abuse</strong> <strong>and</strong> Law Enforcement ......................................................................................... 24<br />
Domestic Violence <strong>and</strong> the <strong>Durham</strong> Police Department ............................................................ 24<br />
Arrests <strong>in</strong> <strong>Durham</strong> <strong>County</strong> Related to Alcohol <strong>and</strong> Illicit <strong>Substance</strong>s ........................................ 26<br />
<strong>Substance</strong> <strong>Use</strong> Among Prison Inmates ......................................................................................... 30<br />
<strong>Substance</strong> <strong>Abuse</strong> Among <strong>Durham</strong> <strong>County</strong> Jail Inmates .............................................................. 32<br />
<strong>Substance</strong> <strong>Abuse</strong> among Adjudicated Juveniles .......................................................................... 34<br />
<strong>Substance</strong> <strong>Abuse</strong> <strong>in</strong> <strong>Durham</strong> Public Schools ................................................................................ 36<br />
Arrests on College Campuses ........................................................................................................ 38<br />
<strong>Substance</strong>-related calls to service to the <strong>Durham</strong> Sheriff’s Office ............................................. 40<br />
Prescription Drugs ........................................................................................................................... 42<br />
Prescription Drug <strong>Use</strong> <strong>in</strong> <strong>Durham</strong> <strong>County</strong> ................................................................................... 42<br />
Alcohol............................................................................................................................................... 44<br />
Prevalence of B<strong>in</strong>ge <strong>and</strong> Heavy Dr<strong>in</strong>k<strong>in</strong>g Among Adults ............................................................ 44<br />
Dr<strong>in</strong>k<strong>in</strong>g <strong>and</strong> Driv<strong>in</strong>g <strong>in</strong> <strong>Durham</strong> .................................................................................................. 46<br />
Smok<strong>in</strong>g ............................................................................................................................................. 52<br />
Prevalence of smok<strong>in</strong>g among adults <strong>and</strong> long-term health consequences ............................. 52<br />
Quitt<strong>in</strong>g Smok<strong>in</strong>g ........................................................................................................................... 58<br />
Youth <strong>and</strong> <strong>Substance</strong> <strong>Use</strong> ................................................................................................................. 59<br />
Prevalence of substance-related risk behaviors among middle <strong>and</strong> high school students ..... 59<br />
Youth Perception of Risk of Illicit <strong>Substance</strong>s ............................................................................. 62<br />
The Supply of Illicit Drugs ............................................................................................................... 62<br />
Drug Seizures <strong>in</strong> NC <strong>and</strong> the Atlanta HIDTA ................................................................................ 62<br />
Price of Drugs <strong>in</strong> <strong>Durham</strong> <strong>County</strong> ................................................................................................. 64<br />
Alcohol Beverage Control Board of Spirituous Liquor to the General Public ........................... 66<br />
Good Neighbor Initiative ............................................................................................................... 69<br />
<strong>Substance</strong> <strong>Use</strong> <strong>and</strong> <strong>Abuse</strong> <strong>in</strong> <strong>Durham</strong> <strong>County</strong> 2
TREATMENT SERVICES IN DURHAM COUNTY ....................................................................... 70<br />
Adolescents Receiv<strong>in</strong>g Treatment Services .................................................................................... 70<br />
Adults Receiv<strong>in</strong>g Treatment Services ............................................................................................. 72<br />
<strong>Substance</strong> <strong>Use</strong> Treatment Services for Individuals Involved <strong>in</strong> Del<strong>in</strong>quent or Crim<strong>in</strong>al Activities74<br />
DISCUSSION ............................................................................................................................ 76<br />
APPENDIX. .............................................................................................................................. 77<br />
Summary of change over time <strong>in</strong> substance use <strong>in</strong>dicators <strong>in</strong> <strong>Durham</strong>, NC ................................ 77<br />
REFERENCES ........................................................................................................................... 79<br />
<strong>Substance</strong> <strong>Use</strong> <strong>and</strong> <strong>Abuse</strong> <strong>in</strong> <strong>Durham</strong> <strong>County</strong> 3
Acknowledgements<br />
A large number of <strong>in</strong>dividuals <strong>and</strong> agencies were heavily <strong>in</strong>volved <strong>in</strong> prepar<strong>in</strong>g this report.<br />
We’d like to thank all of the agencies <strong>and</strong> data specialists who provided their time, <strong>in</strong>formation,<br />
<strong>and</strong> expertise.<br />
Patricia Barnes – State Medical Exam<strong>in</strong>er’s Office<br />
Dr. Lana Deyneka – NC Disease Event Track<strong>in</strong>g <strong>and</strong> Epidemiologic Collection Tool<br />
Jenna Waggoner – NC Communicable Disease Branch<br />
Martha Buie – NC Communicable Disease Branch<br />
Jason Maxwell – NC Communicable Disease Branch<br />
Kammie Michael – <strong>Durham</strong> Police Department<br />
Rebecca Hartigan – <strong>Durham</strong> <strong>County</strong> Sheriff’s Department<br />
Mel Downey-Piper – Partnership for a Healthy <strong>Durham</strong><br />
Erika Samoff – Partnership for a Healthy <strong>Durham</strong><br />
Tanya Griffis – NC Department of Juvenile Justice <strong>and</strong> Del<strong>in</strong>quency Prevention<br />
Megan Howell – NC Department of Juvenile Justice <strong>and</strong> Del<strong>in</strong>quency Prevention<br />
Nicole Sullivan – NC Department of Corrections<br />
David Edwards – NC Department of Public Safety<br />
T<strong>in</strong>a Howard – Alliance Behavioral HealthCare<br />
Heather Bohanan – N.C. Department of Health <strong>and</strong> Human Services<br />
<strong>Substance</strong> <strong>Use</strong> <strong>and</strong> <strong>Abuse</strong> <strong>in</strong> <strong>Durham</strong> <strong>County</strong> 4
Executive Summary<br />
Accord<strong>in</strong>g to the North Carol<strong>in</strong>a (NC) Division of Mental Health, Developmental Disabilities <strong>and</strong><br />
<strong>Substance</strong> <strong>Abuse</strong> Services, approximately 18,000 adults <strong>and</strong> 1,000 children <strong>in</strong> <strong>Durham</strong> <strong>County</strong><br />
were abused or addicted to illegal drugs, prescription medications, or alcohol <strong>in</strong> 2012(1).<br />
<strong>Substance</strong> abuse not only impacts the <strong>in</strong>dividual <strong>and</strong> his/her family, but also the community.<br />
This report compiles <strong>in</strong>formation from a variety of agencies <strong>and</strong> sources on how substance use<br />
<strong>and</strong> abuse is affect<strong>in</strong>g <strong>Durham</strong> <strong>County</strong>. This report follows a strategy suggested by the National<br />
Institute of Drug <strong>Abuse</strong> for community surveillance. By exam<strong>in</strong><strong>in</strong>g <strong>in</strong>formation from a variety of<br />
sources such as law enforcement agencies, treatment providers, <strong>in</strong>formation on self-reported<br />
prevalence of use, drug seizures, <strong>and</strong> motor vehicle accidents, a better underst<strong>and</strong><strong>in</strong>g of the<br />
substance use problem <strong>in</strong> the community becomes apparent.<br />
Health Related Outcomes<br />
<strong>Substance</strong> use <strong>and</strong> abuse affects <strong>in</strong>jury rates, death rates, decision mak<strong>in</strong>g, health <strong>and</strong> mental<br />
health. One <strong>in</strong>dicator that is useful for track<strong>in</strong>g trends is emergency room visits related to<br />
substance use. Between 2010 <strong>and</strong> 2012, there were over 3,000 admissions a year for <strong>Durham</strong><br />
residents to the emergency department for substance-related conditions. For adults, there was an<br />
<strong>in</strong>crease of 11.6% <strong>in</strong> the number of admissions between 2010 <strong>and</strong> 2012. Dur<strong>in</strong>g this same time<br />
period, the number of admissions for juveniles <strong>in</strong>creased 64.7%. The number of deaths related to<br />
substance use <strong>in</strong>creased 33% from 2004-06 which averaged 34.3 deaths to 2009-11 which<br />
averaged 45.7 deaths per year. Dur<strong>in</strong>g this same time period deaths associated with prescription<br />
drugs were up 75%, with alcohol were up 30%, with hero<strong>in</strong>e up 17%, <strong>and</strong> with coca<strong>in</strong>e down<br />
10%. A third <strong>in</strong>dicator is the number of new transmissions of HIV related to <strong>in</strong>jection drug use.<br />
This is an important <strong>in</strong>dicator because <strong>Durham</strong> <strong>County</strong> consistently ranks as one of the top four<br />
counties <strong>in</strong> the state with the highest HIV rate. Fortunately, it appears that <strong>in</strong>jection drug use is not<br />
as directly related to new HIV <strong>in</strong>fections as it had been <strong>in</strong> the early 1990s. Of the 73 newly<br />
diagnosed cases <strong>in</strong> 2011, fewer than five were thought to be transmitted through <strong>in</strong>jection drug<br />
use. It is worth not<strong>in</strong>g that the mode of transmission was miss<strong>in</strong>g for one third of the new cases <strong>in</strong><br />
2011. Also, because substance use may <strong>in</strong>crease risky behaviors such as sexual practices, it may<br />
<strong>in</strong>directly affect HIV transmissions.<br />
Social Services<br />
National data suggest that substance abuse is associated with child maltreatment <strong>and</strong> placement<br />
of children <strong>in</strong>to foster care. While we do not have data to illustrate the impact of substance use on<br />
all child maltreatment <strong>in</strong> <strong>Durham</strong> <strong>County</strong>, we do know that, <strong>in</strong> 2008, 40% of children were placed<br />
<strong>in</strong> foster care due their parent’s drug or alcohol abuse as a primary or contributory factor. Data<br />
from the Department of Social Services show that the number of substantiated cases where<br />
<strong>Substance</strong> <strong>Use</strong> <strong>and</strong> <strong>Abuse</strong> <strong>in</strong> <strong>Durham</strong> <strong>County</strong> 5
substance abuse was <strong>in</strong>dicated decreased by 85% between 2006 <strong>and</strong> 2007. S<strong>in</strong>ce 2007, the<br />
number of substantiated cases has rema<strong>in</strong>ed relatively the same.<br />
Homelessness<br />
The number of homeless <strong>in</strong>dividuals <strong>in</strong> <strong>Durham</strong> <strong>County</strong> has <strong>in</strong>creased 45% based on three year<br />
mov<strong>in</strong>g average from 466 <strong>in</strong>dividuals <strong>in</strong> 2001-03 to 675 <strong>in</strong> 2010-2012. In 2012 about 47% of the<br />
homeless were identified as hav<strong>in</strong>g a substance use problem.<br />
Law Enforcement <strong>and</strong> <strong>Substance</strong> <strong>Use</strong> Issues<br />
Many <strong>in</strong>dividuals abus<strong>in</strong>g substances come to the attention of law enforcement <strong>and</strong> the court<br />
system. Total number of arrests for sales of drugs <strong>in</strong> <strong>Durham</strong> was down 36% from an average of<br />
469 <strong>in</strong> 2000-02 to 303 <strong>in</strong> 2009-11. Dur<strong>in</strong>g this time period arrests for possession of drugs was<br />
down 4%, juvenile arrests for alcohol related charges was down 57% <strong>and</strong> for drug-related charges<br />
was down 36%. However calls to service related to substance use was up 35% from 417 <strong>in</strong> 2000-<br />
2003 to 561 <strong>in</strong> 2010-2012. Calls to service for alcohol-related <strong>in</strong>cidents peak dur<strong>in</strong>g late night<br />
Friday <strong>and</strong> Saturday night <strong>and</strong> early Saturday <strong>and</strong> Sunday morn<strong>in</strong>gs. Calls to service related to<br />
drugs are more frequent midweek <strong>in</strong> the late afternoon—peak<strong>in</strong>g Wednesdays from 3pm-6pm.<br />
Arrests to adults for driv<strong>in</strong>g under the <strong>in</strong>fluence were down 33% from an average of 705 <strong>in</strong> 2004-<br />
2006 to 473 <strong>in</strong> 2009-2011. Total number of alcohol related crashes was down 2% from 290 <strong>in</strong><br />
2004-06 to 285 <strong>in</strong> 2009-11. However, the average number of deaths related to alcohol crashes<br />
<strong>in</strong>creased from 4.3 <strong>in</strong> 2004-06 to 6.0 <strong>in</strong> 2009-11. Because the numbers of deaths are small, it is<br />
difficult to determ<strong>in</strong>e if this is a trend or a spurious event but because of the severity it is worth<br />
watch<strong>in</strong>g.<br />
<strong>Durham</strong> Public Schools reported that students’ possession of a controlled substance made up 41%<br />
of all reportable offenses on school grounds. Not surpris<strong>in</strong>gly, reportable offenses for alcohol or<br />
other substances are more likely to occur on high school grounds than middle school grounds.<br />
36% of prison <strong>in</strong>mates from <strong>Durham</strong> <strong>and</strong> 40% of <strong>in</strong>mates <strong>in</strong> the <strong>Durham</strong> <strong>County</strong> jail were<br />
convicted of a drug offense. Over 60% of prison <strong>in</strong>mates needed substance abuse treatment. The<br />
data of youth <strong>in</strong>volved with juvenile justice mirror the f<strong>in</strong>d<strong>in</strong>gs <strong>in</strong> the adults system—with an<br />
estimated 43 – 56% <strong>in</strong> need of substance abuse treatment.<br />
Prescription Drugs<br />
Prescription drugs are emerg<strong>in</strong>g as a public health threat. In 2011, 16 <strong>Durham</strong> residents died from<br />
overdoses to prescription drugs. From 2004-11, 29% of tox<strong>in</strong>-related deaths were attributable to<br />
prescription drugs (42% were due to alcohol, 21% from coca<strong>in</strong>e <strong>and</strong> 6% from hero<strong>in</strong>). In 2011,<br />
<strong>Substance</strong> <strong>Use</strong> <strong>and</strong> <strong>Abuse</strong> <strong>in</strong> <strong>Durham</strong> <strong>County</strong> 6
accord<strong>in</strong>g to data from the Youth Risk Behavior Survey, 5.3% of middle school students reported<br />
tak<strong>in</strong>g a prescription drug without a doctor’s prescription <strong>and</strong> 21.7% of high school students<br />
report<strong>in</strong>g do<strong>in</strong>g this.<br />
Alcohol<br />
While the rate of b<strong>in</strong>ge <strong>and</strong> heavy dr<strong>in</strong>k<strong>in</strong>g <strong>in</strong> <strong>Durham</strong> is similar to the state rate, the consequences<br />
of the behavior may seriously impact health. Accord<strong>in</strong>g to data from the Behavioral Risk Factor<br />
Surveillance Survey (BRFSS) <strong>in</strong> 2011, 15.5% of <strong>Durham</strong> residents reported b<strong>in</strong>ge dr<strong>in</strong>k<strong>in</strong>g <strong>and</strong><br />
4.5% reported heavy dr<strong>in</strong>k<strong>in</strong>g. Dr<strong>in</strong>k<strong>in</strong>g also impairs the driver’s ability to safely operate a vehicle.<br />
In 2011, there were 12 fatal car accidents <strong>in</strong> <strong>Durham</strong> <strong>County</strong> <strong>and</strong> one third (four accidents) were<br />
related to alcohol. Moreover, accord<strong>in</strong>g to the 2010 BRFSS, 2.3% of <strong>Durham</strong> residents report<br />
hav<strong>in</strong>g driven after hav<strong>in</strong>g had too much to dr<strong>in</strong>k.<br />
Smok<strong>in</strong>g<br />
Smok<strong>in</strong>g is the lead<strong>in</strong>g cause of preventable death. Lung cancer is the most common form of<br />
cancer nationally <strong>and</strong> <strong>in</strong> <strong>Durham</strong>. Cancer is the lead<strong>in</strong>g cause of death for <strong>Durham</strong> residents.<br />
Smok<strong>in</strong>g is an attributable cause of lung cancer <strong>in</strong> 90% of cases. In 2011, approximately 12.4% of<br />
<strong>Durham</strong> residents are current smokers <strong>and</strong> 8.9% report smok<strong>in</strong>g every day. Smok<strong>in</strong>g dur<strong>in</strong>g<br />
pregnancy can harm the unborn child. Across NC, s<strong>in</strong>ce 1998, there has been a decl<strong>in</strong>e <strong>in</strong> smok<strong>in</strong>g<br />
dur<strong>in</strong>g pregnancy. The percent of women who smoke dur<strong>in</strong>g pregnancy is lower <strong>in</strong> <strong>Durham</strong> than<br />
<strong>in</strong> the rest of the state (5.6% vs. 10.9% <strong>in</strong> 2011). However, the percent of m<strong>in</strong>ority women who<br />
smoke dur<strong>in</strong>g pregnancy <strong>in</strong> recent years <strong>in</strong> <strong>Durham</strong> has <strong>in</strong>creased.<br />
Youth <strong>and</strong> <strong>Substance</strong> <strong>Use</strong><br />
<strong>Substance</strong> use is prevalent among our youth, yet comparable to the state rates. Results from the<br />
Youth Risk Behavior Survey suggest that 30% of middle school students ever had a dr<strong>in</strong>k of<br />
alcohol. Among high students, 36% reported hav<strong>in</strong>g a dr<strong>in</strong>k of alcohol <strong>in</strong> the past 30 days <strong>and</strong> 32%<br />
reported us<strong>in</strong>g marijuana <strong>in</strong> the past 30 days. Compared to 2009, high school students <strong>in</strong> 2011<br />
were more likely to report dr<strong>in</strong>k<strong>in</strong>g <strong>and</strong> us<strong>in</strong>g marijuana on school property.<br />
Supply of Illicit <strong>Substance</strong>s<br />
The supply of drugs <strong>and</strong> alcohol <strong>in</strong> our community helps to identify trends <strong>in</strong> the abuse <strong>and</strong> use of<br />
the substances. In general, the amount of drugs seized <strong>in</strong> the last 6 months <strong>in</strong> the Triangle area<br />
seems to be relatively low, but that does not necessarily mean the drugs are not available <strong>in</strong> high<br />
quantities. The price of the substances tends to directly impact dem<strong>and</strong>. The <strong>Durham</strong> <strong>County</strong><br />
Sheriff’s Office reports that the price of hero<strong>in</strong> <strong>in</strong> 2013 is lower than it was <strong>in</strong> 2006 while the price<br />
of crack has rema<strong>in</strong>ed relatively constant at $20 a rock (1 rock=1 dose). Marijuana <strong>and</strong> many<br />
prescription drugs; like Oxycodone, Oxytoc<strong>in</strong>, Vicod<strong>in</strong> <strong>and</strong> Percocet; are priced low ($3 -<br />
<strong>Substance</strong> <strong>Use</strong> <strong>and</strong> <strong>Abuse</strong> <strong>in</strong> <strong>Durham</strong> <strong>County</strong> 7
$20/dose). The price of high grade marijuana has <strong>in</strong>creased slightly s<strong>in</strong>ce 2006. Liquor is managed<br />
by local Alcohol Beverage Control (ABC) Boards. S<strong>in</strong>ce 2009, approximately $20 million is spent<br />
on liquor <strong>in</strong> <strong>Durham</strong> <strong>County</strong> each year. This is up from $17.8 million (<strong>in</strong> 2012 dollars) <strong>in</strong> 2008.<br />
Treatment Services <strong>in</strong> <strong>Durham</strong> <strong>County</strong><br />
In 2012 <strong>Durham</strong> <strong>County</strong> transitioned from a Local Management Entity (LME) for manag<strong>in</strong>g<br />
behavioral health treatment (The <strong>Durham</strong> Center) to a Managed Care Organization (MCO),<br />
Alliance Behavioral Healthcare. Alliance Behavioral Healthcare does not provide services, but<br />
refers <strong>and</strong> connects <strong>in</strong>dividuals to services <strong>in</strong> <strong>Durham</strong> <strong>County</strong>.<br />
The <strong>Durham</strong> <strong>County</strong> Crim<strong>in</strong>al Justice Resource Center (CJRC) partners with Alliance Behavioral<br />
Healthcare <strong>and</strong> Drug Treatment Court to provide direct services to <strong>in</strong>dividuals who are<br />
<strong>in</strong>carcerated or have crim<strong>in</strong>al histories. When The <strong>Durham</strong> Center transitioned from a Local<br />
Management Entity to an <strong>in</strong>dependent Managed Care Organization (MCO), several changes<br />
occurred with<strong>in</strong> the CJRC, as previously they had shared <strong>and</strong> operated various services for the<br />
<strong>Durham</strong> Center. After the end of fiscal year 2012, the <strong>Durham</strong> Assessment Team <strong>and</strong> Court<br />
Screen<strong>in</strong>gs services ended due to chang<strong>in</strong>g budget priorities for Alliance Behavioral Healthcare.<br />
CJRC operates <strong>Durham</strong> Drug Court, <strong>and</strong> between Oct 2011 <strong>and</strong> June 2012, Drug Treatment Court<br />
served 47 offenders.<br />
Among youth <strong>in</strong> treatment for substance use, 78% used marijuana <strong>in</strong> the past year, 50% used<br />
tobacco, <strong>and</strong> 56% used alcohol. Adults <strong>in</strong> substance use treatment reported us<strong>in</strong>g tobacco (68%),<br />
alcohol (54%), coca<strong>in</strong>e (47%), marijuana (45%), other opiates (15%), hero<strong>in</strong> (13%), oxycont<strong>in</strong><br />
(6%), benzodiazep<strong>in</strong>e (5%), <strong>and</strong> over the counter drugs (2%).<br />
How to <strong>Use</strong> this Report<br />
For this report to be most useful <strong>in</strong> underst<strong>and</strong><strong>in</strong>g how substance use is affect<strong>in</strong>g <strong>Durham</strong> <strong>and</strong> for<br />
plann<strong>in</strong>g prevention <strong>and</strong> <strong>in</strong>tervention efforts, it is important for community members to read,<br />
reflect, <strong>and</strong> communicate with others about the report. Community members will have additional<br />
<strong>in</strong>formation to contribute such as changes <strong>in</strong> policies, programs, practices <strong>and</strong> fund<strong>in</strong>g that are<br />
caus<strong>in</strong>g shifts <strong>in</strong> trends.<br />
<strong>Substance</strong> <strong>Use</strong> <strong>and</strong> <strong>Abuse</strong> <strong>in</strong> <strong>Durham</strong> <strong>County</strong> 8
Introduction to the Surveillance Network<br />
<strong>Substance</strong> abuse affects many aspects of society, <strong>in</strong>clud<strong>in</strong>g but not limited to: health care, crime<br />
rates, unemployment, education, <strong>and</strong> family life. Many of us have seen unpleasant evidence<br />
through our personal experiences <strong>and</strong> from the experiences of family <strong>and</strong> friends. While agencies<br />
<strong>and</strong> <strong>in</strong>dividuals <strong>in</strong> our community are mak<strong>in</strong>g real strides <strong>in</strong> address<strong>in</strong>g issues related to<br />
substance abuse, our community’s responses are often hampered by our collective difficulty to<br />
view these issues comprehensively. Look<strong>in</strong>g <strong>in</strong> isolation at each problem caused by substance<br />
abuse is often <strong>in</strong>adequate to capture the dist<strong>in</strong>ctions required to shape effective local strategies. It<br />
is the Surveillance Network’s desire that both citizens <strong>and</strong> agencies come to underst<strong>and</strong> the full<br />
scope of problems associated with substance abuse <strong>and</strong> not only the problems plagu<strong>in</strong>g “their”<br />
organization <strong>and</strong>/or community.<br />
The National Institute of Drug <strong>Abuse</strong>’s Community Epidemiology Work Group (NIDA-CEWG)<br />
developed the model <strong>Substance</strong> <strong>Abuse</strong> Surveillance Network to generate <strong>in</strong>formation that would<br />
help communities address the wide range of problems caused by substance abuse(2). This report<br />
builds on the <strong>Durham</strong> <strong>County</strong> 2007 <strong>and</strong> 2010 report(3, 4).<br />
What are Surveillance Networks?<br />
The National Institute on Drug <strong>Abuse</strong> def<strong>in</strong>es a surveillance network as follows:<br />
“Community Epidemiology Surveillance Networks are multi-agency work groups with a public-health<br />
orientation which study the spread, growth, or development of drug abuse <strong>and</strong> related problems. The<br />
networks have a common goal - the elim<strong>in</strong>ation or reduction of drug abuse <strong>and</strong> its related<br />
consequences” (5).<br />
The network creates a resource shar<strong>in</strong>g system for different k<strong>in</strong>ds of groups, <strong>in</strong>clud<strong>in</strong>g but not<br />
limited to: public health officials, law enforcement agencies, hospitals, <strong>and</strong> schools. It could <strong>in</strong>clude<br />
bus<strong>in</strong>esses, churches, <strong>and</strong> other civic organizations. This <strong>in</strong>formation can be supplemented with<br />
the results of local household surveys that provide community estimates of specific behaviors<br />
among subpopulations. Representatives from all respective agencies meet regularly to discuss<br />
data implications <strong>and</strong> create a st<strong>and</strong>ard template for data report<strong>in</strong>g.<br />
After complet<strong>in</strong>g the report from accumulated data, the team dissem<strong>in</strong>ates the results to vast<br />
audiences. In order to dissem<strong>in</strong>ate the results to the maximum number of stakeholders, the results<br />
should be distributed frequently <strong>in</strong> a format that is easily underst<strong>and</strong>able. This <strong>in</strong>cludes provid<strong>in</strong>g<br />
both quantitative <strong>and</strong> qualitative <strong>in</strong>formation.<br />
Surveillance networks have long been used by major cities <strong>in</strong> the U.S. such as Boston <strong>and</strong> New<br />
York, to name a few (2). These networks are able to identify current patterns of drug abuse <strong>and</strong><br />
identify emerg<strong>in</strong>g trends such as a new (or revival of an old) drug to a community.<br />
<strong>Substance</strong> <strong>Use</strong> <strong>and</strong> <strong>Abuse</strong> <strong>in</strong> <strong>Durham</strong> <strong>County</strong> 9
The network’s objectives are designed to focus on problems specific to a particular area. NIDA lists<br />
the follow<strong>in</strong>g objectives <strong>in</strong> their model description:<br />
1) Identify drug abuse patterns <strong>in</strong> specific geographic areas;<br />
2) Identify changes <strong>in</strong> drug abuse patterns with the aim of f<strong>in</strong>d<strong>in</strong>g patterns <strong>and</strong> trends over<br />
time;<br />
3) Detect emerg<strong>in</strong>g substance abuse trends <strong>and</strong> consequences for the community; <strong>and</strong><br />
4) Distribute all acquired <strong>in</strong>formation to as many bodies as possible for policy use, research,<br />
general public knowledge, <strong>and</strong> prevention strategies.<br />
The Benefits of Surveillance Networks<br />
<strong>Substance</strong> abuse is a dynamic problem. Over time, changes occur <strong>in</strong> the types of substances, the<br />
populations most affected by different drugs, <strong>and</strong> the locations where the drugs are bought <strong>and</strong><br />
sold. Thus, <strong>in</strong> order to use community resources efficiently, it is important to identify the<br />
“problem” as precisely as possible <strong>and</strong> then choose the appropriate <strong>in</strong>tervention strategy for the<br />
community. Surveillance networks are designed to help communities target resources as<br />
efficiently as possible.<br />
Surveillance networks are particularly efficient at identify<strong>in</strong>g trends early as the problem is<br />
emerg<strong>in</strong>g. With substances, early detection is imperative because addiction <strong>and</strong> dependency<br />
spread rapidly with time, further<strong>in</strong>g associated problems (health, crime, etc.). Early detection<br />
helps all sectors mobilize resources for prevention <strong>and</strong> allows treatment professionals, law<br />
enforcement, <strong>and</strong> medical professionals to get a better idea about the k<strong>in</strong>ds of problems they are<br />
likely to face.<br />
The other advantages of a network go beyond simply provid<strong>in</strong>g accurate data. For the most part,<br />
they are <strong>in</strong>expensive <strong>and</strong> self-susta<strong>in</strong><strong>in</strong>g. A few committed members from each organization can<br />
easily gather data for comparison <strong>and</strong> analysis. In addition, most network members are already<br />
likely to be already engaged <strong>in</strong> prevention. Therefore, the network exposes members to more<br />
perspectives, <strong>in</strong>formation, <strong>and</strong> immediate feedback about changes that may be occurr<strong>in</strong>g.<br />
As new members are added to the network, the community ga<strong>in</strong>s additional <strong>in</strong>formation. At the<br />
local level, shar<strong>in</strong>g <strong>in</strong>formation across agencies allows for trends to be identified early <strong>and</strong><br />
appropriate strategies to be developed <strong>in</strong> a timely fashion. On a broader level, networks can share<br />
<strong>in</strong>formation with other communities, such as effective <strong>in</strong>terventions <strong>and</strong> strategies. For example, if<br />
a network established <strong>in</strong> Pleasantville had successfully halted the <strong>in</strong>troduction of drug “x” <strong>in</strong>to its<br />
community, this approach becomes a case study when that drug is identified as an issue <strong>in</strong><br />
<strong>Durham</strong> or other surround<strong>in</strong>g counties.<br />
<strong>Substance</strong> <strong>Use</strong> <strong>and</strong> <strong>Abuse</strong> <strong>in</strong> <strong>Durham</strong> <strong>County</strong> 10
In summary, surveillance networks are <strong>in</strong>expensive, efficient, <strong>and</strong> accurate. The <strong>in</strong>itial<br />
implementation requires little, aside from a place to meet <strong>and</strong> community members’ time.<br />
Networks help identify problems that are endemic to a particular area <strong>and</strong>, <strong>in</strong> turn, provide exactly<br />
the form of data that is needed to address a problem as complex as drug <strong>and</strong> substance abuse.<br />
Underst<strong>and</strong><strong>in</strong>g the Community <strong>and</strong> the Community’s Needs<br />
The next section of the report beg<strong>in</strong>s with a description of the demographics of <strong>Durham</strong> <strong>County</strong>.<br />
Follow<strong>in</strong>g a description of who lives <strong>in</strong> <strong>Durham</strong>, the report exam<strong>in</strong>es the various health-related<br />
dataset that demonstrate how the community is affected. These <strong>in</strong>clude emergency department<br />
visits, deaths reported by the state medical exam<strong>in</strong>er, <strong>and</strong> HIV <strong>and</strong> <strong>in</strong>jection drug use.<br />
The next section of the report focuses on data provided by law enforcement agencies. This<br />
<strong>in</strong>cludes calls to police for domestic violence cases, arrests related to possession <strong>and</strong> sales of illicit<br />
substances, as well as liquor law violations <strong>and</strong> drunk driv<strong>in</strong>g, substance use among adjudicated<br />
youth, <strong>and</strong> arrests on public middle <strong>and</strong> high school <strong>and</strong> college campuses.<br />
The next section discusses the prevalence of alcohol as well as some of the harms most directly<br />
associated with dr<strong>in</strong>k<strong>in</strong>g, such as deaths related to dr<strong>in</strong>k<strong>in</strong>g <strong>and</strong> driv<strong>in</strong>g <strong>in</strong> <strong>Durham</strong> <strong>County</strong>. Much<br />
of the <strong>in</strong>formation regard<strong>in</strong>g the prevalence of heavy dr<strong>in</strong>k<strong>in</strong>g comes from the Behavioral Risk<br />
Factor Surveillance Survey.<br />
The follow<strong>in</strong>g section focuses on the prevalence of smok<strong>in</strong>g <strong>and</strong> other use of tobacco products <strong>and</strong><br />
the associated harms.<br />
The next section focuses on the prevalence of substance-related behaviors among middle <strong>and</strong> high<br />
school students. This <strong>in</strong>formation comes from the Youth Risk Behavior Survey.<br />
The next section focuses on services that are available for <strong>Durham</strong> residents. This <strong>in</strong>formation<br />
provides some <strong>in</strong>sight <strong>in</strong>to those need<strong>in</strong>g substance abuse treatment.<br />
The last section of the report describes the supply of drugs <strong>in</strong> <strong>Durham</strong> <strong>County</strong>. The U.S. Office of<br />
National Drug Control Policy considers <strong>Durham</strong> <strong>County</strong> to be part of the Atlanta High Intensity<br />
Drug Traffick<strong>in</strong>g Area. This section provides <strong>in</strong>sight from federal agencies that are conduct<strong>in</strong>g<br />
surveillance on what drugs are flow<strong>in</strong>g through the community. Also <strong>in</strong>cluded is the price of illicit<br />
drugs <strong>in</strong> <strong>Durham</strong> <strong>County</strong>.<br />
<strong>Substance</strong> <strong>Use</strong> <strong>and</strong> <strong>Abuse</strong> <strong>in</strong> <strong>Durham</strong> <strong>County</strong> 11
Population (<strong>in</strong> 1,000's)<br />
Demographics of <strong>Durham</strong> <strong>County</strong><br />
Underst<strong>and</strong><strong>in</strong>g the demographics of a community is helpful for underst<strong>and</strong><strong>in</strong>g the population’s<br />
needs. This <strong>in</strong>formation can be helpful <strong>in</strong> plann<strong>in</strong>g prevention <strong>and</strong> services. Accord<strong>in</strong>g to the 2010<br />
U.S. Census, the estimated population of <strong>Durham</strong> <strong>County</strong> <strong>in</strong> 2011 was 273,392 (6). Children under<br />
the age of 18 account for 22.7% of <strong>Durham</strong>’s population (vs. 23.7% <strong>in</strong> NC), while those over the<br />
age of 65 account for 10.0% (vs. 13.2% <strong>in</strong> NC) (6).<br />
<strong>Durham</strong> is particularly diverse when compared to NC as a whole. Accord<strong>in</strong>g to projections of the<br />
2010 Census, <strong>in</strong> 2011 half of <strong>Durham</strong> was White (53.5%), relative to 72.1% of NC; 38.5% African-<br />
American, relative to 22.0% of the state; 13.5% Hispanic or Lat<strong>in</strong>o orig<strong>in</strong>, compared to 8.6% <strong>in</strong> NC;<br />
<strong>and</strong> 4.7% Asian, relative to 2.3% <strong>in</strong> the state (6). Moreover, 14.0% of people <strong>in</strong> <strong>Durham</strong> reported<br />
be<strong>in</strong>g foreign born which is nearly double the statewide figure of 7.4%(6, 7).<br />
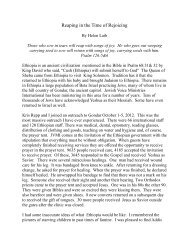
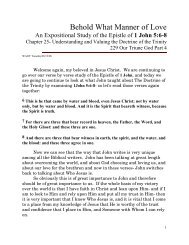
Figure 1 shows how the population of <strong>Durham</strong> <strong>County</strong> has grown from 2000 to 2011. Over this<br />
time the population of <strong>Durham</strong> <strong>County</strong> grew by about 22%. While the total population <strong>in</strong> each of<br />
the racial <strong>and</strong> ethnic populations has <strong>in</strong>creased, the growth <strong>in</strong> the Hispanic population has grown<br />
from 8% of the population to 13% (a 112% growth rate) (8).<br />
120<br />
108,925<br />
White- Not Hispanic,<br />
117,861<br />
100<br />
80<br />
89,537 Black- Not Hispanic,<br />
104,594<br />
60<br />
40<br />
20<br />
0<br />
17,431<br />
7,977<br />
Hispanic- All Races,<br />
36,893<br />
Asian or Pacific<br />
Isl<strong>and</strong>er- Not Hispanic,<br />
13,070<br />
2000 2001 2002 2003 2004 2005 2006 2007 2008 2009 2010 2011<br />
Source: USDHHS, CDC, NCHS, Bridged-Race Population Estimates<br />
[Figure 1]<br />
<strong>Durham</strong> <strong>County</strong> population growth by race/ethnicity, 2000-2011<br />
<strong>Substance</strong> <strong>Use</strong> <strong>and</strong> <strong>Abuse</strong> <strong>in</strong> <strong>Durham</strong> <strong>County</strong> 12
<strong>Durham</strong> is generally better educated <strong>and</strong> slightly wealthier than the rest of the state. A larger<br />
percent of <strong>Durham</strong> residents over the age of 25 have a Bachelor’s degree or higher (44.3% relative<br />
to 26.5% for the state), <strong>and</strong> slightly fewer have not completed high school (13.0% relative to<br />
16.0% for the state) (6). The median <strong>in</strong>come <strong>in</strong> <strong>Durham</strong> is above the state average, the percent of<br />
<strong>Durham</strong> residents liv<strong>in</strong>g <strong>in</strong> poverty is also slightly above the state average (17.1% vs. 16.1%) (6).<br />
Scope of the Problem <strong>in</strong> <strong>Durham</strong> <strong>County</strong><br />
An estimated 17,910 adults <strong>and</strong> 1,208 adolescents resid<strong>in</strong>g <strong>in</strong> <strong>Durham</strong> <strong>County</strong> abuse substances<br />
<strong>and</strong> need treatment (1).<br />
In 2010, the <strong>Durham</strong> <strong>County</strong> Health Department with Partnership for a Healthy <strong>Durham</strong><br />
conducted the Community Health Assessment. Dur<strong>in</strong>g this assessment, a Community Health<br />
Op<strong>in</strong>ion Survey was completed by r<strong>and</strong>omly selected <strong>Durham</strong> <strong>County</strong> households(9). In this<br />
survey there were several questions related to mental health <strong>and</strong> substance abuse, specifically<br />
respondents were asked to look at several lists <strong>and</strong> rank their top three neighborhood concerns.<br />
For example, one question had a list of 16 risky behaviors. Respondents were told, “Please look at<br />
this list of risky behaviors. Keep<strong>in</strong>g <strong>in</strong> m<strong>in</strong>d yourself <strong>and</strong> the people <strong>in</strong> your neighborhood, pick the<br />
top unhealthy behaviors that have the greatest effect on quality of life <strong>in</strong> <strong>Durham</strong> <strong>County</strong>. Please<br />
choose up to 3(9).” The four most popular responses were related to mental health <strong>and</strong> substance<br />
abuse: drug or prescription medication abuse (39%), alcohol abuse (35%), violent behavior<br />
(33%), <strong>and</strong> reckless/drunk driv<strong>in</strong>g (29%).<br />
<strong>Substance</strong> <strong>Use</strong> <strong>and</strong> <strong>Abuse</strong> <strong>in</strong> <strong>Durham</strong> <strong>County</strong> 13
Track<strong>in</strong>g the Problem<br />
Health-related Outcomes<br />
Emergency Department Visits<br />
Indicators:<br />
<br />
<br />
Number of emergency department visits related to substance use<br />
Rate of emergency department visits per 10,000 <strong>in</strong>dividuals<br />
Relevance: Emergency department visits are a good <strong>in</strong>dicator of health crises that are caused by<br />
substance abuse. Most people will try to avoid go<strong>in</strong>g to the emergency department for drugrelated<br />
issues because of the illegality of the substance use or because of the cost of the service.<br />
Thus, typically only severe cases are seen. A sharp change <strong>in</strong> emergency department visits can<br />
<strong>in</strong>dicate that a new substance has been <strong>in</strong>troduced <strong>in</strong>to a community (<strong>and</strong> thus many people are<br />
try<strong>in</strong>g it) or the purity of a substance has changed (<strong>and</strong> experienced users are tak<strong>in</strong>g potentially<br />
life threaten<strong>in</strong>g doses of the substance).<br />
Data: The data come from the NC Disease Event Track<strong>in</strong>g <strong>and</strong> Epidemiologic Collection Tool (NC<br />
DETECT) (10). This tool is designed to provide timely statewide detection of public health events.<br />
Hospitals report <strong>in</strong>formation daily to the system to allow for early detection of potential epidemics<br />
or public health concerns.<br />
NC DETECT provided the Center <strong>and</strong> Family policy with data for 2010 to 2012, by age (under 18,<br />
over 18 <strong>and</strong> total) for <strong>Durham</strong> <strong>County</strong> residents. Data that were provided for the 2010 substance<br />
abuse report is not comparable to data that were provided this year, as the ICD9 codes used to<br />
def<strong>in</strong>e substance abuse has changed. The codes used <strong>in</strong> this report are ‘291’-‘292.99’, ‘303’-<br />
‘305.03’, <strong>and</strong> ’V79.1’.<br />
Disclaimer: “The NC DETECT Data Oversight Committee does not take responsibility for the<br />
scientific validity or accuracy of methodology, results, statistical analyses, or conclusions<br />
presented.” The NC DETECT Data Oversight Committee (DOC) <strong>in</strong>cludes representatives from<br />
NCDPH, UNC NC DETECT Team <strong>and</strong> NC Hospital Association.<br />
F<strong>in</strong>d<strong>in</strong>gs:<br />
Table 1 provides the number of admissions by age that is available for 2010 to 2012. There was<br />
approximately 12.5 percent more hospital admissions related to substance use <strong>in</strong> 2012 relative to<br />
2010. For adults, there was an <strong>in</strong>crease of 11.6% <strong>in</strong> the number of admissions between 2010 <strong>and</strong><br />
2012. Dur<strong>in</strong>g this same time period, the number of admissions for juveniles <strong>in</strong>creased 64.7%.<br />
<strong>Substance</strong> <strong>Use</strong> <strong>and</strong> <strong>Abuse</strong> <strong>in</strong> <strong>Durham</strong> <strong>County</strong> 14
Rate per 10,000 residents<br />
[Table 1]<br />
Number of substance use related admissions of <strong>Durham</strong> <strong>County</strong> residents to emergency<br />
departments, 2010 – 2012.<br />
Year All Ages Over 18 Under 18<br />
2010 3110 3059 51<br />
2011 3346 3265 81<br />
2012 3499 3415 84<br />
Source: NC DETECT<br />
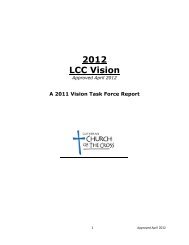
The rate of admissions, per 10,000 population, <strong>in</strong>creased 8 percent between 2010 <strong>and</strong> 2012. The<br />
rate of admissions for juveniles under 18 <strong>in</strong>creased 55.3 percent, while rate for adults aged 18 <strong>and</strong><br />
older <strong>in</strong>creased 7.5 percent. Figure 2 provides <strong>in</strong>formation on emergency room admissions rates<br />
from 2010 - 2012.<br />
138.3<br />
115.9<br />
All ages<br />
147.8 148.5<br />
122.4<br />
125.1<br />
178.1<br />
147.0<br />
Over 18<br />
189.9 190.9<br />
154.5<br />
158.0<br />
11.1<br />
8.5<br />
Under 18<br />
13.1 13.2<br />
12.2 12.1<br />
2010 2011 2012<br />
2010 2011 2012<br />
2010 2011 2012<br />
Source: NC DETECT<br />
NC <strong>Durham</strong><br />
[Figure 2]<br />
Rate of total emergency department admissions related to substance use for <strong>Durham</strong> <strong>County</strong> <strong>and</strong><br />
NC, per 10,000 residents, 2010 – 2012, for all ages, adults over 18, <strong>and</strong> juveniles under 18.<br />
Deaths Reported by the NC Office of the Chief Medical Exam<strong>in</strong>er<br />
Indicators:<br />
<br />
<br />
Number of deaths related to tox<strong>in</strong>s identified by the NC Office of the Chief Medical<br />
Exam<strong>in</strong>er (NC OCME)<br />
Number <strong>and</strong> percent of tox<strong>in</strong>-related deaths by type of substance<br />
Relevance: In NC from 1999-2011 there has been a 300% growth <strong>in</strong> the number of deaths from<br />
un<strong>in</strong>tentional poison<strong>in</strong>g. N<strong>in</strong>ety-one percent of un<strong>in</strong>tentional poison<strong>in</strong>gs were caused by over-thecounter<br />
drugs, prescriptions or illicit substances (11). Deaths exam<strong>in</strong>ed by the medical exam<strong>in</strong>er<br />
provide <strong>in</strong>sight <strong>in</strong>to the types of drugs that <strong>in</strong>dividuals are abus<strong>in</strong>g. Changes <strong>in</strong> the number of<br />
substance use-related deaths <strong>in</strong> a community are most likely when a drug is first <strong>in</strong>troduced <strong>in</strong>to a<br />
<strong>Substance</strong> <strong>Use</strong> <strong>and</strong> <strong>Abuse</strong> <strong>in</strong> <strong>Durham</strong> <strong>County</strong> 15
# of deaths<br />
community or when there is a change <strong>in</strong> the purity of a drug that is commonly used. Information<br />
from the medical exam<strong>in</strong>er give us a sense of the demographics of populations most at risk as well<br />
as the types of dangerous drugs that are <strong>in</strong> the community.<br />
Data: Data were provided by the NC Office of the Chief Medical Exam<strong>in</strong>er. Please note that ten<br />
deaths related to Carbon Monoxide poison<strong>in</strong>g were omitted. Individuals <strong>in</strong>clude <strong>Durham</strong> <strong>County</strong><br />
residents regardless of whether the death occurred <strong>in</strong> a different county. Although race <strong>and</strong><br />
ethnicity are not mutually exclusive (that is, someone can be both White <strong>and</strong> Hispanic or Black <strong>and</strong><br />
Hispanic), <strong>in</strong> these data, there was no one who had Hispanic ethnicity with a race listed. Deaths<br />
from tox<strong>in</strong>s <strong>in</strong>clude <strong>in</strong>tentional suicides or homicides, natural causes, undeterm<strong>in</strong>ed causes but<br />
are more likely to be un<strong>in</strong>tentional overdoses (11).<br />
F<strong>in</strong>d<strong>in</strong>gs: Figure 3 exam<strong>in</strong>es the number of tox<strong>in</strong>-related deaths to <strong>Durham</strong> <strong>County</strong> residents from<br />
2004-2011. Across all eight years, about 40% of deaths are African Americans, 48% Whites, 10%<br />
Hispanics, <strong>and</strong> less than 2% of Native Americans, Asians, <strong>and</strong> <strong>in</strong>dividuals of unknown race/ethnic<br />
orig<strong>in</strong>. Although the numbers fluctuate some from year to year, <strong>and</strong> while there is not strong<br />
upward or downward trend, <strong>in</strong> 2010 <strong>and</strong> 2011 there was an <strong>in</strong>crease <strong>in</strong> the number of deaths <strong>in</strong><br />
White residents. Across the six years, males constituted 75% of deaths from tox<strong>in</strong>s <strong>and</strong> females<br />
25%.<br />
Black White Hispanic Total<br />
50 51<br />
31<br />
34<br />
38 38<br />
36 36<br />
32<br />
29<br />
20<br />
19<br />
18<br />
18 18<br />
17<br />
11 10<br />
15 16<br />
15<br />
14<br />
4<br />
2<br />
3 3 3 3<br />
12<br />
14<br />
6 7<br />
2004 2005 2006 2007 2008 2009 2010 2011<br />
Source: NC Office of the Chief Medical Exam<strong>in</strong>er<br />
*Note: Native Americans(who had 1 death <strong>in</strong> 2009), Asians (who had 1 death <strong>in</strong> 2011), <strong>and</strong> <strong>in</strong>dividuals of<br />
unknown race (who had 1 death <strong>in</strong> each 2006, 2007 <strong>and</strong> 2008) were omitted from this figure.<br />
[Figure 3]<br />
Number of deaths related to tox<strong>in</strong>s for <strong>Durham</strong> <strong>County</strong> residents, 2004-2011<br />
The NC Office of the Chief Medical Exam<strong>in</strong>er lists tox<strong>in</strong>s that are either the primary or a<br />
contribut<strong>in</strong>g factor <strong>in</strong> the <strong>in</strong>dividual’s death. The drugs were coded <strong>in</strong>to the follow<strong>in</strong>g five<br />
<strong>Substance</strong> <strong>Use</strong> <strong>and</strong> <strong>Abuse</strong> <strong>in</strong> <strong>Durham</strong> <strong>County</strong> 16
# of deaths<br />
categories: alcohol, prescription drugs 1 , coca<strong>in</strong>e, hero<strong>in</strong>, <strong>and</strong> other. Figure 4 provides <strong>in</strong>sight <strong>in</strong>to<br />
the relative contributions of various substances that have been the primary or contribut<strong>in</strong>g cause<br />
of death for <strong>Durham</strong> residents. Alcohol was the most frequently mentioned tox<strong>in</strong> <strong>in</strong> 48% of<br />
<strong>Durham</strong> resident tox<strong>in</strong>-related deaths. Alcohol was followed by prescription drugs (33%), coca<strong>in</strong>e<br />
(24%), hero<strong>in</strong> (6%), <strong>and</strong> other (3%). Please note that multiple drugs may be listed <strong>in</strong> a s<strong>in</strong>gle<br />
death so the total will not necessarily be 100 percent.<br />
The substances associated with deaths differed for males <strong>and</strong> females. Alcohol was observed <strong>in</strong><br />
56% of male deaths related to tox<strong>in</strong>s, relative to only 26% of female deaths. Conversely,<br />
prescription drugs were noted <strong>in</strong> 50% of female tox<strong>in</strong>-related deaths, but only 27% of male tox<strong>in</strong>related<br />
deaths (however, because males had more tox<strong>in</strong>-related deaths than females, more males<br />
had prescription drugs listed<br />
Male Female Total<br />
as a factor <strong>in</strong> their death than<br />
160<br />
152<br />
females). The proportion of<br />
140<br />
132<br />
deaths with coca<strong>in</strong>e (22%<br />
males vs. 31% females) or<br />
120<br />
100<br />
103<br />
hero<strong>in</strong> (7% males vs. 5%<br />
females) listed as a factor were<br />
76<br />
similar for males <strong>and</strong> females.<br />
80<br />
60<br />
40<br />
20<br />
0<br />
52<br />
24<br />
20<br />
16<br />
[Figure 4]<br />
Drugs mentioned <strong>in</strong> deaths <strong>in</strong>volv<strong>in</strong>g tox<strong>in</strong>s for <strong>Durham</strong> <strong>County</strong><br />
residents dur<strong>in</strong>g eight years, 2004-2011<br />
4<br />
Coca<strong>in</strong>e Alcohol Hero<strong>in</strong> Prescription Other<br />
Source: NC Office of the Chief Medical Exam<strong>in</strong>er<br />
20<br />
64<br />
39<br />
7<br />
1<br />
8<br />
Age is an important factor to consider when underst<strong>and</strong><strong>in</strong>g how substance use is affect<strong>in</strong>g the<br />
community. Figure 5 exam<strong>in</strong>es tox<strong>in</strong>-related deaths by age for <strong>Durham</strong> residents. The figure<br />
demonstrates that tox<strong>in</strong>-related deaths have been spread across age groups over the last eight<br />
1 The follow<strong>in</strong>g drugs were coded as prescription drugs: Acetam<strong>in</strong>ophen, Alprazolam, Amitriptyl<strong>in</strong>e, Amlodip<strong>in</strong>e,<br />
Buprenorph<strong>in</strong>e, Bupropion, Carisoprodol, Chlordiazepoxide, Citalopram, Clonazepam, Code<strong>in</strong>e, Cyclobenzapr<strong>in</strong>e,<br />
Diazepam, Diltiazem, Diphenhydram<strong>in</strong>e, Fentanyl, Gabapent<strong>in</strong>, Hydrocodone, Memant<strong>in</strong>e, Methadone, Metoprolol,<br />
Morph<strong>in</strong>e, Oxycodone, Oxymorphone, Paroxet<strong>in</strong>e, Pentobarbital, Phenobarbital, Promethaz<strong>in</strong>e, Propoxyphene,<br />
Propranolol, Quetiap<strong>in</strong>e, Sertral<strong>in</strong>e, Temazepam, Tramadol, Trazodone, Venlafax<strong>in</strong>e, Zolpidem.<br />
<strong>Substance</strong> <strong>Use</strong> <strong>and</strong> <strong>Abuse</strong> <strong>in</strong> <strong>Durham</strong> <strong>County</strong> 17
Number of Deaths<br />
years. Exam<strong>in</strong><strong>in</strong>g data over an eight year period (2004 to 2011), the largerst number of deaths<br />
occurred <strong>in</strong> older <strong>in</strong>dividuals (ages 55+) <strong>and</strong> <strong>in</strong>dividuals ages 40-44 (see Figure 5).<br />
The NC Office of the Chief Medical Exam<strong>in</strong>er identifies the manner <strong>in</strong> which the <strong>in</strong>dividual died.<br />
Across 2004-2011, of the 314 deaths related to tox<strong>in</strong>s, 204 were accidental (65%), 48 were<br />
suicides (15.3%), 27 were natural deaths<br />
60<br />
50<br />
48<br />
49<br />
(9%), 26 were homicides (8%), <strong>and</strong> 9 were<br />
undeterm<strong>in</strong>ed (3%). For Blacks, Whites,<br />
42 <strong>and</strong> Hispanics, accidental deaths were<br />
40<br />
37 38 37<br />
more frequent than the other manners<br />
31<br />
comb<strong>in</strong>ed. More Blacks died as a result of a<br />
30<br />
homicide (14) than <strong>in</strong>dividuals of the other<br />
22<br />
racial <strong>and</strong> ethnic groups (2 White, 8<br />
20<br />
Hispanic, <strong>and</strong> 2 <strong>in</strong>dividuals of unknown<br />
9<br />
10<br />
racial <strong>and</strong> ethnic background). More<br />
Whites died as a result of suicide (37) than<br />
0<br />
Black (9) or Hispanic (2) <strong>in</strong>dividuals.<br />
Source: NC Office of the Chief Medical Exam<strong>in</strong>er<br />
[Figure 5]<br />
Deaths related to tox<strong>in</strong>s by age for <strong>Durham</strong><br />
<strong>County</strong> residents dur<strong>in</strong>g eight years, 2004-2011.<br />
HIV <strong>and</strong> Injection Drug <strong>Use</strong><br />
Indicator:<br />
<br />
The number of new HIV cases related to <strong>in</strong>ject<strong>in</strong>g substances (or “men hav<strong>in</strong>g sex with<br />
men(MSM) or <strong>in</strong>jection drug use (IDU)”)<br />
Relevance: One way that HIV is spread is through <strong>in</strong>jection drug use. HIV rates <strong>in</strong> <strong>Durham</strong><br />
<strong>County</strong> have been alarm<strong>in</strong>g for well over the past decade.<br />
<br />
<br />
<br />
In 2009-2011, <strong>Durham</strong> <strong>County</strong> had the fourth highest HIV <strong>in</strong>fection rate among NC<br />
counties(12). The average rate of newly diagnosed HIV <strong>in</strong>fections per 100,000 people was<br />
higher <strong>in</strong> <strong>Durham</strong> than NC (29.2 vs 16.4, respectively) (12). Fortunately the <strong>Durham</strong> county<br />
rate has decl<strong>in</strong>ed over the last 3 years from 35.8 <strong>in</strong> 2006-2009 (13).<br />
Among <strong>Durham</strong> residents from 2007-2011 HIV was the seventh lead<strong>in</strong>g cause of death for<br />
those aged 20-39 <strong>and</strong> the eighth lead<strong>in</strong>g cause of death among <strong>in</strong>dividuals aged 40-64 (14).<br />
In <strong>Durham</strong>, males are liv<strong>in</strong>g with HIV at a greater rate than females. In 2011, the HIV rate<br />
(per 100,000) for males was 50.8 compared to 17.0 for females (15). Accord<strong>in</strong>g to the most<br />
<strong>Substance</strong> <strong>Use</strong> <strong>and</strong> <strong>Abuse</strong> <strong>in</strong> <strong>Durham</strong> <strong>County</strong> 18
Rate per 100,000 population<br />
<br />
recently available data (2003-2007), <strong>in</strong>jection drug use was the source of <strong>in</strong>fection for<br />
approximately 9% of males <strong>and</strong> 7% of females <strong>in</strong> <strong>Durham</strong> <strong>County</strong> (16). This number may<br />
underestimate the risk of <strong>in</strong>jection drug use because <strong>in</strong>dividuals may underreport illicit<br />
activities.<br />
African-Americans are disproportionately affected by HIV. The rate of new HIV <strong>in</strong>fections<br />
per 100,000 people <strong>in</strong> 2011 was 10.9 for Whites, <strong>and</strong> 66.8 for African-Americans (15). For<br />
Hispanics there were fewer than 5 new cases of HIV diagnosed <strong>in</strong> 2011. Figure 6 shows HIV<br />
rates by race s<strong>in</strong>ce 2000.<br />
140<br />
120<br />
100<br />
80<br />
60<br />
40<br />
20<br />
0<br />
103.1<br />
48.4<br />
43.3<br />
11.6<br />
121.5 123.8<br />
66.5<br />
60.1<br />
16.7<br />
54.8<br />
31.2<br />
White Black Hispanic Total<br />
79.8<br />
42.2<br />
36.8<br />
11.3<br />
6.1<br />
88.5<br />
41.9<br />
92.5 91.8<br />
54.8<br />
65.3<br />
44.7<br />
42.7 43.2<br />
34.7<br />
32.7<br />
12.1<br />
15.8<br />
5<br />
6.8<br />
Source: Communicable Disease Branch at the NC Division of Public Health<br />
[Figure 6]<br />
New HIV <strong>in</strong>fection rates <strong>in</strong> <strong>Durham</strong> <strong>County</strong>, by race, 2000-2011<br />
80.2<br />
70.3<br />
44<br />
11.5<br />
63.6 62<br />
58.1 58.2<br />
9.4<br />
19.9<br />
66.8<br />
36.2 39.6 32.9<br />
2000 2001 2002 2003 2004 2005 2006 2007 2008 2009 2010 2011<br />
10.9<br />
Data: Data on HIV <strong>and</strong> AIDS <strong>in</strong>cidence <strong>and</strong> rates <strong>in</strong> <strong>Durham</strong> <strong>County</strong> come from the HIV/STD<br />
Prevention <strong>and</strong> Care Epidemiology Division <strong>in</strong> the NC Public Health Department. In the 2008<br />
HIV/STD Surveillance Report, HIV <strong>and</strong> AIDS data are presented differently than <strong>in</strong> previous years.<br />
Previous reports <strong>in</strong>cluded breakdowns of new HIV cases related to substance use by gender <strong>and</strong><br />
race/ethnicity—these data are not available for recent years.<br />
F<strong>in</strong>d<strong>in</strong>gs: Progress has been made <strong>in</strong> <strong>Durham</strong> to lower the number of newly acquired HIV cases<br />
related to substance use. Table 2 shows the total number of newly reported cases of HIV by year<br />
s<strong>in</strong>ce 2000 (15). The NC public health department tracks newly reported cases by how the disease<br />
was acquired (men hav<strong>in</strong>g sex with men (MSM), <strong>in</strong>jection drug use (IDU), blood products,<br />
pediatric cases, no identified risk (NIR), heterosexual transmission). Some men who have sex with<br />
men also engage <strong>in</strong> <strong>in</strong>jection drug use. For the purposes of the numbers presented below,<br />
MSM/IDU <strong>and</strong> IDU were both presented. If the number of cases was less than 5, the total number<br />
was not reported that year.<br />
<strong>Substance</strong> <strong>Use</strong> <strong>and</strong> <strong>Abuse</strong> <strong>in</strong> <strong>Durham</strong> <strong>County</strong> 19
Dur<strong>in</strong>g the years 1983-1994, 40 percent of newly reported HIV cases were related to <strong>in</strong>jection<br />
drug use, relative to less than 7% for years 2000-2011, <strong>in</strong>dicat<strong>in</strong>g that the total number of HIV<br />
cases per year related to substance use has decreased [For more detail see (3)]. Dur<strong>in</strong>g the years<br />
1995-1999, there were approximately 27 new cases each year, relative to less than 5 cases per<br />
year s<strong>in</strong>ce 2005 [see (3)]. When exam<strong>in</strong><strong>in</strong>g this decrease, it is important to note that, on average,<br />
one-third of new HIV cases do not have an identified mode of transmission reported.<br />
[Table 2]<br />
Number of new HIV cases by year <strong>and</strong> mode of exposure <strong>in</strong> <strong>Durham</strong> <strong>County</strong>, 2000-2011<br />
Mode of Exposure ‘00 ‘01 ‘02 ‘03 ‘04 ‘05 ‘06 ‘07 ‘08 ‘09 ‘10 ‘11<br />
Injection drug use 11 6 11 6 8
<strong>Substance</strong> <strong>Abuse</strong> <strong>and</strong> Social Services<br />
Substantiated Cases <strong>in</strong> DSS<br />
Indicator:<br />
Number of substantiated cases where substance abuse was <strong>in</strong>dicated<br />
Number of children <strong>in</strong> substantiated cases where substance abuse was <strong>in</strong>dicated<br />
Relevance: Parents who abuse substances are more likely to abuse or neglect their children (17).<br />
Neglect may arise because the parent is spend<strong>in</strong>g time seek<strong>in</strong>g drugs or is <strong>in</strong>capacitated due to<br />
<strong>in</strong>ebriation. <strong>Abuse</strong> may be more likely due to the specific effect of the drug on the parent’s decision<br />
mak<strong>in</strong>g process. For example, common side effects of drugs like coca<strong>in</strong>e may <strong>in</strong>clude depression,<br />
halluc<strong>in</strong>ations, <strong>and</strong> paranoia. These effects can last hours dur<strong>in</strong>g the high or longer if they are the<br />
effects of withdrawal (18). Parents who have been <strong>in</strong>vestigated for child maltreatment may be at<br />
<strong>in</strong>creased risk of los<strong>in</strong>g parental rights.<br />
Data: The Department of Social Services (DSS) tracks the number of cases that are substantiated<br />
<strong>and</strong> reports when substance abuse was <strong>in</strong>dicated as a maltreatment type <strong>in</strong> these cases. 2<br />
F<strong>in</strong>d<strong>in</strong>gs: From 2006to 2007 the number of substantiated cases where substance abuse was<br />
<strong>in</strong>dicated decreased by 85% (from 20 to 3) (see Table 3). After 2007, the number of cases<br />
rema<strong>in</strong>ed under 5 per year (with the exception of 2010, which had 6 substantiated cases where<br />
substance abuse was <strong>in</strong>dicated). In 2008 <strong>and</strong> 2011 there were no substantiated cases that had<br />
substance abuse <strong>in</strong>dicated. Each case could have more than one child <strong>in</strong>volved, see Table 3 for the<br />
number of children for each year. DSS also reports the number children <strong>in</strong>volved <strong>in</strong> a<br />
substantiated case that later enter foster care. In 2008 one child entered foster care that was part<br />
of a substantiated case <strong>in</strong>vestigated <strong>in</strong> 2006. That same year four children from a substantiated<br />
case that was <strong>in</strong>vestigated <strong>in</strong> 2007 entered foster care. In both 2009 <strong>and</strong> 2012, one substantiated<br />
case had one child enter foster care <strong>in</strong> the same year.<br />
2 A substantiated case is one <strong>in</strong> which “the allegation of maltreatment or risk of maltreatment was<br />
supported or founded by State law or State policy.”<br />
See http://www.acf.hhs.gov/sites/default/files/cb/cm11.pdf for more <strong>in</strong>formation.<br />
<strong>Substance</strong> <strong>Use</strong> <strong>and</strong> <strong>Abuse</strong> <strong>in</strong> <strong>Durham</strong> <strong>County</strong> 21
[Table 3]<br />
Number of substantiated cases <strong>and</strong> number of children <strong>in</strong> substantiated cases where substance<br />
abuse was <strong>in</strong>dicated <strong>in</strong> <strong>Durham</strong> <strong>County</strong>, 2006-2012<br />
Year <strong>in</strong>vestigation<br />
was completed<br />
Number of cases substantiated where<br />
substance abuse was <strong>in</strong>dicated*<br />
Number of children <strong>in</strong> cases that were<br />
substantiated where substance abuse<br />
was <strong>in</strong>dicated<br />
2006 20 28<br />
2007 3 7<br />
2008 no substantiated cases with substance abuse <strong>in</strong>dicated<br />
2009 4 6<br />
2010 6 13<br />
2011 no substantiated cases with substance abuse <strong>in</strong>dicated<br />
2012 2 12<br />
* Note that cases may <strong>in</strong>clude multiple children<br />
Source: NC Division of Social Services<br />
Homelessness<br />
Indicator:<br />
<br />
Number of homeless <strong>in</strong>dividuals who are substance abusers<br />
Relevance: <strong>Durham</strong> is <strong>in</strong>volved <strong>in</strong> an ambitious plan to address homelessness. Know<strong>in</strong>g the<br />
chang<strong>in</strong>g substance abuse patterns among the homeless population is essential when plann<strong>in</strong>g to<br />
meet the treatment <strong>and</strong> hous<strong>in</strong>g needs of that population. Both treatment <strong>and</strong> enforcement<br />
planners will be able to use this <strong>in</strong>formation.<br />
Data: Each year, the <strong>Durham</strong> Affordable Hous<strong>in</strong>g Coalition leads a concerted effort to count the<br />
homeless <strong>in</strong>dividuals <strong>in</strong> <strong>Durham</strong> <strong>County</strong> on a given day. This <strong>in</strong>volves a) teams of <strong>in</strong>dividuals go<strong>in</strong>g<br />
out <strong>in</strong>to the streets <strong>in</strong> the early hours of the morn<strong>in</strong>g to count homeless <strong>in</strong>dividuals (people liv<strong>in</strong>g<br />
under viaducts <strong>and</strong> bridges, <strong>in</strong> the woods, <strong>in</strong> ab<strong>and</strong>oned houses, etc.), <strong>and</strong> b) agencies that submit<br />
<strong>in</strong>formation regard<strong>in</strong>g the number of homeless <strong>in</strong>dividuals receiv<strong>in</strong>g services for emergency relief<br />
<strong>and</strong> transitional shelter. For recent years, the data are available onl<strong>in</strong>e through <strong>Durham</strong> Open<strong>in</strong>g<br />
Doors Homeless Prevention & Services(19). Older data were made available by Lloyd Schmeidler.<br />
Please note that the different sources sometimes had slightly different counts.<br />
F<strong>in</strong>d<strong>in</strong>gs: The most recent year available, 2012, marks the year with the highest number of<br />
homeless <strong>in</strong>dividuals <strong>in</strong> <strong>Durham</strong> with 698. While this is only 7% higher than the number of<br />
homeless <strong>in</strong> 2011, it is 30% higher than the number <strong>in</strong> 2009. While the number of <strong>in</strong>dividuals with<br />
a diagnosable substance use disorder dropped to 236 <strong>in</strong> 2011, <strong>in</strong> 2012 this rose to 328. This is a<br />
39% <strong>in</strong>crease <strong>in</strong> the number of homeless <strong>in</strong>dividuals with a substance use disorder (see Figure 7).<br />
In fact, 47% of homeless adults <strong>in</strong> <strong>Durham</strong> <strong>County</strong> have a substance use disorder (19, 20).<br />
<strong>Substance</strong> <strong>Use</strong> <strong>and</strong> <strong>Abuse</strong> <strong>in</strong> <strong>Durham</strong> <strong>County</strong> 22
# of <strong>in</strong>dividuals<br />
800<br />
700<br />
600<br />
500<br />
400<br />
395<br />
Total homeless Homeless adults Homeless adults w/substance use disorder<br />
675<br />
698<br />
652<br />
578<br />
590<br />
529<br />
535<br />
539<br />
535<br />
502<br />
619<br />
473<br />
591<br />
570<br />
502<br />
517<br />
466<br />
473<br />
300<br />
200<br />
100<br />
245<br />
316 313 317 325<br />
386<br />
353<br />
269<br />
236<br />
328<br />
0<br />
2001 2002 2003 2004 2005 2006 2007 2008 2009 2010 2011 2012<br />
Source: North Carol<strong>in</strong>a Coalition to End Homelessness<br />
[Figure 7]<br />
<strong>Substance</strong> <strong>Use</strong> Among the <strong>Durham</strong> Homeless Population: 2001-2012<br />
<strong>Substance</strong> <strong>Use</strong> <strong>and</strong> <strong>Abuse</strong> <strong>in</strong> <strong>Durham</strong> <strong>County</strong> 23
<strong>Substance</strong> <strong>Abuse</strong> <strong>and</strong> Law Enforcement<br />
Domestic Violence <strong>and</strong> the <strong>Durham</strong> Police Department<br />
Indicator:<br />
<br />
The number <strong>and</strong> percent of domestic violence cases <strong>in</strong>volv<strong>in</strong>g alcohol or illicit substances.<br />
Relevance: In the U.S., roughly one <strong>in</strong> four women will be affected by domestic violence dur<strong>in</strong>g<br />
their lifetime (21). In 2012 there were 122 homicides related to domestic violence <strong>in</strong> NC <strong>and</strong> 4 <strong>in</strong><br />
<strong>Durham</strong> (22). (In 2011 <strong>Durham</strong> had 10 homicides related to domestic violence but fewer <strong>in</strong> 2008<br />
(4), 2009 (4) <strong>and</strong> 2010 (3)).<br />
Domestic violence is def<strong>in</strong>ed as the willful abusive behavior result<strong>in</strong>g <strong>in</strong> assault or battery aga<strong>in</strong>st<br />
an <strong>in</strong>timate partner. For some <strong>in</strong>dividuals, the use of alcohol <strong>and</strong> drugs promotes aggression <strong>and</strong><br />
impulsive behaviors. <strong>Substance</strong> abuse may result <strong>in</strong> the batterer mis<strong>in</strong>terpret<strong>in</strong>g a comment or<br />
action from a spouse or child, lead<strong>in</strong>g to outbursts <strong>and</strong> lash<strong>in</strong>g out (23). Together, these side<br />
effects of alcohol <strong>and</strong> drug use may <strong>in</strong>crease the likelihood of domestic violence.<br />
Data: Data were provided via personal communication <strong>in</strong> April 2010 by the <strong>Durham</strong> City Police<br />
Department. The <strong>Durham</strong> City Police Department no longer collects this <strong>in</strong>formation, so data are<br />
only available for the years 2004 to 2009. In 2004, the <strong>Durham</strong> Police Department began track<strong>in</strong>g<br />
the number of calls to service for domestic violence cases. In 2005, they began to track detailed<br />
<strong>in</strong>formation on the calls that they responded to <strong>in</strong> order to identify repeat offenders. Beg<strong>in</strong>n<strong>in</strong>g <strong>in</strong><br />
2006, the police began track<strong>in</strong>g whether the alcohol or substance user was the suspect or the<br />
victim.<br />
F<strong>in</strong>d<strong>in</strong>gs: From 2004-2009, the <strong>Durham</strong> Police Department has averaged about 1,800 calls to<br />
service for domestic violence each year. Figure 8 summarizes how substance use has been<br />
<strong>in</strong>volved <strong>in</strong> these cases. In approximately one third of these cases, the suspect has abused alcohol<br />
or an illicit substance <strong>and</strong> about 12% have <strong>in</strong>volved substance use by the victim.<br />
<strong>Substance</strong> <strong>Use</strong> <strong>and</strong> <strong>Abuse</strong> <strong>in</strong> <strong>Durham</strong> <strong>County</strong> 24
Number of Calls to Services<br />
2500<br />
2000<br />
Child present, victim or substance use <strong>in</strong> victim or suspect<br />
<strong>Substance</strong> use <strong>in</strong> victim<br />
1,935 1,858<br />
1,677 1,758 1,739<br />
Total Cases<br />
Received<br />
1,810<br />
1500<br />
1000<br />
614 573<br />
666 662<br />
500<br />
0<br />
215 192 215 207<br />
144 127 171 193<br />
2004 2005 2006 2007 2008 2009<br />
Source: <strong>Durham</strong> <strong>County</strong> Police Department<br />
[Figure 8]<br />
Number of calls to service for the <strong>Durham</strong> Police Department for domestic violence cases, by type,<br />
2004-2009<br />
No child<br />
present<br />
78%<br />
Child<br />
Present<br />
22%<br />
Source: <strong>Durham</strong> Police Department<br />
No substance use<br />
59%<br />
<strong>Substance</strong> use <strong>in</strong><br />
victim or suspect<br />
41%<br />
[Figure 9]<br />
<strong>Durham</strong> <strong>County</strong> Police Department calls to service for<br />
domestic violence by presence of children <strong>and</strong><br />
substance use (n=6,984), 2006-2009<br />
Children are particularly vulnerable <strong>in</strong><br />
situations <strong>in</strong>volv<strong>in</strong>g domestic violence,<br />
substance use, or both. The police may<br />
need to work with social services if they<br />
suspect that the child may be harmed.<br />
From 2005-2009, approximately 22% of<br />
calls to service <strong>in</strong>volved children <strong>and</strong> 9%<br />
of the calls for domestic violence<br />
<strong>in</strong>volved both children <strong>and</strong> substance<br />
use. Between 2006 <strong>and</strong> 2009, of the<br />
6,984 case <strong>in</strong>vestigated by the <strong>Durham</strong><br />
Police Department, a child was present<br />
<strong>in</strong> 1,544 cases (22% of all cases<br />
<strong>in</strong>vestigated) (see Figure 9). Of these,<br />
635 cases had substance abuse reported<br />
<strong>in</strong> either the victim or suspect (9% of all<br />
cases reported, <strong>and</strong> 41% of cases where<br />
a child was present). Among the<br />
domestic violence calls where a child<br />
was present (22%), 41% <strong>in</strong>volved<br />
substance use of either the suspect or<br />
the victim.<br />
<strong>Substance</strong> <strong>Use</strong> <strong>and</strong> <strong>Abuse</strong> <strong>in</strong> <strong>Durham</strong> <strong>County</strong> 25
Arrests <strong>in</strong> <strong>Durham</strong> <strong>County</strong> Related to Alcohol <strong>and</strong> Illicit <strong>Substance</strong>s<br />
Indicators:<br />
<br />
<br />
<br />
Number/rate of arrests for possession <strong>and</strong> sales of illicit substances.<br />
Number/rate of arrests for liquor law violations.<br />
Number/rate of arrests for driv<strong>in</strong>g under the <strong>in</strong>fluence.<br />
Relevance: Arrests related to alcohol <strong>and</strong> illicit substances provide a sense of the various illegal<br />
behaviors related to substances. It is important to note that the number of arrests may fluctuate<br />
based on real changes to the number of violations be<strong>in</strong>g committed as well as the resources that<br />
are devoted to polic<strong>in</strong>g a particular issue. In order to make the best use of <strong>in</strong>formation from<br />
arrests, it is desirable to have qualitative <strong>in</strong>formation from local law enforcement agents who can<br />
help expla<strong>in</strong> if polic<strong>in</strong>g strategies have varied dur<strong>in</strong>g the time frame of observation or if there are<br />
real changes occurr<strong>in</strong>g <strong>in</strong> the number of violations be<strong>in</strong>g committed.<br />
Data: Data are provided by the State Bureau of Investigation. Local law enforcement agencies<br />
voluntarily report <strong>in</strong>formation. Data are available onl<strong>in</strong>e from the NC Department of Justice <strong>and</strong><br />
from the NC Uniform Crime Report<strong>in</strong>g (UCR) Program (24). Arrests related to substance use<br />
<strong>in</strong>clude possession or sales/manufactur<strong>in</strong>g of a) marijuana, b) opium or coca<strong>in</strong>e, c) synthetic<br />
narcotics, <strong>and</strong> d) other dangerous drugs – as well as driv<strong>in</strong>g under the <strong>in</strong>fluence <strong>and</strong> liquor law<br />
violations.<br />
F<strong>in</strong>d<strong>in</strong>gs: In <strong>Durham</strong> <strong>County</strong> <strong>in</strong> 2011, possession of marijuana (28 arrests) was the primary<br />
reason youth under the age of 18 were arrested for violations related to substance use.<br />
Sales/manufactur<strong>in</strong>g of marijuana (seven arrests) <strong>and</strong> driv<strong>in</strong>g under the <strong>in</strong>fluence (five arrests),<br />
followed a distant second to marijuana charges (see Figure 10).<br />
Juveniles Under 18<br />
Adults 18 & Over<br />
Possession - Marijuana<br />
Driv<strong>in</strong>g Under the Influence<br />
Possession - Opium or Coca<strong>in</strong>e<br />
Sale/Mfg. Opium or Coca<strong>in</strong>e<br />
Sale/Mfg. Marijuana<br />
Liquor Laws<br />
Possession - Other Dangerous Drugs<br />
Sale/Mfg. Other Dangerous Drugs<br />
Possession - Synthetic Narcotics<br />
Sale/Mfg. Synthetic Narcotics<br />
Source: NC State Bureau of Investigation<br />
# of arrests<br />
0 100 200 300 400<br />
5<br />
3<br />
2<br />
7<br />
7<br />
1<br />
11<br />
3<br />
[Figure 10]<br />
Arrests for possession or sales of illicit substances, driv<strong>in</strong>g under the <strong>in</strong>fluence, or liquor law<br />
violations by age, 2011<br />
11<br />
28<br />
54<br />
66<br />
93<br />
262<br />
304<br />
347<br />
<strong>Substance</strong> <strong>Use</strong> <strong>and</strong> <strong>Abuse</strong> <strong>in</strong> <strong>Durham</strong> <strong>County</strong> 26
The arrests of juveniles for violations related to substance use have decl<strong>in</strong>ed s<strong>in</strong>ce 2009 <strong>in</strong><br />
<strong>Durham</strong> <strong>County</strong> (see Figure 11). For adults <strong>in</strong> <strong>Durham</strong> <strong>County</strong> dur<strong>in</strong>g 2011, the largest substance<br />
use-related reason for arrest was dr<strong>in</strong>k<strong>in</strong>g <strong>and</strong> driv<strong>in</strong>g (347 arrests), which was closely followed<br />
by possession of marijuana (304 arrests). There were also a relatively large number of arrests for<br />
possession of opium or coca<strong>in</strong>e (262 arrests). There were less than 100 arrests for<br />
sales/manufactur<strong>in</strong>g of opium or coca<strong>in</strong>e (93 arrests), <strong>and</strong> sales/manufactur<strong>in</strong>g of marijuana (66<br />
arrests). For adults <strong>in</strong> <strong>Durham</strong> <strong>County</strong>, the number of arrests <strong>in</strong> 2011 was fewer compared to<br />
2009 <strong>and</strong> 2010, for most substances (see Figure 11).<br />
0 20 40 60 80<br />
1<br />
2<br />
5<br />
5<br />
3<br />
6<br />
2<br />
1<br />
1<br />
1<br />
1<br />
3<br />
7<br />
10<br />
7<br />
14<br />
13<br />
28<br />
70<br />
64<br />
# of arrests of juveniles<br />
Source: NC State Bureau of Investigation<br />
2009 2010 2011<br />
Possession – Marijuana<br />
Driv<strong>in</strong>g Under the Influence<br />
Possession – Opium or Coca<strong>in</strong>e<br />
Sale/Mfg. Opium or Coca<strong>in</strong>e<br />
Sale/Mfg. Marijuana<br />
Liquor Laws<br />
Possession – Other Dangerous<br />
Drugs<br />
Sale/Mfg. Other Dangerous Drugs<br />
Possession – Synthetic Narcotics<br />
Sale/Mfg. Synthetic Narcotics<br />
0 200 400 600 800<br />
14<br />
13<br />
11<br />
11<br />
3<br />
7<br />
7<br />
21<br />
11<br />
3<br />
5<br />
3<br />
93<br />
121<br />
115<br />
66<br />
61<br />
57<br />
54<br />
304<br />
350<br />
334<br />
262<br />
268<br />
180<br />
347<br />
453<br />
431<br />
463<br />
# of arrests of adults<br />
[Figure 11]<br />
Arrests for possession or sales of illicit substances, driv<strong>in</strong>g under the <strong>in</strong>fluence, or liquor law<br />
violations for juveniles 18 <strong>and</strong> under <strong>and</strong> adults, 2009-2011<br />
609<br />
Arrests for possession <strong>and</strong> sales of illicit substances over time<br />
Overall, the time trends <strong>in</strong> arrests for different substances are difficult to determ<strong>in</strong>e because it<br />
appears that the data on arrests related to substances may have been <strong>in</strong>accurately or <strong>in</strong>completely<br />
reported <strong>in</strong> 2006. Arrests are also markedly down <strong>in</strong> 2011. It appears that, on average, the number<br />
of arrests for sales of opium or coca<strong>in</strong>e s<strong>in</strong>ce 2007 has been decl<strong>in</strong><strong>in</strong>g (517 <strong>in</strong> 2008 <strong>and</strong> 2009<br />
compared to 276 <strong>in</strong> 2010 <strong>and</strong> 2011) (see Figure 12). Similar to the pattern observed <strong>in</strong> sales,<br />
<strong>Substance</strong> <strong>Use</strong> <strong>and</strong> <strong>Abuse</strong> <strong>in</strong> <strong>Durham</strong> <strong>County</strong> 27
# Arrests for sales<br />
arrests for possession of opium or coca<strong>in</strong>e has been decl<strong>in</strong><strong>in</strong>g s<strong>in</strong>ce 2007 (744 <strong>in</strong> 2008 <strong>and</strong> 2009<br />
compared to 612 <strong>in</strong> 2010 <strong>and</strong> 2011) (see Figure 13).<br />
While arrests for sales/manufactur<strong>in</strong>g <strong>and</strong> possession of opium <strong>and</strong> coca<strong>in</strong>e appear to be down,<br />
the story differs for marijuana sales. Arrests for sales/manufactur<strong>in</strong>g were similar <strong>in</strong> 2008-2009<br />
<strong>and</strong> 2010-2011 (234 vs. 198). However, arrests for possession of marijuana decl<strong>in</strong>ed dur<strong>in</strong>g the<br />
same years from 1058 to 827.<br />
600<br />
Opium or Coca<strong>in</strong>e Marijuana Synthetic Narcotics<br />
Other Dangerous Drugs<br />
Total<br />
522<br />
500<br />
400<br />
300<br />
458<br />
390<br />
298<br />
472<br />
387 371<br />
233<br />
445<br />
318<br />
475 474 458 457<br />
437<br />
384 389<br />
376 362<br />
333 349<br />
145<br />
435<br />
298<br />
367<br />
244<br />
416<br />
273<br />
316<br />
200<br />
100<br />
0<br />
249<br />
183<br />
176<br />
129 124 128 125<br />
107 100 100<br />
106<br />
88<br />
93<br />
81 78 84 78<br />
60<br />
64<br />
73<br />
41<br />
57<br />
2 4<br />
4 7 5 5 3 4 3 7 4 3<br />
8 3<br />
6 4 3 2 2 2 1 1 10 9 12 3 5 7 3<br />
Source: NC State Bureau of Investigation<br />
[Figure 12]<br />
Arrests for sale of drugs <strong>in</strong> <strong>Durham</strong> <strong>County</strong>, 1995-2011<br />
<strong>Substance</strong> <strong>Use</strong> <strong>and</strong> <strong>Abuse</strong> <strong>in</strong> <strong>Durham</strong> <strong>County</strong> 28
# Arrests for possession<br />
1200<br />
1000<br />
800<br />
600<br />
400<br />
200<br />
0<br />
651<br />
999<br />
837<br />
Opium or Coca<strong>in</strong>e Marijuana Synthetic Narcotics<br />
827 788<br />
700<br />
838 831<br />
650 704 869<br />
466 489 547 535 523<br />
438<br />
468<br />
495<br />
568<br />
501 350<br />
350 368<br />
460<br />
477<br />
249 274 331<br />
332<br />
343 353 379 287 327 374 399 380<br />
171 364 347 139<br />
265<br />
225<br />
11 9<br />
19 4 4 6 18<br />
4 6 9 1<br />
10<br />
1 4 7 5 4<br />
6 4 2 3 1 4 6 14 11 10 14 8 14 11<br />
21 12<br />
1028<br />
Source: NC State Bureau of Investigation<br />
[Figure 13]<br />
Arrests for possession of illicit substances <strong>in</strong> <strong>Durham</strong> <strong>County</strong>, 1995-2011<br />
560<br />
887 936 909 877<br />
620<br />
1995 1996 1997 1998 1999 2000 2001 2002 2003 2004 2005 2006 2007 2008 2009 2010 2011<br />
Arrests among juveniles by race<br />
Figures 14 <strong>and</strong> 15 show arrests related to substance use <strong>in</strong> 2010 <strong>and</strong> 2011 respectively for<br />
juveniles <strong>in</strong> <strong>Durham</strong> by race. It is worth not<strong>in</strong>g that the official reports <strong>in</strong>dicate much fewer arrests<br />
for juveniles <strong>in</strong> 2011 relative to 2009 <strong>and</strong> 2010.<br />
White<br />
Black<br />
Disorderly Conduct Drunk & Disorderly<br />
Possession - Marijuana<br />
Possession - Opium or Coca<strong>in</strong>e<br />
Sale/Mfg. Marijuana<br />
Sale/Mfg. Opium or Coca<strong>in</strong>e<br />
Driv<strong>in</strong>g Under the Influence<br />
Liquor Laws<br />
Possession - Other Dangerous Drugs<br />
0 20 40 60 80 100 120 140 160<br />
1<br />
4<br />
1<br />
2<br />
2<br />
0<br />
1<br />
1<br />
1<br />
0<br />
13<br />
9<br />
9<br />
28<br />
[Figure 14]<br />
Arrests <strong>in</strong> <strong>Durham</strong> <strong>County</strong> of juveniles for possession or sale of illicit substances, driv<strong>in</strong>g under the<br />
<strong>in</strong>fluence, or liquor law violations by race, 2010<br />
51<br />
# of Arrests<br />
Source: NC State Bureau of Investigation<br />
*Note that there was 1 recorded arrest for an <strong>in</strong>dividual of Asian/Pacific Isl<strong>and</strong>er descent for<br />
possession of marijuana<br />
136<br />
<strong>Substance</strong> <strong>Use</strong> <strong>and</strong> <strong>Abuse</strong> <strong>in</strong> <strong>Durham</strong> <strong>County</strong> 29
White<br />
Black<br />
0 5 10 15 20<br />
[Figure 15]<br />
Arrests <strong>in</strong> <strong>Durham</strong> <strong>County</strong> of juveniles for possession or sale of illicit substances, driv<strong>in</strong>g under the<br />
<strong>in</strong>fluence, or liquor law violations by race, 2011<br />
<strong>Substance</strong> <strong>Use</strong> Among Prison Inmates<br />
Indicators:<br />
<br />
<br />
<br />
<br />
Possession - Marijuana<br />
Sale/Mfg. Marijuana<br />
Driv<strong>in</strong>g Under the Influence<br />
Disorderly Conduct Drunk & Disorderly<br />
Possession - Opium or Coca<strong>in</strong>e<br />
Liquor Laws<br />
Possession - Synthetic Narcotics<br />
Number <strong>and</strong> percent of <strong>in</strong>mates enter<strong>in</strong>g prison that had a drug offense on commitment.<br />
Number of <strong>in</strong>mates enter<strong>in</strong>g prison whose most serious offense on commitment was drugrelated.<br />
Number <strong>and</strong> percent of <strong>in</strong>mates enter<strong>in</strong>g prison with a need for substance use treatment.<br />
Drug of choice as identified by <strong>in</strong>mates.<br />
0<br />
0<br />
0<br />
0<br />
1<br />
# of Arrests<br />
Source: NC State Bureau of Investigation<br />
*Note that there was 1 recorded arrest for an <strong>in</strong>dividual of Asian/Pacific Isl<strong>and</strong>er descent for<br />
possession of marijuana<br />
2<br />
2<br />
2<br />
3<br />
3<br />
Relevance: Prison <strong>in</strong>mates represent a portion of the population that tends to have high rates of<br />
substance use issues. For example, <strong>in</strong> 2004, accord<strong>in</strong>g to a national sample, about 17-18% of state<br />
<strong>and</strong> federal <strong>in</strong>mates committed their current offense to obta<strong>in</strong> money for drugs (25). Moreover,<br />
about a quarter to a third of convicted <strong>in</strong>mates stated that they had their most recent offense<br />
while under the <strong>in</strong>fluence of drugs. Most importantly, over half of federal <strong>and</strong> state <strong>in</strong>mates<br />
reported be<strong>in</strong>g addicted to, or of hav<strong>in</strong>g abused, drugs <strong>and</strong> alcohol.<br />
The high needs of this population warrant the attention of the treatment community. Effective<br />
treatments offer hope of reduc<strong>in</strong>g recidivism as well as help<strong>in</strong>g these members of our community<br />
return to a productive, <strong>in</strong>dependent life (26).<br />
Data: The data were provided by the NC Department of Corrections. Department of Corrections<br />
staff adm<strong>in</strong>ister the <strong>Substance</strong> <strong>Abuse</strong> Subtle Screen<strong>in</strong>g Inventory (SASSI) to <strong>in</strong>dividuals enter<strong>in</strong>g<br />
4<br />
5<br />
11<br />
15<br />
<strong>Substance</strong> <strong>Use</strong> <strong>and</strong> <strong>Abuse</strong> <strong>in</strong> <strong>Durham</strong> <strong>County</strong> 30
prison <strong>in</strong> order to identify those who need treatment. Results from the screen<strong>in</strong>g tool are used to<br />
make referrals to treatment.<br />
F<strong>in</strong>d<strong>in</strong>gs: Between 2009 <strong>and</strong> 2012, 2,493 <strong>Durham</strong> residents entered prison. Over one third of<br />
<strong>Durham</strong> residents who entered prison had at least one drug offense at the time of conviction <strong>and</strong> a<br />
slightly more than a quarter of them had a drug offense as the most serious offense at the time of<br />
conviction (see Table 4). Moreover, results of the <strong>Substance</strong> <strong>Abuse</strong> Subtle Screen<strong>in</strong>g Inventory<br />
(SASSI) <strong>in</strong>dicated that 60% of <strong>Durham</strong> residents enter<strong>in</strong>g prison needed substance abuse<br />
treatment. Among <strong>Durham</strong> residents under the age of 18 who entered prison between 2009 <strong>and</strong><br />
2012, two had an arrest related to substance use; <strong>and</strong> 26 of the 28 were identified as need<strong>in</strong>g<br />
substance use treatment.<br />
[Table 4]<br />
Prison entries <strong>and</strong> drug offenses among <strong>Durham</strong> residents, 2009-2012<br />
Age at entry<br />
All<br />
entries<br />
to prison<br />
Entries with at least<br />
1 drug offense on<br />
commitment<br />
Entries where drug offense<br />
was the most serious<br />
offence on commitment<br />
Entries with<br />
substance use<br />
treatment need*<br />
# # % # % # %<br />
All Ages 2493 908 36.4 685 27.5 1500 60.2<br />
13-17 28 2 7.1 0 0 26 92.9<br />
18 <strong>and</strong> above 2465 906 36.8 685 27.8 1474 59.8<br />
Source: Authors’ tabulations of data provided by the NC Department of Corrections<br />
Note: *<strong>Substance</strong> use need was determ<strong>in</strong>ed by scor<strong>in</strong>g a three or higher on the <strong>Substance</strong> <strong>Abuse</strong><br />
Subtle Screen<strong>in</strong>g Inventory (SASSI)<br />
Upon entry, prisoners are asked to name their drug of choice. Relatively few of the 2,493 prisoners<br />
<strong>in</strong>dicated that they did not use any substance (4%). Prisoners’ most commonly mentioned<br />
substances were marijuana (37%) <strong>and</strong> alcohol (37%). Approximately 16% named coca<strong>in</strong>e (10%)<br />
or crack (6%) as their drug of choice. A small percent of prisoners named hero<strong>in</strong> (4%), opiates<br />
(2%), amphetam<strong>in</strong>es (0.2%), Halluc<strong>in</strong>ogens (0.1%) or other drugs as their drug of choice (Figure<br />
16).<br />
<strong>Substance</strong> <strong>Use</strong> <strong>and</strong> <strong>Abuse</strong> <strong>in</strong> <strong>Durham</strong> <strong>County</strong> 31
Nonuser<br />
Alcohol<br />
Marijuana<br />
Coca<strong>in</strong>e<br />
Crack<br />
Hero<strong>in</strong><br />
Opiates<br />
Amphetam<strong>in</strong>es<br />
Halluc<strong>in</strong>ogens<br />
Other<br />
Methamphetam<strong>in</strong>e<br />
Benzodiazep<strong>in</strong>e<br />
LSD<br />
Barbiturates<br />
4%<br />
6%<br />
4%<br />
2%<br />
0.2%<br />
0.1%<br />
0.09%<br />
0.05%<br />
0.05%<br />
0.05%<br />
0.05%<br />
10%<br />
37%<br />
37%<br />
0.00% 10.00% 20.00% 30.00% 40.00%<br />
Source: Authors’ tabulations of data provided by the NC Department of Corrections<br />
[Figure 16]<br />
Drug of choice among prisoners from <strong>Durham</strong> <strong>County</strong>, 2009-2012<br />
<strong>Substance</strong> <strong>Abuse</strong> Among <strong>Durham</strong> <strong>County</strong> Jail Inmates<br />
Indicator:<br />
<br />
Number <strong>and</strong> percent of jail <strong>in</strong>mates with drug, alcohol, or driv<strong>in</strong>g while <strong>in</strong>toxicated charges<br />
Relevance: Accord<strong>in</strong>g to a national study, <strong>in</strong>carceration expenses <strong>in</strong> local jails cost average about<br />
$20,000 year (27, 28). While the costs of treatment vary, it is estimated that every $1 spent on<br />
substance use treatment <strong>in</strong> turn saves $3 <strong>in</strong> societal costs. Closely exam<strong>in</strong><strong>in</strong>g repeat substance use<br />
offenders <strong>and</strong> the resources allocated for treatment of these <strong>in</strong>dividuals may play an important<br />
role <strong>in</strong> sav<strong>in</strong>g county dollars. Many <strong>in</strong>dividuals are arrested for acts not directly related to<br />
substance use but may have a substance use disorder. At the same time <strong>in</strong>dividuals arrested for an<br />
act related to substance use (ex. possession of drug paraphernalia) may or may not have a<br />
substance use disorder. This <strong>in</strong>dicator directly measures the number <strong>and</strong> percent of jail offenders<br />
<strong>in</strong> need of treatment.<br />
Data: The <strong>Durham</strong> <strong>County</strong> Sheriff’s Office ma<strong>in</strong>ta<strong>in</strong>s a public database on <strong>in</strong>mates (29). Reports<br />
are publically available onl<strong>in</strong>e for <strong>in</strong>mates who were conf<strong>in</strong>ed <strong>in</strong> the last 24 hours, the last 30 days<br />
or who are currently <strong>in</strong> a <strong>Durham</strong> jail. The data provides <strong>in</strong>formation on each <strong>in</strong>mate’s name, date<br />
conf<strong>in</strong>ed, date released, statute description (reason they are conf<strong>in</strong>ed), bond type <strong>and</strong> bond<br />
amount. In addition, the Web site allows one to click on each <strong>in</strong>mate’s name <strong>and</strong> learn <strong>in</strong>formation<br />
<strong>Substance</strong> <strong>Use</strong> <strong>and</strong> <strong>Abuse</strong> <strong>in</strong> <strong>Durham</strong> <strong>County</strong> 32
egard<strong>in</strong>g the <strong>in</strong>mates’ race, gender, birthdate <strong>and</strong> photo. However, it does not appear that<br />
ethnicity is captured. The <strong>Durham</strong> <strong>County</strong> Sheriff’s Department provided us with data on all<br />
<strong>in</strong>mates conf<strong>in</strong>ed <strong>in</strong> the <strong>Durham</strong> <strong>County</strong> Jail dur<strong>in</strong>g 2012, <strong>in</strong>clud<strong>in</strong>g data on age <strong>and</strong> sex.<br />
Data were coded by statute description as be<strong>in</strong>g related to a) controlled substance; b) alcohol<br />
<strong>and</strong>/or c) driv<strong>in</strong>g while impaired.<br />
F<strong>in</strong>d<strong>in</strong>gs: There were 8,693 <strong>in</strong>mates <strong>in</strong> the <strong>Durham</strong> <strong>County</strong> Sheriff’s Office data dur<strong>in</strong>g the 2012<br />
calendar year, 29% were white <strong>and</strong> 70% were black, <strong>and</strong> 78% were male <strong>and</strong> 22% were female.<br />
Of these <strong>in</strong>mates, over one third (3,469) had at least one jail sentence for a conviction related to<br />
substance use (either driv<strong>in</strong>g while impaired, alcohol related, or drug related). Of those with a jail<br />
sentence related to substance use, 35% were white <strong>and</strong> 63% were black, <strong>and</strong> 83% were male <strong>and</strong><br />
17% were female. Dur<strong>in</strong>g the 2012 calendar year, <strong>in</strong>mates served a total of 12,414 different jail<br />
sentences for various convictions. Roughly one third of the jail sentences that were served dur<strong>in</strong>g<br />
2012 (34% or 4,227 sentences) were related to alcohol or drug convictions. Of those sentences,<br />
2,333 (55%) had a drug related conviction, 208 (5%) had an alcohol related conviction, <strong>and</strong> 69<br />
(2%) had both drug <strong>and</strong> alcohol related convictions. In addition 1,438 sentences were due to a<br />
driv<strong>in</strong>g while impaired conviction (34%) <strong>and</strong> 179 sentences were a comb<strong>in</strong>ation of drugs, alcohol<br />
<strong>and</strong> driv<strong>in</strong>g while impaired convictions (4%). Figures 17 <strong>and</strong> 18 present charges by gender <strong>and</strong><br />
race.<br />
Female<br />
Male<br />
Total convictions related to substances<br />
Comb<strong>in</strong>ation of drug, alcohol, <strong>and</strong> driv<strong>in</strong>g<br />
while imparied convictions<br />
Drug <strong>and</strong> alcohol convictions<br />
23<br />
156<br />
12<br />
57<br />
711<br />
3516<br />
Driv<strong>in</strong>g while impaired convictions<br />
Alcohol only convictions<br />
222<br />
47<br />
161<br />
1216<br />
Drug only convictions<br />
407<br />
1926<br />
0 1000 2000 3000 4000<br />
Source: Authors' tabulations of data provided by the <strong>Durham</strong> <strong>County</strong> Office of the Sheriff<br />
[Figure 17]<br />
Number of jail sentences related to substance use by gender, 2012<br />
<strong>Substance</strong> <strong>Use</strong> <strong>and</strong> <strong>Abuse</strong> <strong>in</strong> <strong>Durham</strong> <strong>County</strong> 33
Other Black White<br />
Total convictions related to substances<br />
Comb<strong>in</strong>ation of drug, alcohol, <strong>and</strong> driv<strong>in</strong>g<br />
while imparied convictions<br />
79<br />
97<br />
1391<br />
2748<br />
Drug <strong>and</strong> alcohol convictions<br />
47<br />
22<br />
Driv<strong>in</strong>g while impaired convictions<br />
558<br />
813<br />
Alcohol only convictions<br />
146<br />
61<br />
Drug only convictions<br />
398<br />
1918<br />
0 500 1000 1500 2000 2500 3000<br />
Source: Authors' tabulations of data provided by the <strong>Durham</strong> <strong>County</strong> Office of the Sheriff<br />
[Figure 18]<br />
Number of jail sentences related to substance use by race, 2012<br />
<strong>Substance</strong> <strong>Abuse</strong> among Adjudicated Juveniles<br />
Indicators:<br />
<br />
Number <strong>and</strong> percent of youth <strong>in</strong>volved with the juvenile justice system who are <strong>in</strong> need of<br />
treatment.<br />
Relevance: Accord<strong>in</strong>g to national estimates, youth who are <strong>in</strong> residential custody are more likely<br />
than the general population to use alcohol or drugs. Among youth <strong>in</strong> custody, 74% tried alcohol<br />
(vs. 56%), 84% tried marijuana (vs. 30%) <strong>and</strong> 50% tried another illicit substance (vs. 27%) (30).<br />
Juveniles <strong>in</strong> custody not only have higher prevalence of hav<strong>in</strong>g tried substances, but they also<br />
report high levels of use near the time of be<strong>in</strong>g placed <strong>in</strong>to custody with 59% say<strong>in</strong>g that they<br />
were drunk or high on drugs at least several times a week <strong>in</strong> the months immediately before be<strong>in</strong>g<br />
taken <strong>in</strong>to custody.<br />
Juveniles who are <strong>in</strong> custody represent a special population because prior del<strong>in</strong>quency is<br />
associated with future del<strong>in</strong>quency <strong>and</strong> crim<strong>in</strong>al behavior. Moreover, <strong>in</strong>dividuals who were<br />
<strong>in</strong>volved <strong>in</strong> the juvenile justice system struggle dur<strong>in</strong>g the transition to adulthood. These<br />
<strong>in</strong>dividuals are less likely to complete high school or college, have greater difficulty earn<strong>in</strong>g<br />
employment, <strong>and</strong> have greater residential <strong>in</strong>stability (31, 32). One researcher estimates that the<br />
societal sav<strong>in</strong>gs of sav<strong>in</strong>g a 14-year-old, high-risk juvenile from a life of crime is between $2.6 <strong>and</strong><br />
$5.3 million (33).<br />
<strong>Substance</strong> <strong>Use</strong> <strong>and</strong> <strong>Abuse</strong> <strong>in</strong> <strong>Durham</strong> <strong>County</strong> 34
Data: Data were provided by the NC Department of Juvenile Justice <strong>and</strong> Del<strong>in</strong>quency Prevention.<br />
The NC Department of Juvenile Justice <strong>and</strong> Del<strong>in</strong>quency Prevention conducts a needs assessment<br />
with youth at their disposition. In 2012, the assessment rate for disposed youth was 99% <strong>in</strong><br />
<strong>Durham</strong> <strong>and</strong> statewide, <strong>in</strong>dicat<strong>in</strong>g that most youth were assessed. The assessment is designed to<br />
determ<strong>in</strong>e the types of services, supports, <strong>and</strong> supervision the youth will need <strong>in</strong> various sett<strong>in</strong>gs<br />
(social, family, school, etc.). Included <strong>in</strong> this needs assessment are substance use problems.<br />
F<strong>in</strong>d<strong>in</strong>gs: In 2012, 197 <strong>Durham</strong> youth were disposed <strong>and</strong>, accord<strong>in</strong>g to the NC Department of<br />
Juvenile Justice & Del<strong>in</strong>quency Prevention, 43% of disposed youth <strong>in</strong> <strong>Durham</strong> were identified as<br />
abus<strong>in</strong>g substances <strong>and</strong>/or <strong>in</strong> need of treatment or assessment relative to 22% of youth disposed<br />
statewide (see Figure 19). A lower percentage of youth <strong>in</strong> <strong>Durham</strong> were identified as need<strong>in</strong>g<br />
further assessment for substance use services (13% <strong>in</strong> <strong>Durham</strong> vs. 20% <strong>in</strong> NC). Although it is<br />
difficult to determ<strong>in</strong>e why disposed youth <strong>in</strong> <strong>Durham</strong> have a higher need for substance use<br />
services than similar youth statewide, it is clear that nearly a half of these youth are <strong>in</strong> need of<br />
treatment.<br />
While there have been slightly fewer youth disposed each year s<strong>in</strong>ce 2008 both statewide <strong>and</strong> <strong>in</strong><br />
<strong>Durham</strong> <strong>County</strong>, the overall percentage of disposed youth need<strong>in</strong>g treatment services rema<strong>in</strong>ed<br />
relatively constant.<br />
<strong>Durham</strong><br />
NC<br />
0% 20% 40% 60%<br />
No Known <strong>Substance</strong> <strong>Abuse</strong><br />
43%<br />
57%<br />
Some <strong>Substance</strong> <strong>Use</strong>, Need for Further<br />
Assessment<br />
13%<br />
20%<br />
<strong>Substance</strong> <strong>Abuse</strong>, Assessment <strong>and</strong>/or Treatment<br />
Needed<br />
22%<br />
43%<br />
Not Assessed<br />
1%<br />
1%<br />
% Disposed<br />
Source: North Carol<strong>in</strong>a Department of Juvenile Justice <strong>and</strong> Del<strong>in</strong>quency Prevention.<br />
Note n=197 for <strong>Durham</strong> <strong>and</strong> n=7,029 for NC<br />
[Figure 19]<br />
Needs assessment of disposed youth <strong>in</strong> <strong>Durham</strong> <strong>County</strong> <strong>and</strong> NC, 2012<br />
<strong>Substance</strong> <strong>Use</strong> <strong>and</strong> <strong>Abuse</strong> <strong>in</strong> <strong>Durham</strong> <strong>County</strong> 35
<strong>Substance</strong> <strong>Abuse</strong> <strong>in</strong> <strong>Durham</strong> Public Schools<br />
Indicator:<br />
<br />
Number <strong>and</strong> rate of reportable offenses for possession of an illicit substance or alcohol on<br />
school property. 3<br />
Relevance: Drug patterns may vary by school <strong>and</strong> by neighborhood. Drug epidemics can spread<br />
across schools <strong>and</strong> neighborhoods. School officials need to know which drugs to look for <strong>in</strong> their<br />
schools. School-generated <strong>in</strong>formation that tracks changes across schools can <strong>in</strong>form law<br />
enforcement <strong>and</strong> treatment plann<strong>in</strong>g.<br />
Schools are required to report possession of alcohol <strong>and</strong> illicit substances on school property.<br />
Unfortunately, we cannot dist<strong>in</strong>guish whether the <strong>in</strong>cident <strong>in</strong>volved a youth at the school or<br />
someone else on school property. Nonetheless, the reported offenses for illicit possessions provide<br />
a picture of where illicit substances are physically available.<br />
Data: S<strong>in</strong>ce 1995, schools <strong>in</strong> NC have been required to report on 17 different offenses that occur<br />
on school property, <strong>in</strong>clud<strong>in</strong>g possession of alcohol <strong>and</strong> illicit substances. Data are available from<br />
the NC Department of Public Instruction (34).<br />
F<strong>in</strong>d<strong>in</strong>gs: <strong>Durham</strong> Public Schools reported that students’ possession of a controlled substance<br />
made up 41% (136 <strong>in</strong>cidents) <strong>and</strong> possession of alcohol made up 8% (25 <strong>in</strong>cidents) of the 333<br />
reportable <strong>in</strong>cidents on school grounds <strong>in</strong> the 2011-2012 school year (34). Figure 20, shows the<br />
total number of acts committed on school grounds, <strong>and</strong> the number of these that were controlled<br />
substances <strong>and</strong> alcohol related <strong>in</strong> <strong>Durham</strong> <strong>County</strong> Public Schools s<strong>in</strong>ce the 2005-2006 school year.<br />
Table 5 lists average rates of reportable offenses related to alcohol or illicit substances on<br />
<strong>Durham</strong>’s middle or high school grounds. Not surpris<strong>in</strong>gly, high schools have a higher rate of<br />
reportable offenses.<br />
3 Three year averages were used because the number of offense <strong>in</strong> any one year is typically small. A s<strong>in</strong>gle<br />
event that generated several arrests may skew the data. Thus, three year averages would be more stable.<br />
Schools that did not have three or four years of data are not <strong>in</strong>cluded <strong>in</strong> the table.<br />
<strong>Substance</strong> <strong>Use</strong> <strong>and</strong> <strong>Abuse</strong> <strong>in</strong> <strong>Durham</strong> <strong>County</strong> 36
Number of acts<br />
450<br />
400<br />
350<br />
300<br />
250<br />
200<br />
150<br />
100<br />
50<br />
0<br />
286<br />
69<br />
11<br />
Total acts Controlled <strong>Substance</strong>s Alcohol<br />
322<br />
94<br />
388<br />
116<br />
13 21<br />
[Figure 20]<br />
Reportable offenses on school grounds <strong>in</strong> <strong>Durham</strong> Schools, total offenses <strong>and</strong> offenses related to<br />
alcohol <strong>and</strong> controlled substances between 2005-2006 <strong>and</strong> 2011-2012 School Year<br />
341<br />
142<br />
35<br />
284 277<br />
112<br />
94<br />
333<br />
136<br />
13 19 25<br />
2005-2006 2006-2007 2007-2008 2008-2009 2009-2010 2010-2011 2011-2012<br />
School Year<br />
Source: Authors’ tabulations of data available from the NC Department of Public Instruction<br />
[Table 5]<br />
Reportable offenses on school grounds <strong>in</strong> <strong>Durham</strong> middle <strong>and</strong> high schools, average 2009-2010,<br />
2010-2011, 2011-2012<br />
Average # of offenses for Average rate of offenses per<br />
possession of:<br />
1,000 students<br />
Avg. Daily<br />
Membership<br />
Alcohol<br />
<strong>Substance</strong><br />
Alcohol<br />
or<br />
<strong>Substance</strong><br />
Alcohol<br />
<strong>Substance</strong><br />
Alcohol<br />
or<br />
<strong>Substance</strong><br />
<strong>Durham</strong> Public<br />
Schools<br />
31969.7 19.0 114.0 133.0 0.6 3.6 4.2<br />
<strong>Durham</strong> Middle<br />
Schools 6016.0 6.3 15.3 21.7 1.1 2.5 3.6<br />
comb<strong>in</strong>ed<br />
<strong>Durham</strong> High<br />
Schools 9806.7 12.3 96.0 108.3 1.3 9.8 11.0<br />
comb<strong>in</strong>ed*<br />
Source: Authors’ tabulations of data available from the NC Department of Public Instruction.<br />
*Includes one 6th-12th grade school.<br />
<strong>Substance</strong> <strong>Use</strong> <strong>and</strong> <strong>Abuse</strong> <strong>in</strong> <strong>Durham</strong> <strong>County</strong> 37
Arrests on College Campuses<br />
Indicators:<br />
<br />
<br />
Arrests for liquor law violations on college ma<strong>in</strong> campuses.<br />
Arrests for drug violations on college ma<strong>in</strong> campuses.<br />
Relevance: Arrests on specific college campuses for liquor law <strong>and</strong> drug violations provides a<br />
sense of whether – <strong>and</strong> the extent to which – these events are occurr<strong>in</strong>g. When <strong>in</strong>terpret<strong>in</strong>g<br />
changes <strong>in</strong> arrest rates, it is important to note that arrests can vary based both on the prevalence<br />
of a particular crime as well as the resources devoted to polic<strong>in</strong>g a crime.<br />
Data: The Office of Postsecondary Education (OPE) of the U.S. Department of Education provides<br />
<strong>in</strong>formation regard<strong>in</strong>g arrests on college campuses through its Campus Security Data Analysis<br />
Cutt<strong>in</strong>g Tool. All postsecondary <strong>in</strong>stitutions that receive Title IV fund<strong>in</strong>g (the federal student aid<br />
programs) are required to annually submit crime statistics. Data come from the OPE Campus<br />
Security Statistics Web site database (35).<br />
F<strong>in</strong>d<strong>in</strong>gs: There are three ma<strong>in</strong> college campuses <strong>in</strong> <strong>Durham</strong>. Colleges <strong>and</strong> universities <strong>in</strong>clude:<br />
<br />
<br />
<br />
Duke University—private <strong>in</strong>stitution that provides four-year degrees as well as advanced<br />
degrees that enrolled about 15,400 students <strong>in</strong> 2011.<br />
<strong>Durham</strong> Technical Community College awards two year degrees to students <strong>and</strong> enrolled<br />
approximately 5,200 students <strong>in</strong> 2011.<br />
NC Central University, a historically Black university that enrolled about 8,300 students <strong>in</strong><br />
2011.<br />
Figures 21 <strong>and</strong> 22 show the number of arrests for liquor law violations <strong>and</strong> drugs that occurred at<br />
these postsecondary <strong>in</strong>stitutions from 2001-2011 (no data are available for 2006). Duke<br />
University had a relatively large number of arrests (27) <strong>in</strong> 2004 for liquor law violations but none<br />
<strong>in</strong> 2011. The only reported arrests for liquor law or drug violations on the campus of <strong>Durham</strong><br />
Technical Community college were one <strong>in</strong> 2005, two <strong>in</strong> 2007 <strong>and</strong> one <strong>in</strong> 2008 <strong>and</strong> 2009 each.<br />
While NC Central University appeared to have an <strong>in</strong>crease <strong>in</strong> arrests for drugs <strong>in</strong> recent years with<br />
six arrests <strong>in</strong> 2005, 31 <strong>in</strong> 2007 <strong>and</strong> 54 <strong>in</strong> 2008, the number of arrests decreased to 22 <strong>in</strong> 2009, six<br />
<strong>in</strong> 2010, <strong>and</strong> 11 <strong>in</strong> 2011.<br />
<strong>Substance</strong> <strong>Use</strong> <strong>and</strong> <strong>Abuse</strong> <strong>in</strong> <strong>Durham</strong> <strong>County</strong> 38
# of arrests<br />
# of arrests<br />
Duke University<br />
<strong>Durham</strong> Technical Community College<br />
North Carol<strong>in</strong>a Central University<br />
30<br />
25<br />
27<br />
20<br />
21<br />
15<br />
10<br />
5<br />
0<br />
11<br />
9<br />
9 9<br />
8<br />
7 7<br />
3<br />
5<br />
5<br />
4<br />
4<br />
2<br />
2<br />
2<br />
4<br />
0 0 0 0 0 0 0 0 0 0 0<br />
2001 2002 2003 2004 2005 2006 2007 2008 2009 2010 2011<br />
Source: Office of Postsecondary Education<br />
[Figure 21]<br />
Arrests for liquor law violations on college campuses <strong>in</strong> <strong>Durham</strong>: 2001-2011<br />
60<br />
50<br />
Duke University<br />
<strong>Durham</strong> Technical Community College<br />
North Carol<strong>in</strong>a Central University<br />
54<br />
40<br />
30<br />
20<br />
10<br />
0<br />
25<br />
31<br />
19<br />
20<br />
22<br />
12<br />
14<br />
13<br />
13<br />
8 9<br />
12<br />
12<br />
4<br />
11<br />
7<br />
4<br />
6<br />
6<br />
0 0 0 0 1 2 1 1 0 0<br />
2001 2002 2003 2004 2005 2006 2007 2008 2009 2010 2011<br />
Source: Office of Postsecondary Education<br />
[Figure 22]<br />
Arrests for drugs on college campuses <strong>in</strong> <strong>Durham</strong>: 2001-2011<br />
<strong>Substance</strong> <strong>Use</strong> <strong>and</strong> <strong>Abuse</strong> <strong>in</strong> <strong>Durham</strong> <strong>County</strong> 39
Number of Calls to Service<br />
<strong>Substance</strong>-related calls to service to the <strong>Durham</strong> Sheriff’s Office<br />
Indicators: Calls received by the <strong>Durham</strong> <strong>County</strong> Sheriff’s Office for the follow<strong>in</strong>g violations:<br />
<br />
<br />
<br />
<br />
<br />
Narcotics<br />
Drug Compla<strong>in</strong>t<br />
Drunk Driver<br />
Drunk Pedestrian<br />
Alcohol Violation<br />
Data: The <strong>Durham</strong> Sheriff’s Office collects <strong>in</strong>formation on calls to service by various compla<strong>in</strong>ts.<br />
The data provide <strong>in</strong>formation on location <strong>and</strong> date. Currently this is one of the best sources of<br />
<strong>in</strong>formation on location <strong>and</strong> date of crimes related to substance use.<br />
F<strong>in</strong>d<strong>in</strong>gs: Figure 23 provides <strong>in</strong>formation on calls to service to the <strong>Durham</strong> <strong>County</strong> Sheriff’s Office<br />
for potential violations related to controlled substances. From 2011 to 2012 there was<br />
approximately a 32% <strong>in</strong>crease <strong>in</strong> the number of compla<strong>in</strong>ts related to controlled substances.<br />
Narcotics compla<strong>in</strong>ts were down 40% <strong>and</strong> drug compla<strong>in</strong>ts were up 115% dur<strong>in</strong>g this time period.<br />
700<br />
650<br />
600<br />
Total,<br />
573<br />
541<br />
500<br />
400<br />
383 388<br />
481<br />
431<br />
448<br />
460<br />
401<br />
508<br />
493<br />
325<br />
300<br />
200<br />
100<br />
0<br />
Narcotics,<br />
288<br />
260<br />
251<br />
254<br />
239 238<br />
224<br />
207<br />
194<br />
Drug Compla<strong>in</strong>t,<br />
172<br />
175<br />
175 164<br />
187<br />
141<br />
174<br />
127<br />
118<br />
118<br />
146<br />
Drunk Driver,<br />
90<br />
92 97 95<br />
105 98<br />
102<br />
93<br />
72<br />
84<br />
54<br />
88<br />
87<br />
48<br />
Drunk Pedestrian,<br />
63<br />
25<br />
36 34 27<br />
26<br />
7 16 16 19<br />
22 24<br />
20<br />
Alcohol Violation, 6<br />
1 1 2 3 4 1 1 2<br />
6 4 9<br />
2001 2002 2003 2004 2005 2006 2007 2008 2009 2010 2011 2012<br />
Source: Calls to Services from the <strong>Durham</strong> Sheriff's Office provided February 2013<br />
[Figure 23]<br />
<strong>Durham</strong> <strong>County</strong> Sheriff’s Office Calls to Service for Various Violations Related to <strong>Substance</strong>s, 2001-<br />
2012<br />
<strong>Substance</strong> <strong>Use</strong> <strong>and</strong> <strong>Abuse</strong> <strong>in</strong> <strong>Durham</strong> <strong>County</strong> 40
Figure 24 exam<strong>in</strong>es the time <strong>and</strong> day of calls to service by day <strong>and</strong> time. Figures 25 <strong>and</strong> 26<br />
exam<strong>in</strong>e this same data separately for drug <strong>and</strong> alcohol related offenses. Calls to service are<br />
highest from 3-6 pm on Wednesdays—which is largely attributable to drugs rather than alcohol.<br />
Calls to service for alcohol are high dur<strong>in</strong>g late Friday <strong>and</strong> Saturday night <strong>and</strong> early Sunday<br />
morn<strong>in</strong>gs. Currently we cannot dist<strong>in</strong>guish between officer <strong>in</strong>itiated <strong>and</strong> general public <strong>in</strong>itiated<br />
calls. A better <strong>in</strong>dicator might be limit<strong>in</strong>g the analysis to public <strong>in</strong>itiated calls, because this will not<br />
vary based on fluctuations <strong>in</strong> law enforcement resources.<br />
Sunday Monday Tuesday Wednesday Thursday Friday Saturday<br />
12a.m.-2:59a.m. 125 42 38 45 80 85 129<br />
3 a.m.-5:59a.m. 42 9 12 9 16 20 45<br />
6a.m.-8:59a.m. 17 52 46 49 68 48 12<br />
9a.m.-11:59a.m. 19 94 136 168 160 124 33<br />
12p.m.-2:59p.m. 38 148 171 214 196 153 57<br />
3p.m.-5:59p.m. 45 114 214 279 246 172 75<br />
6p.m.-8:59p.m. 64 96 159 191 217 160 125<br />
9p.m.-11:59p.m. 63 71 112 143 180 182 149<br />
Legend<br />
0-50<br />
51-100<br />
101-150<br />
151-200<br />
201-250<br />
251-300<br />
[Figure 24]<br />
Heat map of time <strong>and</strong> day for calls to service related to substance for all years (2001-2012)<br />
Sunday Monday Tuesday Wednesday Thursday Friday Saturday<br />
12a.m.-2:59a.m. 42 17 21 29 48 58 59<br />
3 a.m.-5:59a.m. 15 5 7 4 6 9 14<br />
6a.m.-8:59a.m. 8 44 42 45 61 39 6<br />
9a.m.-11:59a.m. 14 87 126 157 149 114 23<br />
12p.m.-2:59p.m. 23 129 163 201 178 138 32<br />
3p.m.-5:59p.m. 18 85 192 256 213 149 43<br />
6p.m.-8:59p.m. 21 64 131 147 189 110 66<br />
9p.m.-11:59p.m. 17 42 76 117 142 112 61<br />
Legend<br />
0-50<br />
51-100<br />
101-150<br />
151-200<br />
201-250<br />
251-300<br />
[Figure 25]<br />
Heat map of time <strong>and</strong> day for calls to service related to drugs for all years (2001-2012)<br />
<strong>Substance</strong> <strong>Use</strong> <strong>and</strong> <strong>Abuse</strong> <strong>in</strong> <strong>Durham</strong> <strong>County</strong> 41
Sunday Monday Tuesday Wednesday Thursday Friday Saturday<br />
12a.m.-2:59a.m. 83 25 17 16 32 27 70<br />
3 a.m.-5:59a.m. 27 4 5 5 10 11 31<br />
6a.m.-8:59a.m. 9 8 4 4 7 9 6<br />
9a.m.-11:59a.m. 5 7 10 11 11 10 10<br />
12p.m.-2:59p.m. 15 19 8 13 18 15 25<br />
3p.m.-5:59p.m. 27 29 22 23 33 23 32<br />
6p.m.-8:59p.m. 43 32 28 44 28 50 59<br />
9p.m.-11:59p.m. 46 29 36 26 38 70 88<br />
Legend<br />
0-15<br />
16-30<br />
31-45<br />
46-60<br />
61-75<br />
76-90<br />
[Figure 26]<br />
Heat map of time <strong>and</strong> day for calls to service related to alcohol for all years (2001-2012)<br />
Next steps: The data provided by the Sheriff’s office <strong>in</strong>clude <strong>in</strong>formation on the date <strong>and</strong> location<br />
of the call. These data could be analyzed to exam<strong>in</strong>e space <strong>and</strong> time trends. An analysis similar to<br />
the <strong>Durham</strong> Bulls Eye which was designed to focus on areas with violent crime, could exam<strong>in</strong>e<br />
where drug crimes are most likely to occur.<br />
Prescription Drugs<br />
Prescription Drug <strong>Use</strong> <strong>in</strong> <strong>Durham</strong> <strong>County</strong><br />
Indicators:<br />
<br />
<br />
Number of prescription drug-related deaths<br />
Prevalence of prescription drug use <strong>in</strong> <strong>Durham</strong> <strong>County</strong> Middle <strong>and</strong> High School students<br />
from the Youth Risk Behavior Survey (YRBS)<br />
Relevance: Throughout the U.S. prescription drug abuse is a grow<strong>in</strong>g problem, <strong>in</strong> part due to<br />
misperceptions about safety <strong>and</strong> <strong>in</strong>creas<strong>in</strong>g availability of medications (36). <strong>Use</strong> of prescription<br />
pa<strong>in</strong> reliever drugs without a doctor’s prescription is the second most common form of illicit drug<br />
use <strong>in</strong> the U.S. (37). Prescription drug abuse <strong>in</strong>cludes non-medical use of medications, misuse, <strong>and</strong><br />
abuse (7). Approximately 20% of <strong>in</strong>dividuals aged 12 <strong>and</strong> older have misused or abused<br />
prescription drugs at least once <strong>in</strong> their lifetime (36), <strong>and</strong> is the most commonly abused illicit<br />
drugs by high school seniors (36). The risks associated with abus<strong>in</strong>g prescription drugs are<br />
addiction, withdrawal symptoms, adverse health effects, <strong>and</strong> overdose. Un<strong>in</strong>tentional drug<br />
overdose deaths <strong>in</strong> the US has become such a problem that the CDC has def<strong>in</strong>ed prescription drug<br />
<strong>Substance</strong> <strong>Use</strong> <strong>and</strong> <strong>Abuse</strong> <strong>in</strong> <strong>Durham</strong> <strong>County</strong> 42
# of deaths<br />
overdoses as an epidemic (38). In fact, s<strong>in</strong>ce 1999, un<strong>in</strong>tentional overdose deaths <strong>in</strong>volv<strong>in</strong>g opioid<br />
pa<strong>in</strong> relievers have outnumbered deaths <strong>in</strong>volv<strong>in</strong>g hero<strong>in</strong> <strong>and</strong> coca<strong>in</strong>e (39).<br />
Data: Data about deaths were provided by the NC Office of the Chief Medical Exam<strong>in</strong>er.<br />
Individuals <strong>in</strong>clude <strong>Durham</strong> <strong>County</strong> residents; however, the death may have occurred <strong>in</strong> another<br />
county. See below for a list of prescription drugs listed by NCOME. 4<br />
Data about youth use of prescription drugs come from the Youth Risk Behavior Survey (YRBS).<br />
The YRBS was developed by the Centers for Disease Control to monitor health-risk behaviors as<br />
well as various conditions such as obesity <strong>and</strong> asthma. This survey is conducted at the national,<br />
state, <strong>and</strong> local levels. S<strong>in</strong>ce 2007, <strong>Durham</strong> has conducted the YRBS with middle <strong>and</strong> high school<br />
students. 2009 <strong>and</strong> 2011 data were provided by the <strong>Durham</strong> <strong>County</strong> Public Health Department,<br />
<strong>in</strong>clud<strong>in</strong>g all statistical significance tests results(40, 41). Differences between 2011 <strong>and</strong> 2009<br />
percentages were considered statistically significant at a 95% confidence <strong>in</strong>terval. Differences<br />
between 2007-2011 high school data were not analyzed because the 2007 sample <strong>in</strong>cluded mostly<br />
9th grade students.<br />
F<strong>in</strong>d<strong>in</strong>gs:<br />
Figure 27 presents the total number of deaths related to prescription drugs. In 2011 there were<br />
16 deaths related to prescription drugs. Of these, 25% of deaths related to prescription drugs are<br />
female, 75% are male. 2011 deaths by race/ethnicity were: 48% were white, 40% black, 10%<br />
Hispanic,
Table 6 provides <strong>in</strong>formation on prescription drug use among middle school <strong>and</strong> high school<br />
students. Five percent of middle schools <strong>and</strong> 22% of high school students have ever taken a<br />
prescription drugs without a doctor’s prescription.<br />
[Table 6]<br />
Prevalence of prescription drug use among <strong>Durham</strong> middle <strong>and</strong> high school students <strong>in</strong> 2007,<br />
2009 <strong>and</strong> 2011<br />
Have you ever taken a prescription drug such as<br />
OxyCont<strong>in</strong>, Percocet, Demerol, Adderall, Rital<strong>in</strong>,<br />
or Xanax without a doctor’s prescription?<br />
2007<br />
(% yes)<br />
2009<br />
(% yes)<br />
2011<br />
(% yes)<br />
Middle School 3.9 3.3 5.3<br />
High School 12.7 17.1 21.7<br />
Source: <strong>Durham</strong> Youth Risk Behavior Survey<br />
Sig difference<br />
between<br />
2009 & 2011<br />
no significant<br />
difference<br />
no significant<br />
difference<br />
Alcohol<br />
Prevalence of B<strong>in</strong>ge <strong>and</strong> Heavy Dr<strong>in</strong>k<strong>in</strong>g Among Adults<br />
Indicators:<br />
Number <strong>and</strong> percent of <strong>in</strong>dividuals who have participated <strong>in</strong> b<strong>in</strong>ge dr<strong>in</strong>k<strong>in</strong>g <strong>in</strong> the past 30<br />
days.<br />
Number <strong>and</strong> percent of <strong>in</strong>dividuals who report heavy dr<strong>in</strong>k<strong>in</strong>g.<br />
Relevance: Alcohol abuse is associated with b<strong>in</strong>ge dr<strong>in</strong>k<strong>in</strong>g (adults hav<strong>in</strong>g five or more dr<strong>in</strong>ks on<br />
one occasion), heavy dr<strong>in</strong>k<strong>in</strong>g (averag<strong>in</strong>g more than one dr<strong>in</strong>k per day for women or two dr<strong>in</strong>ks<br />
per day for men), <strong>and</strong> underage dr<strong>in</strong>k<strong>in</strong>g. In addition, alcohol consumption dur<strong>in</strong>g pregnancy has<br />
been shown to have serious consequences for young children.<br />
Data: Survey research on alcohol consumption <strong>in</strong> <strong>Durham</strong> <strong>County</strong> comes from the Behavioral Risk<br />
Factor Surveillance System (BRFSS) published by the CDC <strong>and</strong> available from the NC State Center<br />
for Health Statistics (42). Data should be <strong>in</strong>terpreted with caution as the number of respondents to<br />
the BRFSS Alcohol questions is small, <strong>and</strong> some answers had less than 50 respondents answer yes.<br />
F<strong>in</strong>d<strong>in</strong>gs from the 2011 BRFSS are not comparable to results from previous years due to changes<br />
<strong>in</strong> the weight<strong>in</strong>g methodology <strong>and</strong> the question word<strong>in</strong>g. Therefore, the results for 2011 are<br />
presented separately from the figures that track change over time.<br />
See http://www.cdc.gov/brfss/annual_data/annual_2011.htm for more detailed <strong>in</strong>formation<br />
about these changes.<br />
<strong>Substance</strong> <strong>Use</strong> <strong>and</strong> <strong>Abuse</strong> <strong>in</strong> <strong>Durham</strong> <strong>County</strong> 44
Percent respond<strong>in</strong>g yes<br />
F<strong>in</strong>d<strong>in</strong>gs: Us<strong>in</strong>g b<strong>in</strong>ge dr<strong>in</strong>k<strong>in</strong>g <strong>and</strong> heavy dr<strong>in</strong>k<strong>in</strong>g as measures to assess potentially unhealthy<br />
behaviors, there are few differences between <strong>Durham</strong> residents <strong>and</strong> the rest of the state (see<br />
Figures 28 <strong>and</strong> 29). B<strong>in</strong>ge dr<strong>in</strong>k<strong>in</strong>g among <strong>Durham</strong> residents was similar to that of the rest of the<br />
state (15.7% vs. 11.0%). Accord<strong>in</strong>g to the 2010 BRFSS, <strong>in</strong> <strong>Durham</strong> <strong>County</strong> 22.3% of males <strong>and</strong><br />
9.5% of females reported b<strong>in</strong>ge dr<strong>in</strong>k<strong>in</strong>g. A smaller percentage reported heavy dr<strong>in</strong>k<strong>in</strong>g (4.4% of<br />
males <strong>and</strong> 3.8% of females) (42). The overall rate of b<strong>in</strong>ge dr<strong>in</strong>k<strong>in</strong>g did not differ by race (White<br />
vs. m<strong>in</strong>orities) (see Table 7). Among <strong>Durham</strong> residents, heavy dr<strong>in</strong>k<strong>in</strong>g does not differ by gender<br />
or race (42).<br />
[Table 7]<br />
Alcohol consumption among <strong>Durham</strong> <strong>County</strong> <strong>and</strong> NC adults, 2010<br />
<strong>Durham</strong><br />
NC<br />
n Mean (%) CI (95%) Mean (%) CI (95%)<br />
B<strong>in</strong>ge Dr<strong>in</strong>k<strong>in</strong>g <strong>in</strong> last 30 days (5 or more dr<strong>in</strong>ks)<br />
Yes 502 15.5 10.0-23.1 15.2 14.1-16.5<br />
Heavy dr<strong>in</strong>kers (adult men hav<strong>in</strong>g more than two dr<strong>in</strong>ks per day <strong>and</strong> adult women hav<strong>in</strong>g more<br />
than one dr<strong>in</strong>k per day)<br />
Yes 502 4.5 2.7- 7.7 5.6 4.9- 6.5<br />
Source: NC Behavioral Risk Factor Surveillance System (BRFSS).<br />
<strong>Durham</strong><br />
NC<br />
20.0%<br />
15.0%<br />
10.0%<br />
5.0%<br />
9.2 8.4<br />
13.2<br />
10.5<br />
11.9 11.2 11.6 12.3 13.8 12.9<br />
15.7<br />
12.8<br />
15.7<br />
11.0<br />
0.0%<br />
2004 2005 2006 2007 2008 2009 2010<br />
Source: NC Behavioral Risk Factor Surveillance System (BRFSS)<br />
[Figure 28]<br />
<strong>Durham</strong> <strong>County</strong> <strong>and</strong> NC respondents that reported they had five or more dr<strong>in</strong>ks on one or more<br />
occasions <strong>in</strong> the past month (b<strong>in</strong>ge dr<strong>in</strong>k<strong>in</strong>g), 2004-2010<br />
<strong>Substance</strong> <strong>Use</strong> <strong>and</strong> <strong>Abuse</strong> <strong>in</strong> <strong>Durham</strong> <strong>County</strong> 45
Percent respond<strong>in</strong>g yes<br />
14.0%<br />
<strong>Durham</strong><br />
NC<br />
12.0%<br />
10.0%<br />
8.0%<br />
6.0%<br />
4.0%<br />
2.0%<br />
0.0%<br />
7.1<br />
6.3<br />
5.3<br />
2.1 3.2 2.1 2.9 3.4 3.8 3.9<br />
4.4 4.1 3.5<br />
2.2<br />
2004 2005 2006 2007 2008 2009 2010<br />
Source: NC Behavioral Risk Factor Surveillance System (BRFSS)<br />
[Figure 29]<br />
<strong>Durham</strong> <strong>County</strong> <strong>and</strong> NC adult men hav<strong>in</strong>g more than two dr<strong>in</strong>ks per day <strong>and</strong> adult women hav<strong>in</strong>g<br />
more than one dr<strong>in</strong>k per day (heavy dr<strong>in</strong>k<strong>in</strong>g), 2004 -2010<br />
Dr<strong>in</strong>k<strong>in</strong>g <strong>and</strong> Driv<strong>in</strong>g <strong>in</strong> <strong>Durham</strong><br />
Indicators:<br />
Percent of motor vehicle accidents <strong>in</strong>volv<strong>in</strong>g alcohol.<br />
Number <strong>and</strong> percent of fatal crashes <strong>in</strong>volv<strong>in</strong>g alcohol.<br />
Percent of non-fatal motor vehicle accidents <strong>in</strong>volv<strong>in</strong>g alcohol<br />
Rate of impaired driv<strong>in</strong>g convictions.<br />
Rate of arrests for DUI by State Bureau of Investigation.<br />
Percent of <strong>Durham</strong> residents self-report<strong>in</strong>g driv<strong>in</strong>g after hav<strong>in</strong>g consumed too much<br />
alcohol.<br />
Relevance: Dr<strong>in</strong>k<strong>in</strong>g <strong>and</strong> driv<strong>in</strong>g is a burden to society. The annual cost of alcohol-related crashes<br />
is more than $51 billion dollars <strong>in</strong> the U.S. (43). In addition, accord<strong>in</strong>g to a review of the literature<br />
by the National Highway Traffic Safety Adm<strong>in</strong>istration, across the U.S. <strong>in</strong> 2011 (44):<br />
7% of all traffic crashes were alcohol related.<br />
31% of fatal crashes were alcohol related.<br />
There is one alcohol-impaired driv<strong>in</strong>g fatality every 53 m<strong>in</strong>utes.<br />
<strong>Substance</strong> <strong>Use</strong> <strong>and</strong> <strong>Abuse</strong> <strong>in</strong> <strong>Durham</strong> <strong>County</strong> 46
16% of children aged 0-14 years who died <strong>in</strong> a motor vehicle accident died <strong>in</strong> alcoholrelated<br />
crashes.<br />
50% of the children killed <strong>in</strong> alcohol-related deaths were passengers <strong>in</strong> vehicles with<br />
drivers who had been dr<strong>in</strong>k<strong>in</strong>g.<br />
32% of deaths <strong>in</strong> drivers aged 21-24 years old had a BAC of .08 or higher.<br />
Drivers with a BAC of .08 or higher <strong>in</strong>volved <strong>in</strong> fatal crashes were seven times more likely<br />
to have a prior conviction for driv<strong>in</strong>g while impaired (DWI) than were drivers with no<br />
alcohol.<br />
In 2010:<br />
Alcohol <strong>in</strong>volvement — either for the driver or for the pedestrian — was reported <strong>in</strong> 47%<br />
of the traffic crashes that resulted <strong>in</strong> pedestrian fatalities. In 33% of pedestrian deaths, the<br />
pedestrian had a .08 blood alcohol count (BAC) or higher.<br />
In 48% of pedestrian deaths among <strong>in</strong>dividuals aged 21-24 years, the pedestrian had a .08<br />
BAC or higher.<br />
In 2011 <strong>in</strong> NC (45):<br />
Nearly a third of all fatal crashes occurr<strong>in</strong>g <strong>in</strong> NC <strong>in</strong>volved alcohol.<br />
A reportable crash was 1.7 times more likely to be serious enough to cause <strong>in</strong>jury if alcohol<br />
was <strong>in</strong>volved.<br />
Crashes <strong>in</strong>volv<strong>in</strong>g <strong>in</strong>jury were 6 times more likely to <strong>in</strong>clude a fatality if alcohol was<br />
<strong>in</strong>volved.<br />
While one of every 20 crashes <strong>in</strong>volved alcohol, one of every three fatal crashes <strong>and</strong> one of<br />
every 12 non-fatal <strong>in</strong>jury crashes <strong>in</strong>volved alcohol.<br />
Data: The data come from the NC Alcohol Facts Web site(46). This Web site <strong>in</strong>cludes <strong>in</strong>formation<br />
on impaired driv<strong>in</strong>g cases from the NC Adm<strong>in</strong>istrative Office of the Courts (AOC) <strong>and</strong> motor<br />
vehicle crashes from the NC Division of Motor Vehicles for the years 2000-2011. Arrests for<br />
driv<strong>in</strong>g under the <strong>in</strong>fluence are collected by the State Bureau of Investigation (SBI). The Federal<br />
Bureau of Investigation coord<strong>in</strong>ates a national effort to collect arrest data <strong>in</strong> a consistent format<br />
from all law enforcement agencies across the country. Beg<strong>in</strong>n<strong>in</strong>g <strong>in</strong> 1973, law enforcement<br />
agencies across NC have voluntarily submitted <strong>in</strong>formation to the State Bureau of Investigation on<br />
specific crimes committed <strong>in</strong> their area of jurisdiction on arrests by age, gender, <strong>and</strong> race of the<br />
perpetrator. For <strong>Durham</strong>, the <strong>Durham</strong> Police Department, <strong>County</strong> Sheriff’s Office, Eno River State<br />
Park, NC Central University, <strong>and</strong> Duke University each report arrests. Self-report data on dr<strong>in</strong>k<strong>in</strong>g<br />
<strong>and</strong> driv<strong>in</strong>g come from the BRFSS.<br />
F<strong>in</strong>d<strong>in</strong>gs: While dr<strong>in</strong>k<strong>in</strong>g <strong>and</strong> driv<strong>in</strong>g is a problem <strong>in</strong> most communities, <strong>Durham</strong> problems are <strong>in</strong><br />
l<strong>in</strong>e with NC averages. In 2011 <strong>in</strong> <strong>Durham</strong> <strong>County</strong>, 3.9% of all reported crashes were related to<br />
alcohol, compared to 5.1% <strong>in</strong> NC (45). There has been a slight decrease compared to the rise seen<br />
<strong>in</strong> 2008 (3.7%, 3.8%, <strong>and</strong> 3.9% for years 2009-2011 compared to 4.3 <strong>in</strong> 2008). A small number of<br />
these crashes result <strong>in</strong> fatalities.<br />
<strong>Substance</strong> <strong>Use</strong> <strong>and</strong> <strong>Abuse</strong> <strong>in</strong> <strong>Durham</strong> <strong>County</strong> 47
The number of fatal crashes <strong>in</strong> <strong>Durham</strong> <strong>County</strong> has not changed much s<strong>in</strong>ce 2004; however, the<br />
percent of fatal crashes related to alcohol has <strong>in</strong>creased s<strong>in</strong>ce 2004 (see Table 8). Exceptions<br />
<strong>in</strong>clude 2010, which had a larger number of crashes, <strong>and</strong> 2009, which had a small percentage of<br />
fatal crashes which were related to alcohol.<br />
[Table 8]<br />
Total crashes <strong>and</strong> fatal crashes <strong>in</strong> <strong>Durham</strong> <strong>County</strong> related to alcohol, 2004-2011<br />
2004 2005 2006 2007 2008 2009 2010 2011<br />
Total Crashes 8,510 8,366 7,650 7,654 7,459 7,424 7,234 7,725<br />
Total Crashes<br />
related to alcohol<br />
283 300 287 261 318 276 276 304<br />
Fatal Crashes 31 21 22 21 23 16 21 12<br />
Fatal Crashes<br />
related to alcohol<br />
7 3 3 5 7 2 12 4<br />
% of total crashes<br />
related to alcohol<br />
3.3% 3.6% 3.8% 3.4% 4.3% 3.7% 3.8% 3.9%<br />
% of fatal crashes<br />
related to alcohol<br />
22.6% 14.3% 13.6% 23.8% 30.4% 12.5% 57.1% 33.3%<br />
Source: NC Alcohol Facts<br />
Of all the crashes that resulted <strong>in</strong> <strong>in</strong>juries <strong>in</strong> <strong>Durham</strong> <strong>County</strong>, alcohol plays a major role. Accord<strong>in</strong>g<br />
to the NC Division of Motor Vehicles, 33.3% of these fatal accidents <strong>in</strong>volved alcohol <strong>in</strong> 2011,<br />
which is similar to NC (32.6%) (45). Approximately 242 <strong>in</strong>juries <strong>in</strong> 2011 <strong>in</strong> <strong>Durham</strong> <strong>County</strong> were<br />
related to traffic accidents <strong>in</strong>volv<strong>in</strong>g alcohol. Look<strong>in</strong>g at Figure 30, s<strong>in</strong>ce 2000, of all reported<br />
crashes with fatal <strong>in</strong>juries, a higher percentage of these crashes were related to alcohol compared<br />
to the percentage of crashes with non-fatal <strong>in</strong>juries that were related to alcohol. For example, <strong>in</strong><br />
2011, 33.3% of crashes that resulted <strong>in</strong> a fatal <strong>in</strong>jury were related to alcohol, while only 7.6% of<br />
crashes with a non-fatal <strong>in</strong>jury were related to alcohol.<br />
<strong>Substance</strong> <strong>Use</strong> <strong>and</strong> <strong>Abuse</strong> <strong>in</strong> <strong>Durham</strong> <strong>County</strong> 48
Number of cases<br />
Percent of crashes related to alcohol<br />
70%<br />
Crashes with Non-Fatal Injuries<br />
Crashes with Fatal Injuries<br />
60%<br />
59.1<br />
50%<br />
40%<br />
30%<br />
20%<br />
10%<br />
33.3<br />
30<br />
30.4<br />
22 22<br />
24<br />
21.9<br />
22.7<br />
14.3<br />
12.5<br />
11.1<br />
7 8 7 6 5.8 5.7 5.5 6.1 7.4 7.1 6.6 7.6<br />
0%<br />
2000 2001 2002 2003 2004 2005 2006 2007 2008 2009 2010 2011<br />
Source: North Carol<strong>in</strong>a Alcohol Facts<br />
[Figure 30]<br />
Percent of crashes with non-fatal <strong>and</strong> fatal <strong>in</strong>juries that were related to alcohol <strong>in</strong> <strong>Durham</strong> <strong>County</strong>,<br />
2000-2011<br />
In NC, dr<strong>in</strong>k<strong>in</strong>g-driv<strong>in</strong>g charges fall <strong>in</strong>to five categories <strong>in</strong> the judicial system:<br />
<br />
<br />
<br />
<br />
<br />
Misdemeanor Aid <strong>and</strong> Abet Impaired Driv<strong>in</strong>g.<br />
Misdemeanor Drive After Consum<strong>in</strong>g.<br />
Misdemeanor Driv<strong>in</strong>g While Impaired.<br />
Misdemeanor DWI Commercial Vehicle.<br />
Felony Habitual Impaired Driv<strong>in</strong>g.<br />
Each impaired driv<strong>in</strong>g charge is a cost to the judicial system <strong>in</strong> <strong>Durham</strong> <strong>County</strong>. S<strong>in</strong>ce 2000, the<br />
number of disposed impaired cases has decl<strong>in</strong>ed, although the number has been ris<strong>in</strong>g slightly<br />
s<strong>in</strong>ce 2008 (see Figure 31).<br />
2,100<br />
1,900<br />
1,700<br />
1,500<br />
1,927<br />
1,701<br />
1,502<br />
Total Disposed Cases<br />
1,337 1,328 1,282 1,277<br />
1,184<br />
1,018 1,106 1,275 1,358<br />
1,300<br />
1,100<br />
900<br />
2000 2001 2002 2003 2004 2005 2006 2007 2008 2009 2010 2011<br />
Source: North Carol<strong>in</strong>a Alcohol Facts<br />
[Figure 31]<br />
Disposed impaired driv<strong>in</strong>g cases <strong>in</strong> <strong>Durham</strong> <strong>County</strong>, 2000-2011<br />
<strong>Substance</strong> <strong>Use</strong> <strong>and</strong> <strong>Abuse</strong> <strong>in</strong> <strong>Durham</strong> <strong>County</strong> 49
Arrest rate, per 1,000 population<br />
Arrest rate, per 1,000 population<br />
Arrest rates for driv<strong>in</strong>g under the <strong>in</strong>fluence have also been on the decl<strong>in</strong>e s<strong>in</strong>ce 2000 – both for<br />
adults <strong>and</strong> juveniles <strong>in</strong> <strong>Durham</strong> <strong>County</strong> as well as NC (24). For both adults <strong>and</strong> juveniles, arrest<br />
rates are lower <strong>in</strong> <strong>Durham</strong> <strong>County</strong> compared to NC. Rates for juveniles are much lower. See<br />
Figures 32 <strong>and</strong> 33 for arrest rates <strong>in</strong> adults <strong>and</strong> juveniles <strong>in</strong> both <strong>Durham</strong> <strong>County</strong> <strong>and</strong> NC.<br />
12.0<br />
10.0<br />
8.0<br />
9.4<br />
11.0<br />
Adults 18 <strong>and</strong> Over-<strong>Durham</strong><br />
10.0<br />
9.2<br />
8.7<br />
8.2 8.1<br />
Adults 18 <strong>and</strong> Over-NC<br />
7.5<br />
7.8 7.7 7.5<br />
7.0<br />
6.0<br />
4.0<br />
2.0<br />
4.1<br />
4.5<br />
3.4 3.3 3.6 3.8<br />
3.2 3.0 2.8<br />
2.3<br />
2.9<br />
1.6<br />
0.0<br />
2000 2001 2002 2003 2004 2005 2006 2007 2008 2009 2010 2011<br />
Source: North Carol<strong>in</strong>a State Bureau of Investigation<br />
[Figure 32]<br />
DUI arrest rates <strong>in</strong> adults <strong>in</strong> <strong>Durham</strong> <strong>County</strong> <strong>and</strong> NC, 2000-2011<br />
0.5<br />
0.4<br />
0.4<br />
0.3<br />
0.3<br />
0.2<br />
0.2<br />
0.1<br />
0.1<br />
0.0<br />
0.3<br />
0.1<br />
0.4 0.4<br />
0.2 0.1<br />
0.3<br />
0.1<br />
Juveniles Under 18- <strong>Durham</strong><br />
Juveniles Under 18- NC<br />
Source: North Carol<strong>in</strong>a State Bureau of Investigation<br />
[Figure 33]<br />
DUI arrest rates <strong>in</strong> juveniles <strong>in</strong> <strong>Durham</strong> <strong>County</strong> <strong>and</strong> NC, 2000-2011<br />
0.3<br />
0.2<br />
0.3<br />
0.1<br />
0.3<br />
0.03<br />
0.3<br />
0.05<br />
0.3 0.3<br />
0.1<br />
0.02<br />
0.2 0.2<br />
0.03<br />
2000 2001 2002 2003 2004 2005 2006 2007 2008 2009 2010 2011<br />
0.1<br />
<strong>Substance</strong> <strong>Use</strong> <strong>and</strong> <strong>Abuse</strong> <strong>in</strong> <strong>Durham</strong> <strong>County</strong> 50
Percent respond<strong>in</strong>g yes<br />
Based upon statistics regard<strong>in</strong>g alcohol-related crashes <strong>and</strong> <strong>in</strong>juries, the number of court cases for<br />
dr<strong>in</strong>k<strong>in</strong>g <strong>and</strong> driv<strong>in</strong>g, <strong>and</strong> the number of arrests for dr<strong>in</strong>k<strong>in</strong>g <strong>and</strong> driv<strong>in</strong>g, <strong>Durham</strong> seems to be <strong>in</strong><br />
l<strong>in</strong>e with or perform<strong>in</strong>g slightly better than the state of NC. However, it is <strong>in</strong>terest<strong>in</strong>g to note that<br />
while the number of disposed cases <strong>and</strong> DUI arrests has been on the decl<strong>in</strong>e, the percent of fatal<br />
crashes related to alcohol has seen a slight <strong>in</strong>crease. In 2010, self-reported dr<strong>in</strong>k<strong>in</strong>g <strong>and</strong> driv<strong>in</strong>g <strong>in</strong><br />
<strong>Durham</strong> residents was similar to NC respondents (see Figure 34 for self-reported dr<strong>in</strong>k<strong>in</strong>g <strong>and</strong><br />
driv<strong>in</strong>g).<br />
<strong>Durham</strong><br />
NC<br />
16.0%<br />
14.0%<br />
12.0%<br />
10.0%<br />
8.0%<br />
6.0%<br />
4.0%<br />
2.0%<br />
0.0%<br />
3.7 1.4 3.9 0.8 7.2 2.3 1.6 1.1 3.3 3.1 2.3 2.6<br />
Once<br />
2004<br />
Two<br />
or<br />
more<br />
times<br />
Once<br />
2006<br />
Source: NC Behavioral Risk Factor Surveillance<br />
[Figure 34]<br />
Percent population who reported driv<strong>in</strong>g after dr<strong>in</strong>k<strong>in</strong>g too much <strong>in</strong> <strong>Durham</strong> <strong>and</strong> NC, 2004-2010<br />
More<br />
than<br />
once<br />
One or<br />
more<br />
times<br />
2008<br />
One or<br />
more<br />
times<br />
2010<br />
<strong>Substance</strong> <strong>Use</strong> <strong>and</strong> <strong>Abuse</strong> <strong>in</strong> <strong>Durham</strong> <strong>County</strong> 51
Smok<strong>in</strong>g<br />
Prevalence of smok<strong>in</strong>g among adults <strong>and</strong> long-term health consequences<br />
Indicators:<br />
<br />
<br />
<br />
Number of adults (<strong>in</strong>dividuals age>18) who smoke<br />
Percent of pregnant women who smoke<br />
Rate of lung <strong>and</strong> bronchial cancer deaths (long-term <strong>in</strong>dicator)<br />
Relevance: Smok<strong>in</strong>g is the lead<strong>in</strong>g cause of preventable death. Accord<strong>in</strong>g to the CDC, “more<br />
deaths are caused each year by tobacco use than by all deaths from human immunodeficiency<br />
virus (HIV), illegal drug use, alcohol use, motor vehicle <strong>in</strong>juries, suicides, <strong>and</strong> murders comb<strong>in</strong>ed”<br />
(47). Across the nation, approximately 20% of deaths each year are attributable to smok<strong>in</strong>g or<br />
secondh<strong>and</strong> smoke (47, 48).<br />
The follow<strong>in</strong>g is a partial list of the negative consequences of tobacco use:<br />
Cancer: Cancer is a lead<strong>in</strong>g cause of death <strong>in</strong> the U.S., NC, <strong>and</strong> <strong>Durham</strong>.<br />
o Lung cancer is the most common form of cancer <strong>in</strong> both males <strong>and</strong> females. Smok<strong>in</strong>g<br />
is an attribut<strong>in</strong>g factor <strong>in</strong> the majority of lung cancer deaths (90% for males <strong>and</strong><br />
80% for females).<br />
o Smok<strong>in</strong>g <strong>in</strong>creases the risk of a variety of cancers <strong>in</strong>clud<strong>in</strong>g cancer of the oral cavity,<br />
pharynx, larynx, esophagus, lung, bladder, stomach, cervix, kidney, <strong>and</strong> pancreas, as<br />
well as myeloid leukemia.<br />
Coronary Heart Disease <strong>and</strong> Stroke: Coronary heart disease is the lead<strong>in</strong>g cause of death<br />
<strong>and</strong> stroke, <strong>and</strong> it is the third lead<strong>in</strong>g cause of death <strong>in</strong> the U.S.<br />
Other Health Effects<br />
o Smok<strong>in</strong>g leads to reproductive health problems:<br />
• Reduces women’s fertility.<br />
• Leads to complications <strong>in</strong> pregnancy, premature birth, low-birth-weight<br />
<strong>in</strong>fants, still birth, <strong>and</strong> <strong>in</strong>fant death.<br />
• Decreases the immune system’s ability to fight <strong>in</strong>fections lead<strong>in</strong>g to:<br />
<br />
<br />
<br />
More missed work.<br />
Higher rates of medical care use.<br />
More admissions to the hospital.<br />
Data: Survey research on smok<strong>in</strong>g behavior <strong>in</strong> <strong>Durham</strong> <strong>County</strong> comes from the Behavioral Risk<br />
Factor Surveillance System (BRFSS) published by the CDC <strong>and</strong> available from the NC State Center<br />
for Health Statistics. Data on a mother’s smok<strong>in</strong>g dur<strong>in</strong>g pregnancy come from the NC Vital<br />
Statistics, Volume 1: Population, Births, Deaths, Marriages, Divorces, <strong>and</strong> is accessed from the NC<br />
<strong>Substance</strong> <strong>Use</strong> <strong>and</strong> <strong>Abuse</strong> <strong>in</strong> <strong>Durham</strong> <strong>County</strong> 52
Percent respond<strong>in</strong>g yes<br />
State Center for Health Statistics. These data are collected from birth certificates of all babies born<br />
that are residents of <strong>Durham</strong> <strong>County</strong>. Additional <strong>in</strong>formation on mother’s smok<strong>in</strong>g status comes<br />
from the BABY BOOK, various maternal <strong>and</strong> <strong>in</strong>fant variables such as age, race, birth order, birth<br />
weight, <strong>and</strong> number of prenatal visits, as well as medical conditions of the mother, the<br />
labor/delivery, <strong>and</strong> the newborn.<br />
F<strong>in</strong>d<strong>in</strong>gs from the 2011 BRFSS are not comparable to results from previous years due to changes<br />
<strong>in</strong> the weight<strong>in</strong>g methodology <strong>and</strong> the question word<strong>in</strong>g. Therefore, the results for 2011 are<br />
presented separately from the figures that track change over time.<br />
See http://www.cdc.gov/brfss/annual_data/annual_2011.htm for more detailed <strong>in</strong>formation<br />
about these changes.<br />
F<strong>in</strong>d<strong>in</strong>gs:<br />
Smok<strong>in</strong>g <strong>in</strong> Adults<br />
Accord<strong>in</strong>g to data from the Behavioral Risk Factor Surveillance System (BRFSS), approximately<br />
14.7% of <strong>Durham</strong> residents over the age of 18 were current smokers <strong>in</strong> 2010 (see Figure 35) (42).<br />
In 2010, 7.0% of respondents reported smok<strong>in</strong>g every day (see Figure 36). Table 9 shows<br />
responses to questions about smok<strong>in</strong>g from the BRFSS. For smok<strong>in</strong>g rates <strong>in</strong> males <strong>and</strong> females<br />
see Figure 37, for smok<strong>in</strong>g rates <strong>in</strong> m<strong>in</strong>orities <strong>and</strong> whites see Figure 38.<br />
<strong>Durham</strong><br />
NC<br />
25.0%<br />
20.0%<br />
15.0%<br />
10.0%<br />
18.5<br />
22.5<br />
16.4<br />
22.6<br />
18.0<br />
22.1<br />
22.9<br />
20.9<br />
18.4<br />
20.3<br />
14.7<br />
19.8<br />
5.0%<br />
11.1<br />
10.6<br />
0.0%<br />
2004 2005 2006 2007 2008 2009 2010<br />
Source: NC Behavioral Risk Factor Surveillance System (BRFSS)<br />
[Figure 35]<br />
Percentage of adults report<strong>in</strong>g they are current smokers <strong>in</strong> <strong>Durham</strong> <strong>and</strong> NC, 2004 to 2010<br />
<strong>Substance</strong> <strong>Use</strong> <strong>and</strong> <strong>Abuse</strong> <strong>in</strong> <strong>Durham</strong> <strong>County</strong> 53
Percent respond<strong>in</strong>g yes<br />
<strong>Durham</strong><br />
NC<br />
20.0%<br />
15.0%<br />
10.0%<br />
5.0%<br />
13.1<br />
17.2<br />
9.3<br />
17.1<br />
9.2<br />
17.0<br />
7.6<br />
17.6<br />
11.7<br />
15.5<br />
6.2<br />
14.4<br />
7.0<br />
14.3<br />
0.0%<br />
2004 2005 2006 2007 2008 2009 2010<br />
Source: NC Behavioral Risk Factor Surveillance System (BRFSS)<br />
[Figure 36]<br />
Percentage of adults report<strong>in</strong>g smok<strong>in</strong>g every day <strong>in</strong> <strong>Durham</strong> <strong>and</strong> NC, 2004 to 2010<br />
[Table 9]<br />
Smok<strong>in</strong>g status of adults <strong>in</strong> <strong>Durham</strong> <strong>and</strong> NC, 2010.<br />
<strong>Durham</strong><br />
Confidence<br />
Mean<br />
Mean<br />
NC<br />
Confidence<br />
Interval<br />
Interval<br />
Adults who are current smokers (%) 12.4 8.1-18.6 21.8 20.5-23.1<br />
Four levels of smok<strong>in</strong>g status (%)<br />
Smoke every day 8.9 5.2-14.9 15.6 14.5-16.8<br />
Smoke some days 3.5 1.9- 6.5 6.1 5.4- 7.0<br />
Former smoker 19.3 14.2-25.7 24.8 23.6-26.0<br />
Never smoked 68.3 60.4-75.2 53.4 51.9-54.9<br />
Source: NC Behavioral Risk Factor Surveillance System (BRFSS)<br />
<strong>Substance</strong> <strong>Use</strong> <strong>and</strong> <strong>Abuse</strong> <strong>in</strong> <strong>Durham</strong> <strong>County</strong> 54
Percent respond<strong>in</strong>g yes<br />
Percent respond<strong>in</strong>g yes<br />
Male<br />
Female<br />
40.0%<br />
35.0%<br />
30.0%<br />
25.0%<br />
20.0%<br />
15.0%<br />
10.0%<br />
5.0%<br />
22.6<br />
14.8<br />
20.7<br />
12.4<br />
20.2<br />
15.2<br />
12.0 10.2<br />
23.6<br />
12.3<br />
14.4<br />
7.2<br />
18.7<br />
11.0<br />
0.0%<br />
2004 2005 2006 2007 2008 2009 2010<br />
Source: NC Behavioral Risk Factor Surveillance System (BRFSS)<br />
[Figure 37]<br />
Percent of <strong>Durham</strong> <strong>County</strong> adults who report currently smok<strong>in</strong>g, male vs. female, 2004 to 2010<br />
40.0%<br />
35.0%<br />
30.0%<br />
White<br />
M<strong>in</strong>ority<br />
25.0%<br />
20.0%<br />
15.0%<br />
10.0%<br />
5.0%<br />
0.0%<br />
24.6<br />
23.2<br />
22.7<br />
19.6<br />
13.5<br />
15.2<br />
12.8<br />
13.1 12.7<br />
10.7<br />
9.4<br />
6.6<br />
19.1<br />
10.5<br />
2004 2005 2006 2007 2008 2009 2010<br />
Source: NC Behavioral Risk Factor Surveillance System (BRFSS)<br />
[Figure 38]<br />
Percent of adults <strong>in</strong> <strong>Durham</strong> who report currently smok<strong>in</strong>g, White vs. M<strong>in</strong>ority 2004 to 2010<br />
<strong>Substance</strong> <strong>Use</strong> <strong>and</strong> <strong>Abuse</strong> <strong>in</strong> <strong>Durham</strong> <strong>County</strong> 55
Smok<strong>in</strong>g Related Deaths<br />
Accord<strong>in</strong>g to data from the 2013 <strong>County</strong> Health Data Book, the lead<strong>in</strong>g cause of death between<br />
2007 <strong>and</strong> 2011 for <strong>Durham</strong> residents was cancer (49). The lead<strong>in</strong>g type of cancer was lung cancer<br />
(trachea, bronchus, <strong>and</strong> lung) (see Table 10). The next lead<strong>in</strong>g type of cancer was breast cancer <strong>in</strong><br />
females <strong>and</strong> prostate cancer <strong>in</strong> males (breast cancer rate=25.7; prostate cancer rate=31.6).<br />
However, lung cancer rates were still 1.9 <strong>and</strong> 1.5 times higher than breast <strong>and</strong> prostate cancer<br />
rates dur<strong>in</strong>g 2007 <strong>and</strong> 2011. The only group where lung cancer was not the lead<strong>in</strong>g cause of death<br />
was for African-Americans, non-Hispanic (prostate cancer rate=56.0; lung cancer rate=54.4). From<br />
2007-2011, the <strong>Durham</strong> <strong>County</strong> <strong>and</strong> state death rates for cancers of the trachea, bronchus, <strong>and</strong><br />
lung were similar (<strong>Durham</strong> – 49.2 vs. NC – 54.5) (49).<br />
[Table 10]<br />
Cancer death rates <strong>in</strong> <strong>Durham</strong> <strong>County</strong>, 2007-2011 average<br />
White, non- African American,<br />
Hispanic rate non-Hispanic rate<br />
Hispanic<br />
rate<br />
Male<br />
rate<br />
Female<br />
rate<br />
Overall<br />
rate<br />
All cancer 173.9 216.7 55.3 236.8 150.4 184.5<br />
Trachea, bronchus, <strong>and</strong> lung 47.7 54.4 N/A 66.2 37.2 49.2<br />
Source: 2013 <strong>County</strong> Health Data Book: 2007-2011 NC Resident Race/Ethnicity-Specific <strong>and</strong> Sex-<br />
Specific Age-Adjusted Death Rates<br />
Smok<strong>in</strong>g <strong>in</strong> Pregnant Women<br />
Whether the mother smoked dur<strong>in</strong>g pregnancy is recorded on the newborn’s birth certificate <strong>and</strong><br />
is available from Vital Records from the NC State Center for Health Statistics. In 2010 NC revised<br />
the birth records mak<strong>in</strong>g tobacco use not comparable with prior years (50).<br />
In 2011, the NC State Center for Health Statistics began report<strong>in</strong>g more categories of races <strong>and</strong><br />
ethnicities; Table 11 has data from 2011. In 2011, 5.6% of pregnant women <strong>in</strong> <strong>Durham</strong> smoked.<br />
This compares with 10.9% of pregnant women across the state.<br />
[Table 11]<br />
Percent of mothers who smoked dur<strong>in</strong>g pregnancy <strong>in</strong> <strong>Durham</strong> <strong>and</strong> NC, 2011<br />
2011<br />
<strong>Durham</strong>-Total 5.6%<br />
<strong>Durham</strong>-White, non-Hispanic 4.3%<br />
<strong>Durham</strong>-African-American, non-Hispanic 10.7%<br />
<strong>Durham</strong>-Other, non-Hispanic 1.7%<br />
<strong>Durham</strong>-Hispanic 1.3%<br />
NC-Total 10.9%<br />
NC-White, non-Hispanic 14.0%<br />
NC-African-American, non-Hispanic 10.3%<br />
NC-Other, non-Hispanic 7.5%<br />
NC-Hispanic 1.7%<br />
Source: 2011 Basic Automated Birth Yearbook NC Residents (The BABY Book).<br />
<strong>Substance</strong> <strong>Use</strong> <strong>and</strong> <strong>Abuse</strong> <strong>in</strong> <strong>Durham</strong> <strong>County</strong> 56
% of women who smoked dur<strong>in</strong>g pregnancy<br />
Figure 39 shows the percent of pregnant women who reportedly smoked dur<strong>in</strong>g pregnancy from<br />
1998 to 2011 (51). Due to NC adapt<strong>in</strong>g the 2003 revision of the U.S. St<strong>and</strong>ard Certificate of Live<br />
Birth <strong>in</strong> August of 2010, data on tobacco use were not reported <strong>in</strong> 2010.<br />
Over time, there has been a decl<strong>in</strong>e <strong>in</strong> the percentage of pregnant women smok<strong>in</strong>g <strong>in</strong> both <strong>Durham</strong><br />
<strong>and</strong> the state. However, s<strong>in</strong>ce 2006 there was an <strong>in</strong>crease <strong>in</strong> the percentage of pregnant women<br />
who smoked <strong>in</strong> <strong>Durham</strong> <strong>County</strong>. This <strong>in</strong>crease is <strong>in</strong> part driven by the <strong>in</strong>crease <strong>in</strong> smok<strong>in</strong>g rates of<br />
pregnant m<strong>in</strong>ority women <strong>in</strong> <strong>Durham</strong> <strong>County</strong>. In fact, <strong>in</strong> <strong>Durham</strong> <strong>County</strong>, m<strong>in</strong>ority women are<br />
more likely to have reportedly smoked dur<strong>in</strong>g pregnancy versus white women. This is different<br />
when compared to the state data (see reference (3) for more <strong>in</strong>formation on this trend between<br />
1998 <strong>and</strong> 2009).<br />
<strong>Durham</strong>-Total<br />
NC - Total<br />
16.0%<br />
14.0%<br />
14.9<br />
14.3<br />
14.0 14.0<br />
12.0%<br />
10.0%<br />
13.2<br />
12.7 12.5<br />
12.1<br />
11.5<br />
11.0<br />
10.4<br />
10.2<br />
10.9%<br />
8.0%<br />
6.0%<br />
7.0<br />
6.6<br />
4.0%<br />
5.6 5.5<br />
5.2<br />
4.6<br />
4.1 3.9<br />
5.6<br />
5.3 5.4 5.6%<br />
2.0%<br />
3.1<br />
0.0%<br />
1998 1999 2000 2001 2002 2003 2004 2005 2006 2007 2008 2009 2010 2011<br />
Source: Basic Automated Birth Yearbook North Carol<strong>in</strong>a Residents (The BABY Book).<br />
[Figure 39]<br />
Percent of mothers who smoked dur<strong>in</strong>g pregnancy <strong>in</strong> <strong>Durham</strong> <strong>and</strong> NC, 1998-2011<br />
<strong>Substance</strong> <strong>Use</strong> <strong>and</strong> <strong>Abuse</strong> <strong>in</strong> <strong>Durham</strong> <strong>County</strong> 57
Quitt<strong>in</strong>g Smok<strong>in</strong>g<br />
When an <strong>in</strong>dividual stops smok<strong>in</strong>g, he or she will experience immediate benefits such as reduced<br />
risks of stroke, coronary heart disease, <strong>and</strong> many cancers (52). When pregnant women quit by the<br />
first trimester of pregnancy, the chance of hav<strong>in</strong>g a low birth weight baby is the same as for<br />
nonsmokers.<br />
Resources for Quitt<strong>in</strong>g<br />
QuitNow NC! is a statewide tobacco use cessation partnership that provides resources to help<br />
North Carol<strong>in</strong>ians quit tobacco. They refer <strong>in</strong>dividuals to Quitl<strong>in</strong>eNC, a statewide support service<br />
to help any NC resident quit tobacco use. Services are available for free by telephone <strong>and</strong> on the<br />
web. The Quitl<strong>in</strong>eNC Web site (http://quitl<strong>in</strong>enc.org/home) provides not only coach<strong>in</strong>g for users<br />
look<strong>in</strong>g to quit, but also <strong>in</strong>formation for health care providers <strong>and</strong> <strong>in</strong>dividuals look<strong>in</strong>g to support<br />
tobacco users who are quitt<strong>in</strong>g, as well as <strong>in</strong>formation about community resources. The BRFSS<br />
asks respondents whether they are aware of the QuitNow NC! or the Quitl<strong>in</strong>eNC.org website. Table<br />
12 shows the <strong>Durham</strong> respondents’ answers from 2009 -2011. Before 2009 they only asked this<br />
question of people who reported be<strong>in</strong>g current smokers, <strong>in</strong> 2009 they asked the question of<br />
everyone.<br />
[Table 12]<br />
<strong>Durham</strong> residents who are aware of the Quitl<strong>in</strong>eNC web site or QuitNow NC!<br />
Total respondents Yes (%) C.I. (95%)<br />
2009 381 42.6 35.3-50.2<br />
2010 567 43.0 37.1-49.2<br />
2011 261 40.5 31.4-50.3<br />
Source: NC Behavioral Risk Factor Surveillance System (BRFSS)<br />
Network of Care for Children & Family Services. Network of Care is a “No Wrong Door” onl<strong>in</strong>e<br />
<strong>in</strong>formation place for the <strong>in</strong>dividuals, families, <strong>and</strong> agencies look<strong>in</strong>g for resources. This onl<strong>in</strong>e<br />
community provides critical <strong>in</strong>formation, communication, <strong>and</strong> advocacy tools with a s<strong>in</strong>gle po<strong>in</strong>t<br />
of entry. The Web site conta<strong>in</strong>s a search tool for smok<strong>in</strong>g cessation services available <strong>in</strong> <strong>Durham</strong>.<br />
(http://durham.nc.networkofcare.org/family/home/<strong>in</strong>dex.cfm )<br />
National: http://www.cdc.gov/tobacco/quit_smok<strong>in</strong>g/<strong>in</strong>dex.htm<br />
Quit l<strong>in</strong>es:<br />
1-800 QUIT NOW (1-800-784-8669)<br />
Available 24 hours a day, 7 days a week<br />
Available <strong>in</strong> English, Spanish, <strong>and</strong> other<br />
languages<br />
For deaf/hard-of-hear<strong>in</strong>g: TTY 1-877-777-6534<br />
Quit l<strong>in</strong>e for pregnant smokers:<br />
American Legacy Foundation 1-866-667-8278<br />
Available Monday-Friday 8 a.m. - 8 p.m.<br />
Spanish <strong>in</strong>terpreters <strong>and</strong> materials are available<br />
<strong>Substance</strong> <strong>Use</strong> <strong>and</strong> <strong>Abuse</strong> <strong>in</strong> <strong>Durham</strong> <strong>County</strong> 58
Youth <strong>and</strong> <strong>Substance</strong> <strong>Use</strong><br />
Prevalence of substance-related risk behaviors among middle <strong>and</strong> high school<br />
students<br />
Indicator:<br />
<br />
Prevalence of various substance-related risk behaviors <strong>in</strong> <strong>Durham</strong> <strong>County</strong> Middle <strong>and</strong> High<br />
School students from the Youth Risk Behavior Survey (YRBS).<br />
Relevance: The Monitor<strong>in</strong>g the Future (MTF) survey has been collect<strong>in</strong>g <strong>in</strong>formation on drug,<br />
alcohol, <strong>and</strong> cigarette use <strong>and</strong> related attitudes among adolescent students nationwide s<strong>in</strong>ce 1975.<br />
The 2011 survey results show that cigarette smok<strong>in</strong>g is at its lowest po<strong>in</strong>t <strong>in</strong> the history of the<br />
survey; there have also been drops <strong>in</strong> <strong>in</strong>halant use, use of ecstasy (MDMA), coca<strong>in</strong>e use, as well as<br />
b<strong>in</strong>ge dr<strong>in</strong>k<strong>in</strong>g <strong>and</strong> daily alcohol use. Despite these positive f<strong>in</strong>d<strong>in</strong>gs, there are some areas of<br />
concern. For <strong>in</strong>stance, youth are us<strong>in</strong>g other forms of smoked tobacco at rates higher than<br />
cigarettes, marijuana use has <strong>in</strong>creased, synthetic marijuana is a new concern, <strong>and</strong> use of drugs<br />
(i.e., Vicod<strong>in</strong>, OxyCont<strong>in</strong>) has <strong>in</strong>creased (53).<br />
There are a number of consequences to substance use <strong>and</strong> abuse <strong>in</strong> youth. These affect the youth<br />
themselves, families, <strong>and</strong> the communities <strong>in</strong> which they live. <strong>Substance</strong> abuse among youth can<br />
result <strong>in</strong> academic problems, health <strong>and</strong> mental health problems, <strong>and</strong> <strong>in</strong>volvement with the<br />
juvenile justice system to name a few (54).<br />
Data: Data come from the Youth Risk Behavior Survey (YRBS). The YRBS was developed by the<br />
Centers for Disease Control to monitor health-risk behaviors as well as various conditions such as<br />
obesity <strong>and</strong> asthma. This survey is conducted at the national, state, <strong>and</strong> local levels. S<strong>in</strong>ce 2007,<br />
<strong>Durham</strong> has conducted the YRBS with middle <strong>and</strong> high school students. 2009 <strong>and</strong> 2011 data were<br />
provided by the <strong>Durham</strong> <strong>County</strong> Public Health Department, <strong>in</strong>clud<strong>in</strong>g all statistical significance<br />
tests results (40, 41). Differences between 2011 <strong>and</strong> 2009 percentages were considered<br />
statistically significant at a 95% confidence <strong>in</strong>terval. Differences between 2007-2011 high school<br />
data were not analyzed because the 2007 sample <strong>in</strong>cluded mostly 9th grade students.<br />
F<strong>in</strong>d<strong>in</strong>gs: The YRBS is only a small sample of students throughout the county. From these data, it<br />
appears that alcohol <strong>and</strong> marijuana are the most common substances used <strong>in</strong> the YRBS sample.<br />
See Tables 13 <strong>and</strong> 14 for means for a variety of risk behaviors from YRBS data for <strong>Durham</strong> <strong>County</strong><br />
middle <strong>and</strong> high school students. In 2011, there were not any statistically significant changes from<br />
the 2009 to the 2011 YRBS <strong>in</strong> substance abuse <strong>in</strong>dicators <strong>in</strong> Middle School students. However, <strong>in</strong><br />
High School students, past 30 day use, dr<strong>in</strong>k<strong>in</strong>g alcohol on school property, <strong>and</strong> marijuana use on<br />
school property, ever us<strong>in</strong>g any form of coca<strong>in</strong>e, ever us<strong>in</strong>g <strong>in</strong>halants, ever us<strong>in</strong>g steroids, <strong>and</strong> ever<br />
us<strong>in</strong>g methamphetam<strong>in</strong>es, were statistically significantly higher <strong>in</strong> 2011 compared to 2009.
[Table 13]<br />
Prevalence of activities related to substance use among <strong>Durham</strong> middle school students <strong>in</strong> 2007,<br />
2009 <strong>and</strong> 2011<br />
Have you ever had a dr<strong>in</strong>k of alcohol, other<br />
than a few sips?<br />
Drank alcohol that someone gave you dur<strong>in</strong>g<br />
the past 30 days?<br />
2007<br />
(%<br />
yes)<br />
2009<br />
(%<br />
yes)<br />
2011<br />
(%<br />
yes)<br />
30.3 32.8 27.1<br />
6.2 7.2 5.2<br />
Have you ever used marijuana? 15.4 13.3 9.0<br />
Dur<strong>in</strong>g the past 30 days, did you use<br />
marijuana<br />
Dur<strong>in</strong>g the past 30 days, did you use<br />
marijuana on school property?<br />
Have you ever used any form of coca<strong>in</strong>e,<br />
<strong>in</strong>clud<strong>in</strong>g powder, crack, or freebase?<br />
Have you ever sniffed glue, breathed the<br />
contents of spray cans, or <strong>in</strong>haled any pa<strong>in</strong>ts<br />
or sprays to get high?<br />
Have you ever used steroid pills or shots<br />
without a doctor’s prescription?<br />
Have you ever taken a prescription drug<br />
such as OxyCont<strong>in</strong>, Percocet, Demerol,<br />
Adderall, Rital<strong>in</strong>, or Xanax without a doctor’s<br />
prescription?<br />
Dur<strong>in</strong>g the past 12 months, has anyone<br />
offered, sold, or given you an illegal drug on<br />
school property?<br />
Source: <strong>Durham</strong> Youth Risk Behavior Survey<br />
7.4 4.8 4.0<br />
3.3 2.9 1.7<br />
3.9 2.8 2.3<br />
16.3 12.2 8.2<br />
3.2 2.0 2.9<br />
3.9 3.3 5.3<br />
11.4 10.6 9.1<br />
Sig difference<br />
between<br />
2009 & 2011<br />
no significant<br />
difference<br />
no significant<br />
difference<br />
no significant<br />
difference<br />
no significant<br />
difference<br />
no significant<br />
difference<br />
no significant<br />
difference<br />
no significant<br />
difference<br />
no significant<br />
difference<br />
no significant<br />
difference<br />
no significant<br />
difference<br />
<strong>Substance</strong> <strong>Use</strong> <strong>and</strong> <strong>Abuse</strong> <strong>in</strong> <strong>Durham</strong> <strong>County</strong> 60
[Table 14]<br />
Prevalence of activities related to substance use among <strong>Durham</strong> high school students <strong>in</strong> 2007,<br />
2009 <strong>and</strong> 2011<br />
2007<br />
(% yes)<br />
2009<br />
(% yes)<br />
2011<br />
(% yes)<br />
Drank alcohol dur<strong>in</strong>g the past 30 days? a 28.8 42.5 36.0<br />
Dur<strong>in</strong>g the past 30 days did you ever have 5<br />
or more dr<strong>in</strong>ks of alcohol <strong>in</strong> a row, that is,<br />
with<strong>in</strong> a couple of hours? b<br />
Dur<strong>in</strong>g the past 30 days, did you have at<br />
least one dr<strong>in</strong>k of alcohol on school<br />
property? c<br />
11.2 21.0 20.6<br />
Sig difference<br />
between<br />
2009 & 2011<br />
no significant<br />
difference<br />
no significant<br />
difference<br />
8.0 6.1 14.0 <strong>in</strong>creased 7.9%<br />
Have you ever used marijuana? d 35.2 44.8 45.7<br />
no significant<br />
difference<br />
no significant<br />
difference<br />
Dur<strong>in</strong>g the past 30 days, did you use<br />
marijuana? e 23.6 29.4 31.5<br />
Dur<strong>in</strong>g the past 30 days, did you use<br />
marijuana on school property? f 9.5 6.5 13.6 <strong>in</strong>creased 7.1%<br />
Have you ever used any form of coca<strong>in</strong>e,<br />
<strong>in</strong>clud<strong>in</strong>g powder, crack or freebase?<br />
Have you ever sniffed glue, breathed the<br />
contents of spray cans, or <strong>in</strong>haled any<br />
pa<strong>in</strong>ts or sprays to get high?<br />
7.0 4.3 12.9 <strong>in</strong>creased 8.6%<br />
15.9 9.4 16.1 <strong>in</strong>creased 6.7%<br />
Have you ever used steroid pills or shots<br />
without a doctor’s prescription?<br />
6.3 3.1 9.6 <strong>in</strong>creased 6.5%<br />
Have you ever used Methamphetam<strong>in</strong>es? 4.7 3.5 12.4 <strong>in</strong>creased 8.9%<br />
Have you ever taken a prescription drug<br />
such as OxyCont<strong>in</strong>, Percocet, Demerol,<br />
Adderall, Rital<strong>in</strong>, or Xanax without a<br />
doctor’s prescription?<br />
Dur<strong>in</strong>g the past 12 months, has anyone<br />
offered, sold, or given you an illegal drug on<br />
12.7 17.1 21.7<br />
37.1 34.3 30.3<br />
no significant<br />
difference<br />
no significant<br />
difference<br />
school property?<br />
Source: <strong>Durham</strong> Youth Risk Behavior Survey<br />
a Dur<strong>in</strong>g the past 30 days, on how many days did you have at least 1 dr<strong>in</strong>k of alcohol?<br />
b Dur<strong>in</strong>g the past 30 days, on how many days did you have 5 or more dr<strong>in</strong>ks of alcohol <strong>in</strong> a row, that is, with<strong>in</strong> a<br />
couple of hours?<br />
c Dur<strong>in</strong>g the past 30 days, on how many days did you have at least one dr<strong>in</strong>k of alcohol on school property?<br />
d Dur<strong>in</strong>g your life, how many times have you used marijuana?<br />
e Dur<strong>in</strong>g the past 30 days, how many times did you use marijuana?<br />
f Dur<strong>in</strong>g the past 30 days, how many times did you use marijuana on school property?<br />
g Dur<strong>in</strong>g your life, how many times have you used methamphetam<strong>in</strong>es?<br />
<strong>Substance</strong> <strong>Use</strong> <strong>and</strong> <strong>Abuse</strong> <strong>in</strong> <strong>Durham</strong> <strong>County</strong> 61
Youth Perception of Risk of Illicit <strong>Substance</strong>s<br />
The perception of risk of us<strong>in</strong>g illicit substances plays a role <strong>in</strong> whether or not a youth engages <strong>in</strong><br />
substance use. Youth who perceive a low risk of harm are more likely to use illicit substances (55,<br />
56). S<strong>in</strong>ce 2002 <strong>in</strong> the nation, the perception of risk of harm from dr<strong>in</strong>k<strong>in</strong>g alcohol has <strong>in</strong>creased <strong>in</strong><br />
youth, while b<strong>in</strong>ge dr<strong>in</strong>k<strong>in</strong>g rates <strong>in</strong> youth decreased (57). While the perception of risk <strong>in</strong> alcohol<br />
has <strong>in</strong>creased, the perception of risk of marijuana decreased <strong>and</strong> rates of smok<strong>in</strong>g marijuana<br />
<strong>in</strong>creased. Youth <strong>in</strong> NC have similar perceptions of risk (58). The <strong>Substance</strong> <strong>Abuse</strong> <strong>and</strong> Mental<br />
Health Services Adm<strong>in</strong>istration (SAMHSA) sponsors The National Survey on Drug <strong>Use</strong> <strong>and</strong> Health<br />
(NSDUH). NSDUH asks adolescents aged 12 to 17 “how much people risk physical <strong>and</strong> other harm<br />
when they dr<strong>in</strong>k five or more alcoholic dr<strong>in</strong>ks once or twice a week, use marijuana once or twice a<br />
week, use coca<strong>in</strong>e once or twice a week, use LSD once or twice a week, <strong>and</strong> use hero<strong>in</strong> once or<br />
twice a week. Response choices are (1) no risk, (2) slight risk, (3) moderate risk, <strong>and</strong> (4) great<br />
risk” (57). Data are not available at the county level at this time. However, track<strong>in</strong>g perception of<br />
risk of substance use <strong>in</strong> <strong>Durham</strong> <strong>County</strong> youth could enhance surveillance of substance use <strong>in</strong><br />
youth. Additionally, agencies work<strong>in</strong>g on substance use prevention <strong>in</strong> the community can use the<br />
<strong>in</strong>formation to target prevention messages <strong>and</strong> anti-use campaigns.<br />
The Supply of Illicit Drugs<br />
While the ma<strong>in</strong> purpose of this report is to focus on substance use <strong>and</strong> abuse <strong>in</strong> <strong>Durham</strong> NC,<br />
underst<strong>and</strong><strong>in</strong>g the broader context of the state’s <strong>and</strong> surround<strong>in</strong>g areas’ supply of drugs improves<br />
our underst<strong>and</strong><strong>in</strong>g of potential trends <strong>in</strong> the <strong>Durham</strong> area. This section of the report primarily<br />
summarizes <strong>in</strong>formation <strong>in</strong> the 2010 Atlanta High Intensity Drug Traffick<strong>in</strong>g Area Drug (HIDTA)<br />
Market Analysis.<br />
The Atlanta HIDTA <strong>in</strong>cludes the Atlanta metropolitan area as well as 8 counties <strong>in</strong> the NC—<br />
Alamance, <strong>Durham</strong>, Guilford, Johnston, R<strong>and</strong>olph, Wake, Wayne <strong>and</strong> Wilson counties (59). The<br />
<strong>in</strong>terstate highways connect Atlanta to the U.S. southern border that is shared with Mexico. The<br />
Raleigh <strong>Durham</strong> area is well connected to Western routes to the west coast (route 40) <strong>and</strong> the<br />
north east cities <strong>in</strong>clud<strong>in</strong>g D.C., Baltimore, Philadelphia <strong>and</strong> Boston (routes 85 <strong>and</strong> 95).<br />
Drug Seizures <strong>in</strong> NC <strong>and</strong> the Atlanta HIDTA<br />
The U.S. Department of Justice National Drug Intelligence Center collects <strong>in</strong>formation on drugs<br />
seized throughout the Atlanta High Intensity Drug Traffick<strong>in</strong>g Area (see Table 15) (60). Data<br />
beyond the 2010 report are not available as the National Drug Intelligence Center (NDIC), who<br />
produced the reports, closed <strong>in</strong> June of 2012 (59). This <strong>in</strong>formation provides a sense of some<br />
drugs such as coca<strong>in</strong>e, methamphetam<strong>in</strong>e, hero<strong>in</strong> <strong>and</strong> marijuana that are pass<strong>in</strong>g through the<br />
communities. While very small amounts may have been seized <strong>in</strong> the Triangle dur<strong>in</strong>g these 6<br />
months, this does not mean that these drugs aren’t available <strong>in</strong> high quantities. Drug seizures<br />
reflect various law enforcement operations <strong>in</strong>clud<strong>in</strong>g rout<strong>in</strong>e traffic stops <strong>and</strong> searches as well as<br />
<strong>Substance</strong> <strong>Use</strong> <strong>and</strong> <strong>Abuse</strong> <strong>in</strong> <strong>Durham</strong> <strong>County</strong> 62
undercover operations. Undercover operations sometimes take weeks, months or even years of<br />
lay<strong>in</strong>g ground work before mak<strong>in</strong>g a big seizure.<br />
[Table 15]<br />
Atlanta High Intensity Drug Traffick<strong>in</strong>g Area (HIDTA) drug seizures <strong>in</strong> 2009<br />
NC Triangle<br />
Total for the Atlanta<br />
HIDTA (kgs)<br />
Powder Coca<strong>in</strong>e 94.3 1755.9<br />
Crack Coca<strong>in</strong>e 0 0.7<br />
Ice Methamphetam<strong>in</strong>e 3.1 351.0<br />
Powder Methamphetam<strong>in</strong>e 0 12.4<br />
Marijuana 837.5 9,166<br />
Hydroponic* 0.1 1,703<br />
Hero<strong>in</strong> 1.3 9.8<br />
GHB (gamma hydroxybutyrate) 10,174 10,329<br />
MDMA (<strong>in</strong> dosage units) 79 77,052<br />
Source: Atlanta High Intensity Drug Traffick<strong>in</strong>g Area.<br />
Note: Total <strong>in</strong>clude drug seizures several <strong>in</strong>itiatives <strong>in</strong>clud<strong>in</strong>g a) Dekalb, GA, b) Metro, c) Exp<strong>and</strong>ed<br />
Operations, d) NC Triangle <strong>and</strong> e) Domestic Highway Drug Enforcement.<br />
*Hydroponics are materials for grow<strong>in</strong>g plants <strong>in</strong> nutrient rich solutions rather than soil.<br />
Another data collection effort on drug seizures is the national seizure system that collects<br />
<strong>in</strong>formation on methamphetam<strong>in</strong>e laboratory seizures (see Table 16). In general,<br />
methamphetam<strong>in</strong>e production <strong>in</strong> the Atlanta HIDTA is considered to be low to moderate. The<br />
decrease <strong>in</strong> methamphetam<strong>in</strong>e lab seizures from 2005 to 2006 is likely to be a consequence of<br />
measures that restricted the accessibility of over the counter medications such as Sudafed®, that<br />
conta<strong>in</strong> <strong>in</strong>gredients for methamphetam<strong>in</strong>e production like pseudoephedr<strong>in</strong>e. The Department of<br />
Justice notes that the majority of laboratories seized <strong>in</strong> the Atlanta HIDTA region were <strong>in</strong> NC.<br />
[Table 16]<br />
Methamphetam<strong>in</strong>e laboratory seizures <strong>in</strong> NC <strong>and</strong> the Atlanta HIDTA, 2004-2009<br />
Area 2004 2005 2006 2007 2008 2009<br />
NC counties <strong>in</strong> the Atlanta HIDTA (Alamance,<br />
<strong>Durham</strong>, Guilford, Johnston, R<strong>and</strong>olph, Wake,<br />
5 9 7 8 8 19<br />
Wayne, Wilson)<br />
NC (all counties) 241 174 88 70 89 91<br />
Atlanta HIDTA (all counties) 34 38 21 11 12 26<br />
Source: Atlanta High Intensity Drug Traffick<strong>in</strong>g Area<br />
Accord<strong>in</strong>g to the National Drug Intelligence Center, most of the marijuana available <strong>in</strong> the Atlanta<br />
HIDTA is grown <strong>in</strong> either Mexico or Canada. However, some is locally grown. The severe drought<br />
<strong>in</strong> 2007 damaged much of the marijuana plants. Fluctuations <strong>in</strong> the number of plants eradicated<br />
reflect both resources for eradication as well as the number of plants. Therefore, it is important to<br />
<strong>Substance</strong> <strong>Use</strong> <strong>and</strong> <strong>Abuse</strong> <strong>in</strong> <strong>Durham</strong> <strong>County</strong> 63
note that changes <strong>in</strong> the number of plants may not reflect changes <strong>in</strong> the supply of the drug (see<br />
Table 17).<br />
[Table 17]<br />
Cannabis Plants Eradicated at Outdoor <strong>and</strong> Indoor Grow Sites <strong>in</strong> Georgia <strong>and</strong> NC, 2004-2009<br />
Outdoor<br />
2004 2005 2006 2007 2008 2009<br />
GA 18,122 27,067 64,995 11,851 47,607 43,880<br />
NC 32,572 68,491 99,379 15,115 103,711 64,555<br />
Total 50,694 95,558 164,374 26,966 151,318 108,435<br />
Indoor<br />
GA 616 642 1,610 9,585 2,840 5,836<br />
NC 3,393 2,391 2,110 1,253 1,489 2,739<br />
Total 4,009 3,033 3,720 10,838 4,329 8,575<br />
Source: Domestic Cannabis Eradication/Suppression Program<br />
Price of Drugs <strong>in</strong> <strong>Durham</strong> <strong>County</strong><br />
Indicator:<br />
<br />
The price for a specific quantity of a given drug<br />
Relevance: The price of illegal drugs is the result of supply <strong>and</strong> dem<strong>and</strong>. Ris<strong>in</strong>g prices result from<br />
a decrease <strong>in</strong> supply which is usually caused by more effective drug enforcement efforts. Increases<br />
<strong>in</strong> price may <strong>in</strong>crease street crime (ex. addicts may need more money to meet their needs), or<br />
medical needs (ex. price affects drug quality, which <strong>in</strong> turn affects the medical problems that are<br />
be<strong>in</strong>g seen). Decreas<strong>in</strong>g prices can lead to more users, users purchas<strong>in</strong>g larger doses, <strong>and</strong><br />
<strong>in</strong>creased drug purity, which will also affect prevention, treatment, <strong>and</strong> medical resources. One of<br />
the benefits of the surveillance system is that, by shar<strong>in</strong>g <strong>in</strong>formation, the community will be <strong>in</strong> a<br />
better position to respond to such changes.<br />
Data: Data were provided via personal communication with the <strong>Durham</strong> <strong>County</strong> Sheriff’s Office <strong>in</strong><br />
March of 2013.<br />
F<strong>in</strong>d<strong>in</strong>gs: The price of hero<strong>in</strong> appears to have dropped from $20 for a dose <strong>in</strong> 2006 to $10-$15 for<br />
a dose <strong>in</strong> 2010, <strong>and</strong> did not change <strong>in</strong> 2013. The price of coca<strong>in</strong>e has doubled s<strong>in</strong>ce 2006, from<br />
approximately $35 per gram to $70 per gram. However, the price of crack coca<strong>in</strong>e appears to have<br />
rema<strong>in</strong>ed relatively constant over this time period. The price of high grade marijuana has slightly<br />
<strong>in</strong>creased from $350 to $450 an ounce <strong>in</strong> 2010 to $500 an ounce <strong>in</strong> 2013. On a per dose basis, low<br />
grade marijuana is relatively cheap at $3 a dose relative to other drugs such as ecstasy ($7-$10 per<br />
dose), <strong>and</strong> hero<strong>in</strong> ($10-15 per dose). See Table 18 for a list<strong>in</strong>g of prices <strong>and</strong> <strong>in</strong>formation about<br />
various drugs.<br />
<strong>Substance</strong> <strong>Use</strong> <strong>and</strong> <strong>Abuse</strong> <strong>in</strong> <strong>Durham</strong> <strong>County</strong> 64
[Table 18]<br />
Drug prices <strong>in</strong> <strong>Durham</strong> 2006, 2010, <strong>and</strong> 2013<br />
Drug 2006 Notes 2006 2010 2013<br />
It is sold on the street after be<strong>in</strong>g cut<br />
<strong>and</strong> packaged <strong>in</strong> b<strong>in</strong>dles. B<strong>in</strong>dles vary<br />
<strong>in</strong> purity from 0.1 gram hero<strong>in</strong> to as<br />
Hero<strong>in</strong><br />
little as .04 grams <strong>and</strong> can be cut with<br />
1 b<strong>in</strong>dle $10 -<br />
1 b<strong>in</strong>dle $20<br />
a variety of substances, <strong>in</strong>clud<strong>in</strong>g<br />
1 b<strong>in</strong>dle $10 - $15 $15<br />
10 b<strong>in</strong>dles<br />
lidoca<strong>in</strong>e, caffe<strong>in</strong>e, lactose,<br />
1 ounce $2,800 1 ounce<br />
$150<br />
acetam<strong>in</strong>ophen, or others.<br />
$2,800<br />
One b<strong>in</strong>dle is approximately 1 dosage<br />
unit.<br />
Ten b<strong>in</strong>dles are a bundle.<br />
Coca<strong>in</strong>e<br />
Crack<br />
On the streets of <strong>Durham</strong>, coca<strong>in</strong>e is<br />
usually cut with a variety of possible<br />
substances <strong>and</strong> then sold. The actual<br />
amount that the buyer receives is<br />
often less than advertised.<br />
3.5 grams=an eightball<br />
4.5ounces=a “biggie” eight<br />
1 kilogram of coca<strong>in</strong>e can be<br />
purchased for between $18,000 <strong>and</strong><br />
$20,000. When this same amount of<br />
coca<strong>in</strong>e is cooked <strong>in</strong>to crack, it can<br />
generate as much as $100,000 on the<br />
street.<br />
1 gram of coca<strong>in</strong>e produces 5 dosage<br />
units of crack<br />
1 dosage unit=a rock<br />
1 ounce<br />
$1,000<br />
3.5 grams<br />
$125<br />
4.5 ounces<br />
$4,000‐<br />
$4,500.<br />
1 rock $20<br />
1 gram $50<br />
1 ounce $1,000 –<br />
$1,400<br />
1 rock $20 (.3 of<br />
gram)<br />
1 ounce $1,000 –<br />
$1,400<br />
1 gram $70<br />
1 rock $20 (.3<br />
of gram)<br />
1 ounce<br />
$1,000 –<br />
$1,400<br />
MDMA (Ecstasy) 1 pill $7-$10 1 pill $7-$10<br />
1 gram $50<br />
1 gram $50<br />
Methamphetam<strong>in</strong>e<br />
1 ounce<br />
1 ounce $1,400.00<br />
$1,400.00<br />
Marijuana-<br />
Low Grade<br />
Marijuana-<br />
High Grade<br />
Oxycodone, Percocet,<br />
Endocet, Oxycont<strong>in</strong>,<br />
Vicod<strong>in</strong><br />
Hydrocodone<br />
Source: <strong>Durham</strong> <strong>County</strong> Sheriff’s Office<br />
1 gram $3-$7<br />
1 ounce $180 -<br />
$200<br />
1 gram $15 -$20<br />
1 ounce $350 -<br />
$450<br />
$1 for every<br />
milligram<br />
10mg=$10<br />
20mg=$20<br />
$1 for every<br />
milligram<br />
1 gram $3-$7<br />
1 ounce $180<br />
- $200<br />
1 ounce $500<br />
$1 for every<br />
milligram<br />
10mg=$10<br />
20mg=$20<br />
$1 for every<br />
milligram<br />
<strong>Substance</strong> <strong>Use</strong> <strong>and</strong> <strong>Abuse</strong> <strong>in</strong> <strong>Durham</strong> <strong>County</strong> 65
Alcohol Beverage Control Board of Spirituous Liquor to the General Public<br />
Indicators:<br />
<br />
<br />
<br />
ABC gross sales: Sales by the local Alcoholic Beverage Control board of spirituous liquor<br />
to the general public; spirituous liquor to mixed beverage permits, such as restaurants <strong>and</strong><br />
clubs (where applicable); <strong>and</strong> w<strong>in</strong>e (except that there were no reported w<strong>in</strong>e sales <strong>in</strong> 1980-<br />
1983 <strong>and</strong> 1985).<br />
ABC State Excise Tax: Excise tax collections remitted to the Department of Revenue for<br />
the general fund, based on collections made dur<strong>in</strong>g the fiscal year<br />
ABC Local Government Distributions: The portion of net profits from ABC stores which<br />
is distributed to the general fund of the county or municipal government, as determ<strong>in</strong>ed by<br />
the local ABC board. The difference between this amount <strong>and</strong> net profits (the difference can<br />
be a positive or negative amount) constitutes reta<strong>in</strong>ed earn<strong>in</strong>gs for the local ABC board.<br />
ABC Rehabilitation Contribution: Bottle charges of one cent on each bottle conta<strong>in</strong><strong>in</strong>g 50<br />
milliliters or less <strong>and</strong> five cents on each bottle conta<strong>in</strong><strong>in</strong>g more than 50 milliliters, remitted<br />
to county commissioners for treatment of alcoholism <strong>and</strong> substance abuse, or for research<br />
or education on alcohol <strong>and</strong> substance abuse. (Does not <strong>in</strong>clude collections of the additional<br />
five cents per bottle tax imposed August 1, 1983. Those proceeds are credited to the<br />
general fund of the local government <strong>and</strong> are <strong>in</strong>cluded local government distributions.)<br />
<br />
<br />
ABC Reserve for Law Enforcement: Amount remitted by the local ABC board for law<br />
enforcement, which must be at least five percent of receipts. These funds can be used to<br />
employ an ABC officer or contract with local law enforcement officials.<br />
ABC Alcohol Education <strong>and</strong> Research Contribution: Amount remitted by the local ABC<br />
board directly or to the county commissioners for treatment of alcoholism or substance<br />
abuse, or for research or education on alcohol or substance abuse.<br />
Relevance: In NC local communities determ<strong>in</strong>e whether or not spirituous liquor can be sold <strong>in</strong> the<br />
county (<strong>and</strong> if not the county, then the township or city). If spirituous liquor can be sold <strong>in</strong> the<br />
community then a local Alcohol Beverage Control (ABC) board is established. Each ABC Board has<br />
a chairperson <strong>and</strong> two to six board members who are appo<strong>in</strong>ted by their govern<strong>in</strong>g authority. The<br />
Board has authority to set policy <strong>and</strong> adopt rules that conform to the rules laid out by the ABC<br />
Laws <strong>and</strong> Commission Rules. To enforce laws,<br />
Local ABC Boards can either employ local ABC law enforcement officers or make other provisions<br />
to enforce ABC laws. The <strong>Durham</strong> <strong>County</strong> ABC is overseen by the <strong>Durham</strong> <strong>County</strong> ABC Board, a<br />
five-member board appo<strong>in</strong>ted by the <strong>County</strong> Commissioners. The ABC Board members are the<br />
policy makers for ABC stores <strong>and</strong> ABC Law Enforcement (61). No state funds are used to establish<br />
or operate local ABC boards <strong>in</strong> NC. Revenue generated through the sales of spirituous liquor is<br />
contributed to the state, county <strong>and</strong> city.<br />
<strong>Substance</strong> <strong>Use</strong> <strong>and</strong> <strong>Abuse</strong> <strong>in</strong> <strong>Durham</strong> <strong>County</strong> 66
Millions (<strong>in</strong> 2012 constant Dollars)<br />
Data: The Web site “Log <strong>in</strong>to NC” compiles data from a variety of sources by county <strong>and</strong> year (62).<br />
Information on ABC sales <strong>and</strong> revenue come from the Department of Commerce.<br />
F<strong>in</strong>d<strong>in</strong>gs: Figure 40 presents <strong>in</strong>formation on gross sales of spirituous dr<strong>in</strong>ks. All dollars are<br />
presented <strong>in</strong> 2012 dollars to take <strong>in</strong>to account <strong>in</strong>flation.<br />
In 2012, there were approximately $20.0 million <strong>in</strong> gross sales of spirituous liquor (see Figure 40)<br />
<strong>in</strong> <strong>Durham</strong> <strong>County</strong>. Almost six percent of these dollars go to <strong>Durham</strong> <strong>County</strong> <strong>and</strong> City for a total of<br />
$1.13 million.<br />
$24.0<br />
$23.0<br />
$22.0<br />
$21.0<br />
$20.0<br />
$19.0<br />
$18.0<br />
$17.0<br />
$16.0<br />
$15.0<br />
$14.0<br />
22.5<br />
21.8 21.9<br />
21.6 21.3<br />
21.8<br />
23.0 23.0<br />
21.8<br />
21.0<br />
19.9<br />
19.6 19.2<br />
18.3<br />
17.8 17.5<br />
17.7<br />
20.1<br />
16.8<br />
15.9 16.3<br />
15.8 15.9<br />
20.5 20.6<br />
19.7<br />
17.3 17.8<br />
16.8<br />
20.0<br />
19.7<br />
19.5 19.5<br />
Source: Log Into North Carol<strong>in</strong>a<br />
[Figure 40]<br />
Sales by the local Alcoholic Beverage Control board of spirituous liquor to the general public<br />
Figures 41 <strong>and</strong> 42 look more closely at the distribution of revenue from ABC sales locally.<br />
Currently, about six percent of gross sales are given to local government. This is up from about 2<br />
to 4% <strong>in</strong> the late 1990’s to early 2000’s, but down from about 8 to 9% <strong>in</strong> the early 1980’s.<br />
ABC law enforcement activities <strong>in</strong>clude <strong>in</strong>spect<strong>in</strong>g ABC outlets such as restaurants <strong>and</strong> night clubs<br />
<strong>and</strong> enforc<strong>in</strong>g the state’s alcohol, tobacco, b<strong>in</strong>go <strong>and</strong> gambl<strong>in</strong>g laws. Alcohol law enforcemnt would<br />
make arrests for th<strong>in</strong>gs such as fictious IDs, driv<strong>in</strong>g while under the <strong>in</strong>fluence of a substance, <strong>and</strong><br />
alcohol <strong>and</strong> controlled substance violations to name a few.<br />
The amount of money <strong>and</strong> the percent of gross sales available for rehabilitation from the ABC<br />
funds had been steadily decl<strong>in</strong><strong>in</strong>g. In 1980 there were approximately $192,000 available for<br />
rehabilitation (<strong>in</strong> 2012 dollars) compared to approximately $81,000 <strong>in</strong> 2012. This represents a<br />
drop from about 0.9% of gross sales <strong>in</strong> 1980 to about 0.4% <strong>in</strong> 2012.<br />
<strong>Substance</strong> <strong>Use</strong> <strong>and</strong> <strong>Abuse</strong> <strong>in</strong> <strong>Durham</strong> <strong>County</strong> 67
% of Gross Sales<br />
2012 Constant Dollars<br />
$450,000<br />
$400,000<br />
Law Enforcement,<br />
$391,941, 2012<br />
$350,000<br />
$300,000<br />
$250,000<br />
$200,000<br />
$150,000<br />
$100,000<br />
Rehabilitation Contribution,<br />
$82,721, 2012<br />
$50,000<br />
Alcohol Education & Research<br />
Contribution, $84,626, 2012<br />
$0<br />
1980 1984 1988 1992 1996 2000 2004 2008 2012<br />
Source: Log Into North Carol<strong>in</strong>a<br />
[Figure 41]<br />
<strong>County</strong> Dollars ga<strong>in</strong>ed from ABC profits by allocation<br />
10%<br />
9%<br />
8%<br />
7%<br />
Local Government<br />
Distribution, 5.6%<br />
6%<br />
5%<br />
4%<br />
3%<br />
2%<br />
Law Enforcement, 2.0%<br />
1%<br />
[Figure 42]<br />
Percent of Gross Sales given to specific county activities<br />
Alcohol Education & Research<br />
Contribution, 0.4%<br />
0%<br />
Rehabilitation Contribution, 0.4%<br />
1980 1984 1988 1992 1996 2000 2004 2008 2012<br />
Source: Log Into North Carol<strong>in</strong>a<br />
<strong>Substance</strong> <strong>Use</strong> <strong>and</strong> <strong>Abuse</strong> <strong>in</strong> <strong>Durham</strong> <strong>County</strong> 68
Good Neighbor Initiative<br />
<strong>Durham</strong> Together for Resilient Youth (<strong>Durham</strong> TRY) is a non-profit organization that formed <strong>in</strong><br />
2003 <strong>and</strong> held its first meet<strong>in</strong>g <strong>in</strong> 2005 (63). <strong>Durham</strong> TRY works to prevent substance abuse<br />
among youth <strong>and</strong> adults <strong>in</strong> <strong>Durham</strong> <strong>County</strong> by reduc<strong>in</strong>g community risk factors through advocacy,<br />
education, policy change, mobilization <strong>and</strong> action. <strong>Durham</strong> TRY collaborates with many <strong>in</strong>fluential<br />
key stakeholders <strong>in</strong> the community; such as youth, parents, community organizations, faith<br />
organizations, schools, health care providers, bus<strong>in</strong>esses, law enforcement, local government,<br />
academic <strong>in</strong>stitutions for research, substance abuse agencies, the media, youth serv<strong>in</strong>g<br />
organizations, <strong>and</strong> volunteer organizations. <strong>Durham</strong> TRY facilitates <strong>and</strong> coord<strong>in</strong>ates a number of<br />
<strong>in</strong>itiatives for youth <strong>and</strong> adults <strong>in</strong> the community. For more <strong>in</strong>formation, visit<br />
http://www.durhamtry.org/.<br />
In 2012 <strong>Durham</strong> TRY <strong>in</strong>itiated the Good Neighbor Campaign. Good Neighbor Campaign seeks<br />
alcohol seller accountability <strong>in</strong> the community to prevent sell<strong>in</strong>g of alcohol products to underage<br />
youth. The first phase <strong>in</strong>volves work<strong>in</strong>g with convenience stores, the second phase will <strong>in</strong>clude<br />
work<strong>in</strong>g with grocery stores <strong>and</strong> restaurant, the third phase will be work<strong>in</strong>g with bars, <strong>and</strong> the<br />
fourth phase will be work<strong>in</strong>g with event centers to limit dr<strong>in</strong>k<strong>in</strong>g cup size.<br />
Dur<strong>in</strong>g phase one, which is currently underway, <strong>Durham</strong> TRY partners with local convenience<br />
stores. The convenience stores complete the Good Neighbor Checklist. This is a non-legally b<strong>in</strong>d<strong>in</strong>g<br />
pledge that the store owner will comply with laws aga<strong>in</strong>st sell<strong>in</strong>g alcohol or lottery tickets to those<br />
under 21, or tobacco to anyone under 18, help<strong>in</strong>g to provide a safe environment for the<br />
community. The pledge <strong>in</strong>cludes tra<strong>in</strong><strong>in</strong>g employees <strong>in</strong> alcohol-sales laws, ensur<strong>in</strong>g that<br />
customers’ ages are checked, <strong>and</strong> reduc<strong>in</strong>g <strong>in</strong>-store advertis<strong>in</strong>g for alcohol products, <strong>and</strong> that no<br />
more than 10 percent of w<strong>in</strong>dows are covered with signage advertis<strong>in</strong>g alcohol products. <strong>Durham</strong><br />
TRY will publish a list of “Good Neighbor Stores” to community members on a monthly basis<br />
(website) <strong>and</strong> semi-annually (news ad). Currently there are 89 Convenience Stores, Gas Stations,<br />
Grocery stores that have completed <strong>and</strong> signed the pledge, out of approximately 200 <strong>in</strong> <strong>Durham</strong><br />
<strong>County</strong>. An additional 35 Restaurants <strong>and</strong> Bars have signed the pledge.<br />
The Good Neighbor Campaign also works for policy change <strong>in</strong> the community. For example,<br />
promot<strong>in</strong>g a city policy to reduce alcohol outlet density (number of alcohol outlets <strong>in</strong> a given area)<br />
<strong>and</strong> support<strong>in</strong>g <strong>in</strong>creas<strong>in</strong>g current $50 citation <strong>and</strong> f<strong>in</strong>e for loiters. In fact, because of the Good<br />
Neighbor Campaign <strong>and</strong> TRY, the <strong>Durham</strong> City Council has been review<strong>in</strong>g its policies for<br />
approvals for permits to sell beer <strong>and</strong> w<strong>in</strong>e <strong>and</strong> how to legally reduce alcohol density.<br />
The Good Neighbor Campaign is also work<strong>in</strong>g with the NC Alcohol Beverage Commission, the<br />
organization <strong>in</strong> charge of issu<strong>in</strong>g permits to sell alcohol products. NC ABC Attorney Mike Herr<strong>in</strong>g<br />
has issued a statement that (when there is a problem location <strong>in</strong> <strong>Durham</strong>) he “will grant a<br />
<strong>Substance</strong> <strong>Use</strong> <strong>and</strong> <strong>Abuse</strong> <strong>in</strong> <strong>Durham</strong> <strong>County</strong> 69
temporary permit to [this] new applicant only if they sign the Good Neighbor Checklist. If they do<br />
not sign the Good Neighbor Checklist their permit will be pulled immediately(64).”<br />
Treatment Services <strong>in</strong> <strong>Durham</strong> <strong>County</strong><br />
In 2012 <strong>Durham</strong> <strong>County</strong> transitioned from hav<strong>in</strong>g a Local Management Entity (LME) for manag<strong>in</strong>g<br />
behavioral health treatment (The <strong>Durham</strong> Center) to a Managed Care Organization (MCO),<br />
Alliance Behavioral Healthcare. Alliance Behavioral Healthcare manages the public mental health,<br />
<strong>in</strong>tellectual/ developmental disability <strong>and</strong> substance abuse services for the 65,000 citizens of<br />
<strong>Durham</strong>, Wake, Cumberl<strong>and</strong> <strong>and</strong> Johnston counties (65). The Alliance does not provide services,<br />
but refers <strong>in</strong>dividuals to services <strong>and</strong> supports delivered by a network of private providers who<br />
contract with Alliance. Alliance connects <strong>in</strong>dividuals to an array of services is available for<br />
adolescents <strong>and</strong> adults <strong>in</strong> <strong>Durham</strong> <strong>County</strong> (<strong>in</strong>formation is available on Alliance Behavioral<br />
Healthcare’s website at http://www.alliancebhc.org/).<br />
Adolescents Receiv<strong>in</strong>g Treatment Services<br />
Indicators:<br />
<br />
<br />
Number <strong>and</strong> percent of youth receiv<strong>in</strong>g outpatient <strong>and</strong> residential services through the<br />
public mental health system relative to need for treatment<br />
Drug mentions of <strong>Durham</strong> adolescents (aged 12-17 years) who are treated for substance<br />
abuse or mental health issues.<br />
Relevance: <strong>Substance</strong> use providers have unique <strong>in</strong>sight <strong>in</strong>to the substances that youth are us<strong>in</strong>g<br />
locally. Better plann<strong>in</strong>g for prevention <strong>and</strong> access to services can occur by know<strong>in</strong>g how many<br />
youth need of treatment <strong>and</strong> by know<strong>in</strong>g local trends <strong>in</strong> use patterns.<br />
Data: : Data for this report come NC-TOPPS (NC Treatment Outcomes <strong>and</strong> Program Performance<br />
System) regard<strong>in</strong>g patients receiv<strong>in</strong>g treatment from July 1, 2010 through June 30, 2011, fiscal<br />
year 2011 (FY11). Treatment agencies serv<strong>in</strong>g youth <strong>in</strong> more <strong>in</strong>tensive <strong>and</strong> comprehensive<br />
services are required to submit outcome data at the start of the services (“<strong>in</strong>itial” data) <strong>and</strong> after 3,<br />
6, <strong>and</strong> every 6 months thereafter (“update” data) <strong>in</strong>to an onl<strong>in</strong>e database called NC-TOPPS:<br />
1. Adolescents <strong>in</strong> substance abuse treatment (aged 12-17), <strong>in</strong>itial <strong>in</strong>terviews (n=78), <strong>and</strong><br />
2. Adolescents <strong>in</strong> mental health treatment (aged 12-17), <strong>in</strong>itial <strong>in</strong>terviews (n=494).<br />
F<strong>in</strong>d<strong>in</strong>gs: An estimated 1,208 adolescents <strong>in</strong> <strong>Durham</strong> <strong>County</strong> need substance abuse treatment.<br />
Treatment providers <strong>in</strong> <strong>Durham</strong>’s LME network served 147 adolescents (12% <strong>in</strong> need) <strong>in</strong> FY11(1).<br />
Data of youth pay<strong>in</strong>g out of pocket or us<strong>in</strong>g private <strong>in</strong>surance for services are unknown.<br />
<strong>Substance</strong> <strong>Use</strong> <strong>and</strong> <strong>Abuse</strong> <strong>in</strong> <strong>Durham</strong> <strong>County</strong> 70
See Table 19 for demographics of youth <strong>in</strong> treatment, submitted <strong>in</strong> NCTOPPS database. It is<br />
<strong>in</strong>terest<strong>in</strong>g to note that African-American males comprise the majority of clients that were served<br />
<strong>in</strong> organizations that reported data.<br />
[Table 19]<br />
NC-TOPPS Gender <strong>and</strong> Race/Ethnicity of adolescents <strong>in</strong> substance abuse <strong>and</strong> mental health<br />
treatment <strong>in</strong> <strong>Durham</strong> <strong>County</strong>, FY11<br />
<strong>Substance</strong> use tx<br />
Mental health tx<br />
Total percent 86% 56%<br />
Males<br />
African-American 55% 41%<br />
White 15% 7%<br />
Other 15% 7%<br />
Total percent 14% 44%<br />
Females<br />
African-American 9% 32%<br />
White 1% 5%<br />
Other 4% 7%<br />
Male & Female Hispanic Orig<strong>in</strong> 19% 12%<br />
Source: NC-TOPPS Initial Interviews: Adolescent (12-17) <strong>Substance</strong> <strong>Abuse</strong> Consumers, n=78 <strong>and</strong><br />
Mental Health Consumers, n=494, <strong>Durham</strong> LMEs. Note: Hispanic Orig<strong>in</strong> could be more than one race<br />
Adolescents <strong>and</strong> illicit substances<br />
Among adolescents receiv<strong>in</strong>g mental health services <strong>in</strong> <strong>Durham</strong>, 23% reported us<strong>in</strong>g illicit<br />
substances other than tobacco or alcohol (27% reported us<strong>in</strong>g tobacco or alcohol) (this was<br />
comparable to similar youth <strong>in</strong> the rest of the state at 24 <strong>and</strong> 28% respectively). When asked to<br />
report the types of illicit drugs used <strong>in</strong> the past 12 months, the most commonly cited was<br />
marijuana (27%). Fourteen percent of adolescents <strong>in</strong> mental health treatment were receiv<strong>in</strong>g<br />
services for both mental health <strong>and</strong> substance abuse. Of adolescents <strong>in</strong> substance abuse treatment,<br />
13% were receiv<strong>in</strong>g substance abuse services only <strong>and</strong> 87% were receiv<strong>in</strong>g substance abuse <strong>and</strong><br />
mental health services (see Figure 43 for a description of substances used <strong>in</strong> the past 12 months).<br />
Among adolescents receiv<strong>in</strong>g treatment for substance abuse <strong>in</strong> <strong>Durham</strong>, clients reported us<strong>in</strong>g the<br />
follow<strong>in</strong>g <strong>in</strong> the past 12 months:<br />
Marijuana 78%<br />
Coca<strong>in</strong>e 8%<br />
Benzodiazep<strong>in</strong>e 9%<br />
OxyCont<strong>in</strong> 8%<br />
<strong>Substance</strong> <strong>Use</strong> <strong>and</strong> <strong>Abuse</strong> <strong>in</strong> <strong>Durham</strong> <strong>County</strong> 71
Mental Health Adolecents<br />
<strong>Substance</strong> <strong>Abuse</strong> Adolescents<br />
Marijuana<br />
27<br />
78<br />
Tobacco<br />
19<br />
50<br />
Alcohol<br />
19<br />
56<br />
Heavy Alcohol<br />
6<br />
26<br />
0% 10% 20% 30% 40% 50% 60% 70% 80% 90%<br />
Source: NC-TOPPS Initial Interviews: Adolescent (12-17) <strong>Substance</strong> <strong>Abuse</strong> Consumers, n=78 <strong>and</strong><br />
Mental Health Consumers, n=494, <strong>Durham</strong> LMEs<br />
[Figure 43]<br />
NC-TOPPS self-reported drug use <strong>in</strong> the past 12 months by adolescents <strong>in</strong> substance abuse <strong>and</strong><br />
mental health treatment <strong>in</strong> <strong>Durham</strong> <strong>County</strong>, FY11<br />
Adults Receiv<strong>in</strong>g Treatment Services<br />
Indicators:<br />
<br />
<br />
<br />
Number <strong>and</strong> percent of adults receiv<strong>in</strong>g outpatient <strong>and</strong> residential services through the<br />
public mental health system relative to need for treatment<br />
Number of adult admissions for substance-related crises<br />
Drug mentions of <strong>Durham</strong> adults who are treated for substance abuse.<br />
Relevance: Data from the NC Treatment Outcomes <strong>and</strong> Program Performance System (NC-<br />
TOPPS) provide <strong>in</strong>formation on <strong>in</strong>dividuals <strong>in</strong> public mental health treatment for substance abuse.<br />
In particular, this is a good source of <strong>in</strong>formation on the types of drugs that <strong>in</strong>dividuals <strong>in</strong> <strong>Durham</strong><br />
are exposed to <strong>and</strong> their treatment needs.<br />
Data: Data for this report came from NC-TOPPS (NC Treatment Outcomes <strong>and</strong> Program<br />
Performance System) regard<strong>in</strong>g patients receiv<strong>in</strong>g treatment from July 1, 2010 through June 30,<br />
2011, fiscal year 2011 (FY11) (66-69).<br />
Treatment agencies serv<strong>in</strong>g adults <strong>in</strong> more <strong>in</strong>tensive <strong>and</strong> comprehensive services are required to<br />
submit outcome data at the start of the services (“<strong>in</strong>itial” data) <strong>and</strong> after every three <strong>and</strong> six<br />
months thereafter (“update” data) <strong>in</strong>to an onl<strong>in</strong>e database called NC-TOPPS. Two NC-TOPPS<br />
reports were exam<strong>in</strong>ed:<br />
<strong>Substance</strong> <strong>Use</strong> <strong>and</strong> <strong>Abuse</strong> <strong>in</strong> <strong>Durham</strong> <strong>County</strong> 72
1. Adults <strong>in</strong> substance abuse treatment, <strong>in</strong>itial <strong>in</strong>terviews (n=609), <strong>and</strong><br />
2. Adults <strong>in</strong> mental health treatment, <strong>in</strong>itial <strong>in</strong>terviews (n=1,122).<br />
F<strong>in</strong>d<strong>in</strong>gs: An estimated 17,910 adults <strong>in</strong> <strong>Durham</strong> <strong>County</strong> need substance abuse treatment.<br />
Treatment providers <strong>in</strong> <strong>Durham</strong>’s LME network served 2,276 adults (13% <strong>in</strong> need) <strong>in</strong> FY11 (1).<br />
Data on adults pay<strong>in</strong>g out of pocket or us<strong>in</strong>g private <strong>in</strong>surance for services are unknown.<br />
See Table 20 for age, gender, <strong>and</strong> race description of <strong>in</strong>itial <strong>in</strong>terviews from NC-TOPPS data. The<br />
percent of adults report<strong>in</strong>g that they are of Hispanic orig<strong>in</strong> is smaller than that seen <strong>in</strong> adolescents<br />
receiv<strong>in</strong>g treatment. Figure 44 <strong>in</strong>dicates the types of substances be<strong>in</strong>g used <strong>in</strong> the past 12 months<br />
by those receiv<strong>in</strong>g treatment.<br />
[Table 20]<br />
NC-TOPPS Gender <strong>and</strong> Race/Ethnicity of adults <strong>in</strong> substance abuse <strong>and</strong> mental health treatment <strong>in</strong><br />
<strong>Durham</strong> <strong>County</strong>, FY11<br />
<strong>Substance</strong> use tx Mental health tx<br />
Total percent 49% 36%<br />
Males<br />
African-American 31% 26%<br />
White 15% 8%<br />
Other 3% 2%<br />
Total percent 51% 64%<br />
Females<br />
African-American 34% 49%<br />
White 16% 13%<br />
Other 1% 2%<br />
Male & Female Hispanic Orig<strong>in</strong> 4% 3%<br />
Source: NC-TOPPS Initial Interviews: <strong>Substance</strong> <strong>Abuse</strong> Consumers, n=609 <strong>and</strong> Mental Health<br />
Consumers, n=1122, <strong>Durham</strong> LMEs. Note: Hispanic Orig<strong>in</strong> could be more than one race<br />
<strong>Substance</strong> <strong>Use</strong> <strong>and</strong> <strong>Abuse</strong> <strong>in</strong> <strong>Durham</strong> <strong>County</strong> 73
Mental Health Adults<br />
<strong>Substance</strong> <strong>Use</strong> Adults<br />
Her/opiate, coca<strong>in</strong>e, or marij.<br />
Tobacco<br />
Alcohol (any)<br />
Coca<strong>in</strong>e<br />
Marijuana<br />
Heavy alcohol<br />
Hero<strong>in</strong><br />
Other opiates<br />
Oxycont<strong>in</strong><br />
Benzopdiazep<strong>in</strong>e<br />
Over-the-counter<br />
Methamphetam<strong>in</strong>e<br />
3<br />
3<br />
2<br />
6<br />
1<br />
5<br />
1<br />
2<br />
0<br />
0<br />
20<br />
18<br />
13<br />
15<br />
27<br />
36<br />
38<br />
41<br />
45<br />
47<br />
51<br />
54<br />
68<br />
76<br />
0% 20% 40% 60% 80%<br />
Source: NC-TOPPS Initial Interviews: Adults <strong>Substance</strong> <strong>Abuse</strong> Consumers, n=609 <strong>and</strong> Mental<br />
Health Consumers, n=1122<br />
[Figure 44]<br />
NCTOPPS self-reported drug use <strong>in</strong> the past 12 months by adults <strong>in</strong> substance abuse <strong>and</strong> mental<br />
health treatment <strong>in</strong> <strong>Durham</strong> <strong>County</strong>, FY11<br />
<strong>Substance</strong> <strong>Use</strong> Treatment Services for Individuals Involved <strong>in</strong> Del<strong>in</strong>quent or<br />
Crim<strong>in</strong>al Activities<br />
As described throughout this report, many <strong>in</strong>dividuals with substance use needs are encounter<strong>in</strong>g<br />
our law enforcement agencies.<br />
When The <strong>Durham</strong> Center transitioned from a Local Management Entity to an <strong>in</strong>dependent<br />
Managed Care Organization (MCO), several changes occurred <strong>in</strong> with the CJRC, as previously they<br />
had shared <strong>and</strong> operated various services for the <strong>Durham</strong> Center.<br />
The Crim<strong>in</strong>al Just Resource Center (CJRC)<br />
The Crim<strong>in</strong>al Just Resource Center (CJRC) was a <strong>Durham</strong> <strong>County</strong> government agency that: (1)<br />
delivered quality rehabilitative services so offenders <strong>and</strong> at-risk youth could become productive<br />
successful citizens; (2) supervised <strong>and</strong> monitored high-risk offenders resid<strong>in</strong>g <strong>in</strong> <strong>Durham</strong> <strong>County</strong>;<br />
<strong>and</strong> (3) supported the crim<strong>in</strong>al justice system at large through collection <strong>and</strong> dissem<strong>in</strong>ation of<br />
<strong>Substance</strong> <strong>Use</strong> <strong>and</strong> <strong>Abuse</strong> <strong>in</strong> <strong>Durham</strong> <strong>County</strong> 74
crim<strong>in</strong>al <strong>and</strong> treatment histories (70). From 1994 through 2012 the Crim<strong>in</strong>al Justice Resource<br />
Center (CJRC) collaborated to provide direct services to <strong>in</strong>dividuals who are <strong>in</strong>carcerated or who<br />
had crim<strong>in</strong>al histories. After the end of fiscal year 2012, the <strong>Durham</strong> Assessment Team <strong>and</strong> Court<br />
Screen<strong>in</strong>gs services ended due to chang<strong>in</strong>g budget priorities for Alliance Behavioral Healthcare<br />
(71).<br />
One of the largest services provided by the CJRC was substance abuse treatment. In fiscal year<br />
2012, CJRC provided the follow<strong>in</strong>g services: (note that some <strong>in</strong>dividuals may be treated <strong>in</strong> more<br />
than one program so these numbers can be added to reach the total number served):<br />
<br />
282 clients received substance abuse treatment, <strong>in</strong>clud<strong>in</strong>g 88% of community based<br />
corrections clients<br />
437 jail <strong>in</strong>mates through the STARR program (47% were court ordered <strong>and</strong> 74%<br />
graduated), <strong>Substance</strong> <strong>Abuse</strong> Treatment <strong>and</strong> Recidivism Reduction (STARR) which is a<br />
cooperative effort between CJRC <strong>and</strong> the <strong>Durham</strong> <strong>County</strong> Office of the Sheriff. STARR is an<br />
<strong>in</strong>tensive chemical dependency treatment program for crim<strong>in</strong>al offenders. Individuals who<br />
successfully complete STARR can participate <strong>in</strong> STARR GRAD, an additional four week<br />
program.<br />
<br />
245 <strong>in</strong>mates through STARR GRAD (55% were court ordered <strong>and</strong> 62% graduated)<br />
Drug Treatment Court<br />
<strong>Durham</strong> <strong>County</strong> operates a Drug Treatment Court, designed to provide treatment services to<br />
chemically dependent non-violent offenders by hold<strong>in</strong>g these offenders responsible for comply<strong>in</strong>g<br />
with court-ordered treatment plans. An overarch<strong>in</strong>g goal of the drug treatment court is to help<br />
offenders recover from their addiction by provid<strong>in</strong>g the appropriate services <strong>and</strong> <strong>in</strong> turn help<br />
reduce the recidivism rate. Evidence suggests that drug treatment courts are effective at reduc<strong>in</strong>g<br />
recidivism rates (72). Accord<strong>in</strong>g to their website, “In July 2011, CJRC assumed operation of the<br />
Adult Drug Treatment Court for <strong>Durham</strong> after all fund<strong>in</strong>g for drug courts was elim<strong>in</strong>ated <strong>in</strong> the<br />
state budget. Drug Treatment Court provides for the engagement of court-ordered treatment<br />
services to offenders whose adjudication was a direct result of drug dependencies(73).” Between<br />
Oct 2011 <strong>and</strong> June 2012, Drug Treatment Court served 47 offenders. “Of the 47, 4 graduated <strong>and</strong> 2<br />
are employed, 4 were discharged for medical reasons, 10 were term<strong>in</strong>ated for non-compliance<br />
with program rules, <strong>and</strong> 29 rema<strong>in</strong> active program participants(71).”<br />
<strong>Substance</strong> <strong>Use</strong> <strong>and</strong> <strong>Abuse</strong> <strong>in</strong> <strong>Durham</strong> <strong>County</strong> 75
Discussion<br />
This report used numerous data sources provided by state <strong>and</strong> community organizations to<br />
demonstrate the ways <strong>in</strong> which substance use affects <strong>Durham</strong> residents <strong>and</strong> the public<br />
organizations that serve our community. Numerous studies have exam<strong>in</strong>ed the national costs of<br />
substance use <strong>and</strong> the potential sav<strong>in</strong>gs of treatment. Although estimates of the exact benefit-tocost<br />
ratio vary <strong>in</strong> range, there is little controversy that the benefits far exceed the costs (72, 74).<br />
Studies have estimated a cost sav<strong>in</strong>gs of 7:1, which means for every $1 spent on treatment, the<br />
community saves $7. Societal cost sav<strong>in</strong>gs of substance use treatment <strong>in</strong>clude reduced crime,<br />
higher employment, <strong>and</strong> reduced dependence upon public systems to name a few benefits.<br />
Many of the harms from substance use <strong>in</strong> <strong>Durham</strong> <strong>County</strong> occur because of misuse <strong>and</strong> abuse of<br />
legal substances such as alcohol, tobacco products, <strong>and</strong> prescription drugs. One local effort to curb<br />
alcohol <strong>and</strong> tobacco misuse is the Good Neighbor Program, which works with local alcohol<br />
retailers to stop the sell<strong>in</strong>g of alcohol <strong>and</strong> tobacco products to m<strong>in</strong>ors. Other local programs<br />
address the <strong>in</strong>creas<strong>in</strong>g trend of prescription drug misuse <strong>and</strong> abuse. Operation Medic<strong>in</strong>e Drop, a<br />
collaborative program between NC Safe Kids <strong>and</strong> local law enforcement agencies <strong>in</strong>clud<strong>in</strong>g the<br />
<strong>Durham</strong> Police Department <strong>and</strong> the <strong>Durham</strong> Sheriff’s Office, has <strong>in</strong>stalled a permanent drop box <strong>in</strong><br />
the lobby of the DPD for <strong>in</strong>dividuals to dispose of unused medication anonymously <strong>and</strong> safely (75).<br />
In one day over 34,000 pills, as well as needles, creams <strong>and</strong> other medications were collected (76).<br />
This program gives <strong>Durham</strong> residents a safe option for dispos<strong>in</strong>g of medication.<br />
For this report to be most useful <strong>in</strong> underst<strong>and</strong><strong>in</strong>g the issues <strong>in</strong> <strong>Durham</strong> it is important for a broad<br />
range of community members to reflect upon the report. Each community agency has a unique<br />
vantage po<strong>in</strong>t of the problem. In addition, keep<strong>in</strong>g abreast of state trends helps to <strong>in</strong>form what<br />
might be an emerg<strong>in</strong>g problem <strong>in</strong> North Carol<strong>in</strong>a. It is important to not ask one agency to<br />
cont<strong>in</strong>uously provide <strong>in</strong>formation or to perform a service without also try<strong>in</strong>g to help alleviate the<br />
problems that they face. Community agencies <strong>and</strong> citizens <strong>in</strong> <strong>Durham</strong> could create <strong>and</strong> implement<br />
an action plan to use the data <strong>in</strong> this study to highlight opportunities for policy <strong>and</strong> practice<br />
changes.<br />
<strong>Substance</strong> <strong>Use</strong> <strong>and</strong> <strong>Abuse</strong> <strong>in</strong> <strong>Durham</strong> <strong>County</strong> 76
Appendix.<br />
Summary of change over time <strong>in</strong> substance use <strong>in</strong>dicators <strong>in</strong> <strong>Durham</strong>, NC<br />
Numbers based on adm<strong>in</strong>istrative data have fluctuations. A three-year mov<strong>in</strong>g average is used to<br />
smooth these fluctuations. Ideally we would have taken a base year score from 2000, 2001 <strong>and</strong><br />
2002 <strong>and</strong> a current score from 2010, 2011, <strong>and</strong> 2012. Percent change is calculated as current yearbase<br />
year divided by the base year.<br />
<strong>Durham</strong> <strong>County</strong> Indicators<br />
First 3-year<br />
average<br />
available<br />
Last 3-year<br />
average<br />
available<br />
%<br />
Change<br />
Deaths 2004-2006 2009-2011<br />
Total deaths related to substance use 34.3 45.7 33.0%<br />
Deaths associated with alcohol 17.7 23.0 30.2%<br />
Deaths associated with coca<strong>in</strong>e 10.3 9.3 -9.7%<br />
Deaths associated with hero<strong>in</strong> 2.0 2.3 16.7%<br />
Deaths associated with prescription drugs 9.3 16.3 75.0%<br />
HIV <strong>and</strong> Injection Drug <strong>Use</strong> 2000-2002 2009-2011<br />
Number of cases of HIV related to IDU 9.3
<strong>Durham</strong> <strong>County</strong> Indicators cont…<br />
First 3-year<br />
average<br />
available<br />
Last 3-year<br />
average<br />
available<br />
%<br />
Change<br />
Percent of pregnant women who smoke 2000-2002 2007-2009<br />
All women 5.4 5.4 0.0%<br />
White women 3.5 2.9 -18.9%<br />
M<strong>in</strong>ority women 7.7 9.2 19.0%<br />
Alcohol Beverage Control Board of Spirituous Liquor to the<br />
General Public<br />
2000-2002 2010-2012<br />
Gross sales to the general public $17,733,333 $19,666,667 10.9%<br />
Notes: *<strong>Substance</strong> use among homes was not collected <strong>in</strong> 2001 so a 2-year average was used. † Includes<br />
arrests for DUI. ‡ Includes both charges for sale <strong>and</strong> possession<br />
<strong>Substance</strong> <strong>Use</strong> <strong>and</strong> <strong>Abuse</strong> <strong>in</strong> <strong>Durham</strong> <strong>County</strong> 78
References<br />
1. North Carol<strong>in</strong>a Department of Health <strong>and</strong> Human Services. (2011). Appendices for MH/DD/SAS<br />
Community Systems Progress Report: Fourth Quarter SFY 2010-2011. Retrived from<br />
http://www.ncdhhs.gov/mhddsas/statspublications/Reports/DivisionInitiativeReports/comm<br />
unitysystems/<br />
2. National Institute on Drug <strong>Abuse</strong>, US Department of Health <strong>and</strong> Human Services, National<br />
Institutes of Health. (2009). Epidemiologic Trends <strong>in</strong> Drug <strong>Abuse</strong>: Proceed<strong>in</strong>gs of the<br />
Community Epidemiology Work Group. (Report No.: NIH Publication No. (10-7421)). Retrived<br />
from http://www.drugabuse.gov/sites/default/files/cewgjune09vol1_web508.pdf<br />
3. Gifford E, Evans K, Rosch J, Foster A. (2010). <strong>Substance</strong> <strong>Use</strong> <strong>and</strong> <strong>Abuse</strong> <strong>in</strong> <strong>Durham</strong> <strong>County</strong>: The<br />
Partnership for a Healthy <strong>Durham</strong> <strong>Substance</strong> <strong>Abuse</strong> <strong>and</strong> Mental Health Committee. Retrived<br />
from<br />
http://www.child<strong>and</strong>familypolicy.duke.edu/pdfs/news/2010_<strong>Substance</strong>_<strong>Use</strong>_<strong>Abuse</strong>_<strong>Durham</strong>_C<br />
ounty.pdf<br />
4. Gifford E, Foster A, Rosch J. (2006). <strong>Substance</strong> <strong>Use</strong> <strong>and</strong> <strong>Abuse</strong> <strong>in</strong> <strong>Durham</strong> <strong>County</strong>: Healthy<br />
<strong>Durham</strong> <strong>Substance</strong> <strong>Abuse</strong> Subcommittee. Retrived from<br />
http://www.child<strong>and</strong>familypolicy.duke.edu/pdfs/pubpres/<strong>Durham</strong>SA3-21-2007.pdf<br />
5. National Institue of Drug <strong>Abuse</strong>. (2006). Assess<strong>in</strong>g Drug <strong>Abuse</strong> with<strong>in</strong> <strong>and</strong> across communities:<br />
Community Epidemiology Surveillance Networks on Drug <strong>Abuse</strong>. (Report No.: NIH Publication<br />
06-3614). Retrived from http://www.drugabuse.gov/publications/assess<strong>in</strong>g-drug-abusewith<strong>in</strong>-across-communities<br />
6. United States Census Bureau. 2010. State & <strong>County</strong> QuickFacts. Data derived from Population<br />
Estimates, Census of Population <strong>and</strong> Hous<strong>in</strong>g, Small Area Income <strong>and</strong> Poverty Estimates, State<br />
<strong>and</strong> <strong>County</strong> Hous<strong>in</strong>g Unit Estimates, <strong>County</strong> Bus<strong>in</strong>ess Patterns, Nonemployer Statistics,<br />
Economic Census, Survey of Bus<strong>in</strong>ess Owners, Build<strong>in</strong>g Permits, Consolidated Federal Funds<br />
Report. Available at http://quickfacts.census.gov/qfd/states/37/37063.html. Accessed June<br />
2010<br />
7. <strong>Substance</strong> <strong>Abuse</strong> <strong>and</strong> Mental Health Services Adm<strong>in</strong>istration (SAMHSA). (2006). Prescription<br />
Medications: Misuse, <strong>Abuse</strong>, Dependence, <strong>and</strong> Addiction. <strong>Substance</strong> <strong>Abuse</strong> Treatment<br />
Advisory;5(2):1-4.<br />
8. United States Department of Health <strong>and</strong> Human Services (US DHHS), Centers for Disease<br />
Control <strong>and</strong> Prevention (CDC), National Center for Health Statistics (NCHS), CDC WONDER Onl<strong>in</strong>e<br />
Database. (2011). Bridged-Race Population Estimates, United States July 1st resident<br />
population by state, county, age, sex, bridged-race, <strong>and</strong> Hispanic orig<strong>in</strong>. Retrived from<br />
http://wonder.cdc.gov/bridged-race-v2008.html<br />
9. Partnership for a Healthy <strong>Durham</strong>. (2011). 2010 <strong>Durham</strong> <strong>County</strong> Community Health Op<strong>in</strong>ion<br />
Survey Results. Retrived from http: //www.healthydurham.org/docs/Appendix%20G.pdf<br />
10. North Carol<strong>in</strong>a Division of Public Health, Carol<strong>in</strong>a Center for Health Informatics. The North<br />
Carol<strong>in</strong>a Disease Event Track<strong>in</strong>g <strong>and</strong> Epidemiologic Collection Tool (NC DETECT). Available at<br />
http://www.ncdetect.org/.<br />
11. North Carol<strong>in</strong>a Injury & Violence Prevention Branch, North Carol<strong>in</strong>a Department of Health <strong>and</strong><br />
Human Services. (2013). Prescription & Drug Overdoses. Retrived from<br />
http://<strong>in</strong>juryfreenc.ncdhhs.gov/About/Poison<strong>in</strong>gOverdoseFactSheet2013.pdf<br />
12. North Carol<strong>in</strong>a Division of Public Health Epidemiology Section: HIV/STD Prevention <strong>and</strong> Care<br />
Branch. (2011). Epidemiologic Profile for HIV/STD Prevention & Care Plann<strong>in</strong>g. Retrived from<br />
http://epi.publichealth.nc.gov/cd/stds/figures/Epi_Profile_2011.pdf<br />
<strong>Substance</strong> <strong>Use</strong> <strong>and</strong> <strong>Abuse</strong> <strong>in</strong> <strong>Durham</strong> <strong>County</strong> 79
13. North Carol<strong>in</strong>a Division of Public Health Epidemiology Section: Communicable Disease Branch.<br />
(2008). HIV/STD Surveillance Report. Retrived from<br />
http://epi.publichealth.nc.gov/cd/stds/figures/std08rpt.pdf<br />
14. North Carol<strong>in</strong>a State Center for Health Statistics. (2013). 2013 <strong>County</strong> Health Data Book: Death<br />
Counts <strong>and</strong> Crude Death Rates per 100,000 Population for Lead<strong>in</strong>g Causes of Death, by Age<br />
Groups NC 2007-2011. Retrived from http://www.schs.state.nc.us/SCHS/data/databook/<br />
15. North Carol<strong>in</strong>a Division of Public Health Epidemiology Section: HIV/STD Prevention <strong>and</strong> Care<br />
Branch. (2010). <strong>Durham</strong> <strong>County</strong> HIV Disease Cases, provided by staff at the Communicable<br />
Disease Branch at the NC Division of Public Health.<br />
16. North Carol<strong>in</strong>a Division of Public Health Epidemiology Section: HIV/STD Prevention <strong>and</strong> Care<br />
Branch. (2008). 2007 Regional HIV/STD Surveillance Tables.<br />
17. Smith DK, Johnson AB, Pears KC, Fisher PA, DeGarmo DS. (2007). Child maltreatment <strong>and</strong> foster<br />
care: unpack<strong>in</strong>g the effects of prenatal <strong>and</strong> postnatal parental substance use. Child<br />
Maltreatment;12(2):150-160.<br />
18. U.S. Department of Health <strong>and</strong> Human Services, Adm<strong>in</strong>istration for Children <strong>and</strong> Families,<br />
Adm<strong>in</strong>istration on Children Youth <strong>and</strong> Families, Children’s Bureau, Office on Child <strong>Abuse</strong> <strong>and</strong><br />
Neglect. (2009). Protect<strong>in</strong>g Children <strong>in</strong> Families Affected by <strong>Substance</strong> <strong>Use</strong> Disorders. Retrived<br />
from http://www.childwelfare.gov/pubs/usermanuals/substanceuse/substanceuse.pdf<br />
19. North Carol<strong>in</strong>a Coalition to End Homelessness. Po<strong>in</strong>t-<strong>in</strong>-Time Count Data. Available at<br />
http://www.ncceh.org/PITdata/<br />
20. <strong>Durham</strong> Open<strong>in</strong>g Doors Homeless Prevention & Services. Face of Homelessness <strong>in</strong> <strong>Durham</strong>.<br />
Available at http://durhamtenyearplan.com/?page_id=58. Accessed February 2013<br />
21. National Coalition Aga<strong>in</strong>st Domestic Violence. (2007). Domestic Violence Facts. Retrived from<br />
http://www.ncadv.org/files/DomesticViolenceFactSheet(National).pdf<br />
22. North Carol<strong>in</strong>a Department of Justice. (2013). Report on domestic violence related homicides<br />
occurr<strong>in</strong>g <strong>in</strong> 2012. Retrived from http://www.ncdoj.gov/getdoc/4105e22f-f094-4903-89d1-<br />
c1354ebc5958/2013DVReport.aspx<br />
23. Fazzone PA, Holton JK, Reed BG. (1997). Chapter 3: Batterers: An Overview. In: <strong>Substance</strong> abuse<br />
treatment <strong>and</strong> domestic violence treatment improvement protocol (TIP) series 25. US<br />
Department of Health <strong>and</strong> Human Services.<br />
24. North Carol<strong>in</strong>a Department of Justice. The North Carol<strong>in</strong>a Uniform Crime Report<strong>in</strong>g (UCR)<br />
Program. Available at http://crimereport<strong>in</strong>g.ncdoj.gov/<br />
25. Office of Justice Programs, Bureau of Justice Statistics. Drugs <strong>and</strong> Crime Facts: Drug use <strong>and</strong><br />
crime. Available at http://bjs.ojp.usdoj.gov/content/dcf/duc.cfm. Accessed March 2013<br />
26. National Institute on Drug <strong>Abuse</strong>. 2009. Treat<strong>in</strong>g Offenders with Drug Problems: Integrat<strong>in</strong>g<br />
Public Health <strong>and</strong> Public Safety. Available at http://drugabuse.gov/tib/drugs_crime.html.<br />
Accessed August 2010<br />
27. McVay D, Schiraldi V, Ziedenberg J. (2004). Treatment or Incarceration? National <strong>and</strong> State<br />
F<strong>in</strong>d<strong>in</strong>gs on the Efficacy <strong>and</strong> Cost Sav<strong>in</strong>gs of Drug Treatment Versus Imprisonment. Retrived<br />
from http://www.justicepolicy.org/uploads/justicepolicy/documents/04-<br />
01_rep_mdtreatmentor<strong>in</strong>carceration_ac-dp.pdf<br />
28. Office of National Drug Control Policy, Drug Policy Information Clear<strong>in</strong>ghouse. (2001). Drug<br />
Treatment <strong>in</strong> the Crim<strong>in</strong>al Justice System. Wash<strong>in</strong>gton, DC. Retrived from<br />
http://www.whitehousedrugpolicy.gov/publications/pdf/94406.pdf<br />
29. <strong>Durham</strong> <strong>County</strong> Government-Office of the Sheriff. Current Inmate Population. Available at<br />
http://dconc.gov/<strong>in</strong>dex.aspx?page=749<br />
30. Office of Juvenile Justice <strong>and</strong> Del<strong>in</strong>quency Prevention. (2010). Youth’s Needs <strong>and</strong> Services: U.S.<br />
Department of Justice. Retrived from https://www.ncjrs.gov/pdffiles1/ojjdp/227728.pdf<br />
<strong>Substance</strong> <strong>Use</strong> <strong>and</strong> <strong>Abuse</strong> <strong>in</strong> <strong>Durham</strong> <strong>County</strong> 80
31. Chung HL, Little M, Ste<strong>in</strong>berg L. (2005). Chapter 3: The Transition to Adulthood for Adolescents<br />
<strong>in</strong> the Juvenile Justice System: A Developmental Perspective. In: Osgood DW, Foster EM,<br />
Flanagan C, Ruth G, editors. On Your Own without a Net. Chicago: The University of Chicago<br />
Press.<br />
32. Altschuler D. (2005). Chapter 4: Policy <strong>and</strong> Program Perspectives on the Transition to<br />
Adulthood for Adolescents <strong>in</strong> the Juvenile Justice System. In: Osgood DW, Foster EM, Flanagan<br />
C, Ruth G, editors. On Your Own without a Net. Chicago: The University of Chicago Press.<br />
33. Cohen MA, Piquero AR. (2009). New Evidence on the Monetary Value of Sav<strong>in</strong>g a High Risk<br />
Youth. Journal of Quantitative Crim<strong>in</strong>ology;25:25-249.<br />
34. North Carol<strong>in</strong>a Department of Public Instruction. Annual Report of School Crime <strong>and</strong> Violence,<br />
years 2005-2006 to 2011-2012. Retrived from<br />
http://www.ncpublicschools.org/research/discipl<strong>in</strong>e/reports/<br />
35. The Office of Postsecondary Education. The campus safety <strong>and</strong> security data analysis cutt<strong>in</strong>g<br />
tool. Available at http://ope.ed.gov/security/<br />
36. National Institute on Drug <strong>Abuse</strong>. 2011. Topics <strong>in</strong> Brief: Prescription Drug <strong>Abuse</strong>. Available at<br />
http://www.drugabuse.gov/publications/topics-<strong>in</strong>-brief/prescription-drug-abuse. Accessed<br />
March 2013<br />
37. Carpenter L, Chen P, Chromy JR, Copello E, Cunn<strong>in</strong>gham DB, Dai L, et al. (2007). Results from<br />
the 2007 National Survey on Drug <strong>Use</strong> <strong>and</strong> Health : National F<strong>in</strong>d<strong>in</strong>gs Table of Contents. 7:1-95.<br />
38. Centers for Disease Control <strong>and</strong> Prevention (CDC). 2012. CDC Gr<strong>and</strong> Rounds: Prescription Drug<br />
Overdoses - a U.S. Epidemic. Available at<br />
http://www.cdc.gov/mmwr/preview/mmwrhtml/mm6101a3.htm. Accessed March 2013<br />
39. National Institute on Drug <strong>Abuse</strong>. (2011). Prescription Drugs: <strong>Abuse</strong> <strong>and</strong> Addiction. (Report<br />
No.: 11-4881). Retrived from http://www.drugabuse.gov/sites/default/files/rrprescription.pdf<br />
40. Angle M, Leslie S, Brooks J. (2011). <strong>Durham</strong> Public Schools, Youth Risk Behavior Survey (YRBS).<br />
41. Angle M, Sharpe L. (2009). <strong>Durham</strong> <strong>County</strong> Schools, Youth Risk Behavior Survey (YRBS).<br />
42. North Carol<strong>in</strong>a State Center for Health Statistics. (2013). Behavioral Risk Factor Surveillance<br />
System (BRFSS).<br />
43. Centers for Disease Control <strong>and</strong> Prevention (CDC). 2010. Injury prevention & control: Motor<br />
vehicle safety, Impaired Driv<strong>in</strong>g. Available at<br />
http://www.cdc.gov/MotorVehicleSafety/Impaired_Driv<strong>in</strong>g/impaired-drv_factsheet.html.<br />
Accessed June 2010<br />
44. U.S. Department of Transportation: National Highway Traffic Safety Adm<strong>in</strong>istration. (2012).<br />
Alcohol-Impaired Driv<strong>in</strong>g.<br />
45. North Carol<strong>in</strong>a Alcohol Facts. Alcohol <strong>and</strong> Motor Vehicle Injury. Available at<br />
http://www.hsrc.unc.edu/ncaf/<strong>in</strong>dex.cfm?p=alc<strong>in</strong>j<br />
46. North Carol<strong>in</strong>a Alcohol Facts. 2008. About the North Carol<strong>in</strong>a alcohol facts (NCAF) website.<br />
Available at http://www.hsrc.unc.edu/ncaf/<strong>in</strong>dex.cfm?p=home.<br />
47. Centers for Disease Control <strong>and</strong> Prevention (CDC). Smok<strong>in</strong>g <strong>and</strong> Tobacco <strong>Use</strong>: Tobacco-Related<br />
Mortality. Available at<br />
http://www.cdc.gov/tobacco/data_statistics/fact_sheets/health_effects/tobacco_related_morta<br />
lity/. Accessed June 2010<br />
48. Department of Health <strong>and</strong> Human Services, Centers for Disease Control <strong>and</strong> Prevention,<br />
National Center for Chronic Disease Prevention <strong>and</strong> Health Promotion. (2004). The health<br />
consequences of smok<strong>in</strong>g: a report of the Surgeon General. (Report No.: U.S. G.P.O., 2004).<br />
Wash<strong>in</strong>gton, DC. Retrived from<br />
http://www.cdc.gov/tobacco/data_statistics/sgr/2004/pdfs/<strong>in</strong>sidecover.pdf<br />
<strong>Substance</strong> <strong>Use</strong> <strong>and</strong> <strong>Abuse</strong> <strong>in</strong> <strong>Durham</strong> <strong>County</strong> 81
49. North Carol<strong>in</strong>a State Center for Health Statistics. (2013). 2013 <strong>County</strong> Health Data Book: Ten<br />
Lead<strong>in</strong>g Causes of Death by <strong>County</strong> of Residence <strong>and</strong> Age Group: Rank<strong>in</strong>g, Number of Deaths,<br />
<strong>and</strong> Unadjusted Death Rates per 100,000 Population NC 2007-2011. Retrived from<br />
http://www.schs.state.nc.us/SCHS/data/databook/<br />
50. North Carol<strong>in</strong>a State Center for Health Statistics. (2010). 2010 <strong>County</strong> Health Data Book: Death<br />
Counts <strong>and</strong> Crude Death Rates per 100,000 Population for Lead<strong>in</strong>g Causes of Death, by Age<br />
Groups NC 2004-2008. Retrived from http://www.schs.state.nc.us/schs/data/databook/2010/<br />
51. North Carol<strong>in</strong>a State Center for Health Statistics. Basic Automated Birth Yearbook, North<br />
Carol<strong>in</strong>a Residents (the BABY Book). Available at<br />
http://www.schs.state.nc.us/schs/data/vitalstats.cfm<br />
52. Centers for Disease Control <strong>and</strong> Prevention (CDC). Smok<strong>in</strong>g <strong>and</strong> Tobacco <strong>Use</strong>: Smok<strong>in</strong>g<br />
Cessation. Available at<br />
http://www.cdc.gov/tobacco/data_statistics/fact_sheets/cessation/quitt<strong>in</strong>g/<strong>in</strong>dex.htm#benefi<br />
ts. Accessed February 2013<br />
53. National Institute on Drug <strong>Abuse</strong>. NIDA InfoFacts: High School <strong>and</strong> Youth Trends. Available at<br />
http://www.drugabuse.gov/<strong>in</strong>fofacts/HSYouthtrends.html. Accessed August 2010<br />
54. The Office of Juvenile Justice <strong>and</strong> Del<strong>in</strong>quency Prevention. (1998). Drug Identification <strong>and</strong><br />
Test<strong>in</strong>g <strong>in</strong> the Juvenile Justice System. Wash<strong>in</strong>gton, D.C. Retrived from<br />
http://www.ncjrs.gov/pdffiles/167889.pdf<br />
55. Johnston LD, O'Malley PM, Bachman JG, Schulenberg JE. (2012). Monitor<strong>in</strong>g the Future: National<br />
Survey Results on Drug <strong>Use</strong>, 1975-2011. Ann Arbor. Retrived from<br />
http://www.monitor<strong>in</strong>gthefuture.org/pubs/monographs/mtf-vol1_2011.pdf<br />
56. Johnston LD. (2003). Alcohol <strong>and</strong> illicit drugs: The role of risk perceptions. In: Romer D, editor.<br />
Toward an <strong>in</strong>tegrated approach. Thous<strong>and</strong>s Oak, CA: Sage; p. 56-74.<br />
57. <strong>Substance</strong> <strong>Abuse</strong> <strong>and</strong> Mental Health Services Adm<strong>in</strong>istration (SAMHSA). (2013). Trends <strong>in</strong><br />
Adolescent <strong>Substance</strong> <strong>Use</strong> <strong>and</strong> Perception of Risk from <strong>Substance</strong> <strong>Use</strong>. Rockville, MD. Retrived<br />
from http://www.samhsa.gov/data/2k13/NSDUH099a/sr099a-risk-perception-trends.pdf<br />
58. <strong>Substance</strong> <strong>Abuse</strong> <strong>and</strong> Mental Health Services Adm<strong>in</strong>istration (SAMHSA). (2009). Adolescent<br />
Behavioral Health In Brief: North Carol<strong>in</strong>a. Retrived from<br />
http://www.samhsa.gov/states<strong>in</strong>brief/2009/teens/OASTeenReportNC.pdf<br />
59. U.S. Department of Justice Archives. 2013. National Drug Intelligence Center. Available at<br />
http://www.justice.gov/archive/ndic/ndic-moved.html. Accessed April 2013<br />
60. National Drug Intelligence Center. (2010). Atlanta High Intensity Drug Traffick<strong>in</strong>g Area<br />
(HIDTA): Drug Market Analysis 2010. Retrived from<br />
http://www.justice.gov/archive/ndic/pubs40/40382/40382p.pdf<br />
61. <strong>Durham</strong> ABC. 2006. The <strong>Durham</strong> <strong>County</strong> ABC Board. Available at<br />
http://www.durhamabc.com/newsite/asp/<strong>in</strong>dex.asp?action=board. Accessed February 2013<br />
62. NC State Data Center. LINC: Log Into North Carol<strong>in</strong>a. Available at http://l<strong>in</strong>c.state.nc.us/<br />
63. <strong>Durham</strong> Together for Resilient Youth. Available at http://www.durhamtry.org/. Accessed<br />
February 2013<br />
64. <strong>Durham</strong> TRY. 2012. Community Success with The “ Good Neighbor ” Initiative. Available at<br />
http://www.preventionistheanswer.org/2012/community-success-with-the-good-neighbor<strong>in</strong>itiative/.<br />
65. Personal Communication with T<strong>in</strong>a Howard. February 18, 2013.<br />
<strong>Substance</strong> <strong>Use</strong> <strong>and</strong> <strong>Abuse</strong> <strong>in</strong> <strong>Durham</strong> <strong>County</strong> 82
66. North Carol<strong>in</strong>a Department of Health <strong>and</strong> Human Services: Division of Mental Health -<br />
Developmental Disabilities <strong>and</strong> <strong>Substance</strong> <strong>Abuse</strong> Services. (2011). Adult Mental Health<br />
Consumers: <strong>Durham</strong> LME. Initial Interviews. July 1, 2010 through June 30, 2011. Retrived from<br />
http://www.ncdhhs.gov/mhddsas/statspublications/Reports/DivisionInitiativeReports/NCTO<br />
PPS/<br />
67. North Carol<strong>in</strong>a Department of Health <strong>and</strong> Human Services: Division of Mental Health -<br />
Developmental Disabilities <strong>and</strong> <strong>Substance</strong> <strong>Abuse</strong> Services. (2011). Adolescent (12-17)<br />
<strong>Substance</strong> <strong>Abuse</strong> Consumers: <strong>Durham</strong> LME. Initial Interviews. July 1, 2010 through June 30,<br />
2011. Retrived from<br />
http://www.ncdhhs.gov/mhddsas/statspublications/Reports/DivisionInitiativeReports/NCTO<br />
PPS/<br />
68. North Carol<strong>in</strong>a Department of Health <strong>and</strong> Human Services: Division of Mental Health -<br />
Developmental Disabilities <strong>and</strong> <strong>Substance</strong> <strong>Abuse</strong> Services. (2011). Adult <strong>Substance</strong> <strong>Abuse</strong><br />
Consumers: <strong>Durham</strong> LME. Initial Interviews. July 1, 2010 through June 30, 2011. Retrived from<br />
http://www.ncdhhs.gov/mhddsas/statspublications/Reports/DivisionInitiativeReports/NCTO<br />
PPS/<br />
69. North Carol<strong>in</strong>a Department of Health <strong>and</strong> Human Services: Division of Mental Health -<br />
Developmental Disabilities <strong>and</strong> <strong>Substance</strong> <strong>Abuse</strong> Services. (2011). Adolescent (Ages 12-17)<br />
Mental Health Consumers: <strong>Durham</strong> LME. Initial Interviews. July 1, 2010 through June 30, 2011.<br />
Retrived from<br />
http://www.ncdhhs.gov/mhddsas/statspublications/Reports/DivisionInitiativeReports/NCTO<br />
PPS/<br />
70. <strong>Durham</strong> <strong>County</strong> Crim<strong>in</strong>al Justice Resource Center. (2011). Crim<strong>in</strong>al Justice Resource Center<br />
Annual Report: FY 2011. Retrived from<br />
http://dconc.gov/modules/showdocument.aspx?documentid=1120<br />
71. <strong>Durham</strong> <strong>County</strong> Crim<strong>in</strong>al Justice Resource Center. (2012). Crim<strong>in</strong>al Justice Resource Center<br />
Annual Report: FY 2012. Retrived from<br />
http://dconc.gov/modules/showdocument.aspx?documentid=2443<br />
72. Gottfredson DC, Najaka SS, Kearly B. (2006). Effectiveness of drug treatment courts: Evidence<br />
from a r<strong>and</strong>omized trial. Crim<strong>in</strong>ology, 2(2):171-196.<br />
73. <strong>Durham</strong> <strong>County</strong> Crim<strong>in</strong>al Justice Resource Center. Mental Health <strong>and</strong> Court Services. Available<br />
at http://dconc.gov/<strong>in</strong>dex.aspx?page=147. Accessed February 2013<br />
74. Koenig L, Denmead G, Nguyen R, Harrison M, Harwood H. (1999). The Costs <strong>and</strong> Benefits of<br />
<strong>Substance</strong> <strong>Abuse</strong> Treatment: F<strong>in</strong>d<strong>in</strong>gs from the National Treatment Improvement Evaluation<br />
Study. Retrived from<br />
http://www.lew<strong>in</strong>.com/~/media/Lew<strong>in</strong>/Site_Sections/Publications/1563.pdf<br />
75. <strong>Durham</strong> Police Department. (2012). 2012 Annual Report. Retrived from<br />
http://ftpcontent5.worldnow.com/wncn/pdf/130304_<strong>Durham</strong>Police2012AnnualReport.pdf<br />
76. The Division of Plann<strong>in</strong>g <strong>and</strong> Development, Sheriff's Office of <strong>Durham</strong> <strong>County</strong>. (2012). Annual<br />
Report, July 1, 2011 — June 30, 2012. Retrived from<br />
http://dconc.gov/modules/showdocument.aspx?documentid=2632<br />
<strong>Substance</strong> <strong>Use</strong> <strong>and</strong> <strong>Abuse</strong> <strong>in</strong> <strong>Durham</strong> <strong>County</strong> 83