AN3914, Modern Altimeter and Barometer System using ... - Freescale
AN3914, Modern Altimeter and Barometer System using ... - Freescale
AN3914, Modern Altimeter and Barometer System using ... - Freescale

You also want an ePaper? Increase the reach of your titles
YUMPU automatically turns print PDFs into web optimized ePapers that Google loves.
<strong>Freescale</strong> Semiconductor<br />
Application Note<br />
<strong>AN3914</strong><br />
Rev 0, 7/2009<br />
<strong>Modern</strong> <strong>Altimeter</strong> <strong>and</strong> <strong>Barometer</strong> <strong>System</strong><br />
<strong>using</strong> the MPL115A<br />
by: John B. Young<br />
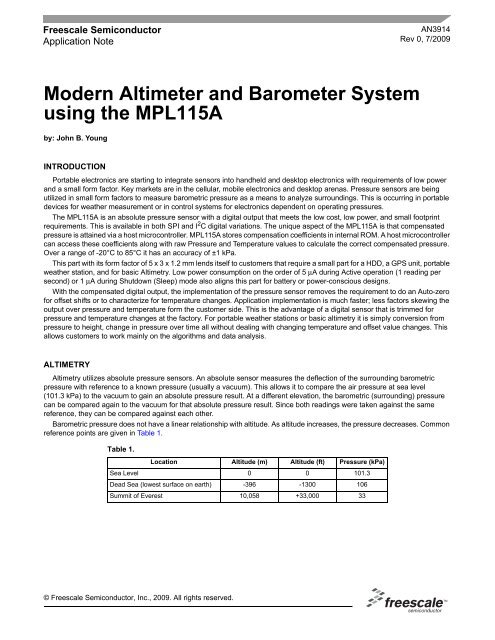
INTRODUCTION<br />
Portable electronics are starting to integrate sensors into h<strong>and</strong>held <strong>and</strong> desktop electronics with requirements of low power<br />
<strong>and</strong> a small form factor. Key markets are in the cellular, mobile electronics <strong>and</strong> desktop arenas. Pressure sensors are being<br />
utilized in small form factors to measure barometric pressure as a means to analyze surroundings. This is occurring in portable<br />
devices for weather measurement or in control systems for electronics dependent on operating pressures.<br />
The MPL115A is an absolute pressure sensor with a digital output that meets the low cost, low power, <strong>and</strong> small footprint<br />
requirements. This is available in both SPI <strong>and</strong> I 2 C digital variations. The unique aspect of the MPL115A is that compensated<br />
pressure is attained via a host microcontroller. MPL115A stores compensation coefficients in internal ROM. A host microcontroller<br />
can access these coefficients along with raw Pressure <strong>and</strong> Temperature values to calculate the correct compensated pressure.<br />
Over a range of -20°C to 85°C it has an accuracy of ±1 kPa.<br />
This part with its form factor of 5 x 3 x 1.2 mm lends itself to customers that require a small part for a HDD, a GPS unit, portable<br />
weather station, <strong>and</strong> for basic Altimetry. Low power consumption on the order of 5 μA during Active operation (1 reading per<br />
second) or 1 μA during Shutdown (Sleep) mode also aligns this part for battery or power-conscious designs.<br />
With the compensated digital output, the implementation of the pressure sensor removes the requirement to do an Auto-zero<br />
for offset shifts or to characterize for temperature changes. Application implementation is much faster; less factors skewing the<br />
output over pressure <strong>and</strong> temperature form the customer side. This is the advantage of a digital sensor that is trimmed for<br />
pressure <strong>and</strong> temperature changes at the factory. For portable weather stations or basic altimetry it is simply conversion from<br />
pressure to height, change in pressure over time all without dealing with changing temperature <strong>and</strong> offset value changes. This<br />
allows customers to work mainly on the algorithms <strong>and</strong> data analysis.<br />
ALTIMETRY<br />
Altimetry utilizes absolute pressure sensors. An absolute sensor measures the deflection of the surrounding barometric<br />
pressure with reference to a known pressure (usually a vacuum). This allows it to compare the air pressure at sea level<br />
(101.3 kPa) to the vacuum to gain an absolute pressure result. At a different elevation, the barometric (surrounding) pressure<br />
can be compared again to the vacuum for that absolute pressure result. Since both readings were taken against the same<br />
reference, they can be compared against each other.<br />
Barometric pressure does not have a linear relationship with altitude. As altitude increases, the pressure decreases. Common<br />
reference points are given in Table 1.<br />
Table 1.<br />
Location Altitude (m) Altitude (ft) Pressure (kPa)<br />
Sea Level 0 0 101.3<br />
Dead Sea (lowest surface on earth) -396 -1300 106<br />
Summit of Everest 10,058 +33,000 33<br />
© <strong>Freescale</strong> Semiconductor, Inc., 2009. All rights reserved.
Altitude (ft)<br />
20000<br />
15000<br />
10000<br />
Altitude (ft)<br />
5000<br />
0<br />
45 55 65 75 85 95 105 115 125<br />
-5000<br />
Figure 1. Pressure (kPa) vs. Altitude (ft)<br />
At low elevations, a square meter on the earths surface has greater weight above it than at higher altitudes. This is due to the<br />
mass of water vapor <strong>and</strong> air that sits upon it. Imagine cubes of air <strong>and</strong> water vapor stacked from the ground to space. At the low<br />
altitude there is more cubic mass above, while higher altitudes will have less of these stacked above it.<br />
Air <strong>and</strong> water vapor will compress more at sea level <strong>and</strong> the air is significantly denser than at high altitude. The density is<br />
not uniform with altitude, <strong>and</strong> thus the pressure is not either. The reason for altitude’s non-linear relationship is that air has infinite<br />
compressibility. It disproportionately compresses more as weight is placed upon it. Hence the graph of Pressure vs. Altitude seen<br />
in Figure 1.<br />
The simplified mathematical equation used to calculate Altimetry in Table 2:<br />
ph<br />
–h<br />
p0<br />
-----------------<br />
------<br />
7990m<br />
ph<br />
= p0 ⋅ e<br />
where: h = 18400m ⋅ log<br />
Assuming p0 = 101.3kPa<br />
ph = Pressure (kPa) at height h (m)<br />
p0 = Initial Pressure point at sea level or 101.3 kPa.<br />
<strong>AN3914</strong><br />
Sensors<br />
<strong>Freescale</strong> Semiconductor 2
Table 2. Pressure vs. Altitude<br />
Pressure kPa ADC Counts Altitude (m) Altitude (ft)<br />
50 0 5642.17 18511.06<br />
51 15 5483.92 17991.86<br />
52 31 5328.75 17482.78<br />
53 47 5176.54 16983.4<br />
54 62 5027.17 16493.34<br />
55 78 4880.54 16012.27<br />
56 94 4736.55 15539.86<br />
57 110 4595.12 15075.85<br />
58 125 4456.14 14619.88<br />
59 141 4319.54 14171.72<br />
60 157 4185.23 13731.07<br />
61 173 4053.14 13297.7<br />
62 188 3923.21 12871.42<br />
63 204 3795.35 12451.94<br />
64 220 3669.5 12039.04<br />
65 236 3545.61 11632.58<br />
66 251 3423.61 11232.32<br />
67 267 3303.44 10838.06<br />
68 283 3185.05 10449.64<br />
69 299 3068.39 10066.9<br />
70 314 2953.41 9689.67<br />
71 330 2840.06 9317.78<br />
72 346 2728.3 8951.12<br />
73 361 2618.07 8589.47<br />
74 377 2509.35 8232.78<br />
75 393 2402.09 7880.87<br />
76 409 2296.24 7533.6<br />
77 424 2191.78 7190.88<br />
78 440 2088.67 6852.59<br />
79 456 1986.88 6518.64<br />
80 472 1886.36 6188.85<br />
81 487 1787.09 5863.16<br />
Pressure kPa ADC Counts Altitude (m) Altitude (ft)<br />
84 535 1496.47 4909.68<br />
85 550 1401.91 4599.44<br />
86 566 1308.44 4292.78<br />
87 582 1216.06 3989.7<br />
88 598 1124.73 3690.06<br />
89 613 1034.44 3393.83<br />
90 629 945.15 3100.89<br />
91 645 856.85 2811.19<br />
92 661 769.52 2524.67<br />
93 676 683.13 2241.24<br />
94 692 597.66 1960.83<br />
95 708 513.1 1683.4<br />
96 723 429.42 1408.86<br />
97 739 346.61 1137.17<br />
98 755 264.65 868.27<br />
99 771 183.53 602.13<br />
100 786 103.21 338.62<br />
101 802 23.7 77.76<br />
102 818 -55.03 -180.54<br />
103 834 -132.99 -436.32<br />
104 849 -210.2 -689.63<br />
105 865 -286.67 -940.52<br />
106 881 -362.41 -1189.01<br />
107 897 -437.45 -1435.2<br />
108 912 -511.78 -1679.07<br />
109 928 -585.43 -1920.7<br />
110 944 -658.41 -2160.14<br />
111 960 -730.73 -2397.41<br />
112 975 -802.4 -2632.55<br />
113 991 -873.43 -2865.58<br />
114 1007 -943.84 -3096.59<br />
115 1022 -1013.63 -3325.56<br />
82 503 1689.04 5541.47<br />
83 519 1592.18 5223.69<br />
<strong>AN3914</strong><br />
Sensors<br />
<strong>Freescale</strong> Semiconductor 3
Table 3. Pressure <strong>and</strong> Temperature World-Wide at that Altitude<br />
Altitude (m) Altitude (ft) Pressure (mmHg) Pressure (kPa) Temp Avg (°C)<br />
0 0 706 94.13 15<br />
305 1000 732.9 97.7 13<br />
610 2000 706.6 94.2 11<br />
914 3000 681.1 90.81 9.1<br />
1220 4000 656.3 87.5 7.1<br />
2133 7000 586.4 78.18 1.1<br />
2743 9000 543.2 72.42 -2.8<br />
3353 11000 502.6 67.01 -6.8<br />
4572 15000 428.8 57.17 -14.7<br />
6096 20000 349.9 46.65 -24.6<br />
Note: For large range measurements, temperature shifts become important as the temperature compensation<br />
of the MPL115A sensor comes into a dramatic role.<br />
Although the altitude is not going to be linear with pressure over the 50 to 115 kPa range, it can be assumed to be linear for<br />
very small sections. i.e. from a given location to 10 m in higher or lower elevation, the pressure can be assumed linear. Notice<br />
too that the pressure can be better resolved in ADC counts at lower altitude than at higher ones.<br />
For example pressure at 50 kPa vs. 101 kPa (sea level): 50 kPa = 5642.17 m; 51 kPa = 5483.92 m. The difference is 158.25 m<br />
for the 1 kPa change in pressure.<br />
At 101 kPa the altitude is 23.7 m. 102 kPa is -55.03 m (below sea level). This is 78.73 m for the 1 kPa change in pressure.<br />
Given that the ADC counts are about 15 to 16 counts for each kPa there is better resolution of 5.24 meters/count for the sea<br />
level (101 to 102 kPa) than at high elevation 10.55 m/count (50 to 51 kPa). Sea level <strong>and</strong> below will yield the best altitude to<br />
ADC count relationship, as it measures the smallest distance with the most amount of ADC counts. This is because the air is<br />
most dense in this region. It also makes the part more useful as the most populated regions do not reside in the 50 kpa area, but<br />
between sea level <strong>and</strong> 81 kPa. A reference table has been included in the appendix for cities <strong>and</strong> their altitudes.<br />
Overview<br />
The host microcontroller does the main calculations to determine the Pressure compensated for Temperature variations.<br />
MPL115A contains coefficients that are used via a second order compensation algorithm to determine the Pcomp (Compensated<br />
Pressure). The coefficients are read to the host microcontroller via I 2 C or SPI in memory address locations where they are stored.<br />
The host microcontroller also reads raw Pressure <strong>and</strong> Temperature data directly from MPL115A. With the combination of the<br />
coefficients, Raw Temperature <strong>and</strong> Pressure, the compensation algorithm is used to calculate Pcomp. The value is a 10 bit<br />
number 0 to 1023 which represents 50 to 115 kPa respectively.<br />
Note: Simple calculations would lead that (Pressure Range)/(ADC counts) would lead to a resolution of 65 kPa/1023<br />
or 0.064 kPa per an ADC count. However, due to code-skipping this is not necessarily true. The data sheet<br />
has a specification of 0.15 kPa Resolution that is more accurate. This is that every 2.36 ADC counts represent<br />
a 0.15 kPa pressure change.<br />
We guarantee a 1 kPa accuracy across the -40°C to 105°C. While we get better results than this, it is the conservative data<br />
sheet spec that is guaranteed. A 0.15 kPa change at sea level is the equivalent of 11.8 m for a 0.15 kPa pressure difference.<br />
This is done over 2.36 ADC counts, so it can be ‘pushed’ towards a possible 5 m per ADC count at this level. It will measure the<br />
11.8 m interval more accurately than a 5 m interval. Note that this is not the same for all altitudes. Higher altitudes will have<br />
decreased performance, but can be calculated.<br />
<strong>AN3914</strong><br />
Sensors<br />
<strong>Freescale</strong> Semiconductor 4
Pressure Change Altitude Change (m) ADC Change (counts) (meters/count)<br />
50 kPa to 49.85 kPa -24 2.36 10<br />
70 kPa to 69.85 kPa -17.1 2.36 7.2<br />
90 kPa to 89.85 kPa -13.3 2.36 5.6<br />
101 kPa to 101.15 kPa 11.9 2.36 5<br />
The MPL115A has a specification of a 0.15 kPa Resolution. While searching online for the current barometric pressure, the<br />
correct pressure may not be found. Most airports <strong>and</strong> cities have their current barometric pressure listed for weather conditions.<br />
In order to determine weather patterns, the current barometric conditions are often normalized with sea level. This removes<br />
altitude variation from the readings. So if the weather is clear, it may be listed as 101.3 kPa, but in actuality it may be 92 kPa.<br />
Please keep this in consideration when looking up the local altitude in kPa.<br />
WEATHER<br />
The MPL115A is an absolute device that can be used to predict <strong>and</strong> measure the barometric pressure to deduce weather<br />
patterns. Weather prediction requires a static location for the sensor <strong>and</strong> 2-3 hours to analyze a full weather pattern. Typically the<br />
pressure changes due to weather are slow, requiring a few hours to determine the sloping of the pressure change. Vertical<br />
movement or a significant airflow can interfere with results due to only weather patterns in barometric pressure. The sensor<br />
should be kept in a relatively protected area from any strong air flows, <strong>and</strong> kept at that static location during analysis. Temperature<br />
effects can change the results of a normal pressure sensor especially if the measurement is done over several hours in varying<br />
temperature. Due to the nature of the calibration <strong>and</strong> temperature compensation, MPL115A meets these requirements,<br />
compensating for temperature swings over a large 0 to 85°C operating range. It will not require auto-zeroing for shifts in offset or<br />
span over temperature.<br />
How Pressure Increases <strong>and</strong> Decreases with Weather<br />
For weather pattern prediction, the MPL115A is a well suited device with its pressure range <strong>and</strong> resolution. Barometric<br />
pressure changes can directly correlate to changes in the weather. Low pressure is typically seen as the precursor to worsening<br />
weather. High pressure increases can be interpreted as improving or clear weather. The typical reasoning can be seen in a<br />
comparison of molecular weights. If air is approximately 21% O 2 (g), 78% N 2 (g), O 2 (g) has a molecular mass of 32, N 2 (g) has a<br />
mass of 28. H 2 O (g) has a molecular mass of 18. So if there is a large amount of water vapor present in air, this air is going to<br />
be lighter than just regular dry air by itself. It’s an interesting fact that explains how weather patterns lead to high or low pressure.<br />
If bad weather originates in an area in the formation of water-vapor clouds, this is falling pressure on a barometer. The vapor<br />
will reduce the barometric pressure as the H 2 O reduces the mass above that point on the earth. High pressure will signal the<br />
clearing of the water vapor as the air dries.<br />
Another qu<strong>and</strong>ary is how weather during severe hurricanes/cyclones with high 150 mph winds be defined as low pressure?<br />
This is due to the fact that hurricanes are low pressure conditions surrounded by higher pressure. The rush of air from higher to<br />
low pressure creates the fast moving winds. The lower the pressure in the center, the greater differential pressure between high<br />
<strong>and</strong> low areas. This leads to a stronger cyclone or hurricane.<br />
Some areas are harder to predict weather patterns. Cities located at the base of mountainous regions where condensation<br />
<strong>and</strong> fog are a daily occurrence is an example. An area like Hawaii where high colder mountains meet low warm sea regions can<br />
have harder to predict results. A network of sensors can give a more exact trend, but for a single sensor in a static location, there<br />
are a few ways to have a simple st<strong>and</strong>alone weather station.<br />
Local Weather Stations<br />
When implementing a weather station, it is best to will check results with a local forecast. When researching local weather<br />
pressures, such as barometric pressure at the closest airport, remember that the weather is normalized for altitude. Normalization<br />
takes local barometric pressure <strong>and</strong> shifts it to reflect sea level altitude. Sea Level is 101.3 kPa, <strong>and</strong> by normalizing various points<br />
on a map, a meteorologist can see the weather pattern over a region. Without the normalization, the effect of altitude on the<br />
pressure reported by collection points will lead to useless data. A mountain data point will have pressure affected by altitude <strong>and</strong><br />
as it leads to the valleys, the pressure point there will be higher, telling nothing about the weather without the normalization.<br />
<strong>AN3914</strong><br />
Sensors<br />
<strong>Freescale</strong> Semiconductor 5
Airports are typical reporting stations to check barometric pressure. Some display only normalized pressure during a web<br />
search. This is such that a pilot l<strong>and</strong>ing at any airport can deduce the weather conditions by knowing the barometric pressure.<br />
If the airport is located at the beach, or on a mountainous region, normalization of this value removes the barometric variation<br />
due to the altitude. It st<strong>and</strong>ardizes pressure so that weather patterns can be mapped.<br />
Example:<br />
An airport located at 600 m elevation would have pressure of 93.97 kPa according to our pressure to altitude<br />
equation. If the weather was sunny <strong>and</strong> mostly clear, it would most probably have a published pressure of<br />
101.3 kPa for weather conditions. It may not be extremely clear skies as this would be a high pressure<br />
weather system. It would be a stable pressure with neither extreme in low or high pressure.<br />
Remember to discern this information when trying to see if the MPL115A value matches the local weather barometric pressure.<br />
Sometimes a disparity in the value occurs due to normalization.<br />
Algorithms for Weather<br />
Simple Approach<br />
How is weather predicted <strong>using</strong> the barometric sensor? There is a simple approach looking at increasing or decreasing<br />
pressure. Simply an increase over time is a trend that approaches “sunny” or “clear” days. Dropping pressure can signal a<br />
worsening “cloudy” or “rainy” day. This can be seen typically as a rising or falling bar on many simple solution weather stations.<br />
It can be interpreted as an increase/decrease gradient for the user to interpret, but the time interval is not used extensively to<br />
reach weather predictions. The user can look at the results for a 12 hour time frame to predict the weather trend.<br />
This table is typically used:<br />
Analysis<br />
Output<br />
dP > +0.25 kPa<br />
Sun Symbol<br />
-0.25 kPa < dP < 0.25 kPa Sun/Cloud Symbol<br />
dP < -0.25 kPa<br />
Rain Symbol<br />
Another approach that is more direct <strong>and</strong> quicker in calculating the weather in the simple approach is to know the current<br />
altitude. This cuts the need to wait <strong>and</strong> see a “trend”.<br />
By <strong>using</strong> the equation below:<br />
–h<br />
-----------------<br />
7990m<br />
ph = p0 ⋅ e<br />
Where p0 = 101.3 kPa, <strong>and</strong> h is the current altitude, the pressure for the local barometric can be calculated. This is the<br />
pressure for good sunny weather at current altitude location.<br />
By <strong>using</strong> the pressure equation <strong>and</strong> knowing the normalized good weather pressure for the current location (best for a static<br />
weather station), the weather can be deduced by the difference. As in the table for the weather symbols, the ideal pressure is<br />
compared to the value from the MPL115A <strong>and</strong> the appropriate symbol of Sun/Cloud/Rain is selected.<br />
Below simple C code from the DEMOAPEXSENSOR demo kit calculates which weather symbol to display on the LCD screen.<br />
• CurrentAltitude - (m) Altitude in meters that is entered into the system by the user for that current static location.<br />
• Pweather - (kPa) Pressure at the current altitude. It is calculated <strong>using</strong> the Height (m) to Pressure (kPa) exponential<br />
equation, inputting CurrentAltitude in meters. This is the ideal pressure for the current location on a stable relatively<br />
sunny day.<br />
• decPcomp - (kPa) Value of compensated pressure from MPL115A.<br />
<strong>AN3914</strong><br />
Sensors<br />
<strong>Freescale</strong> Semiconductor 6
Simple Weather Station Code<br />
///////////////////////<br />
//SIMPLE WEATHER SECTION<br />
///////////////////////<br />
Pweather = (101.3 * exp(((float)(CurrentAltitude))/(-7900)));<br />
Simpleweatherdiff = decPcomp-Pweather;<br />
if (Simpleweatherdiff >0.25)<br />
Simpleweatherstatus = 0; //Sun Symbol<br />
if ((Simpleweatherdiff =(-0.25)))<br />
Simpleweatherstatus = 1; //Sun/Cloud Symbol<br />
if (Simpleweatherdiff
Advanced Version of Weather Station<br />
A more complex approach is to measure the P/t <strong>and</strong> see how the gradient is changing over time. As in the simple approach,<br />
this does need to be kept in a static location during measurement. Essentially as time progresses, the weather can be broken<br />
into more exact categories than the simple approach of basic symbols.<br />
This can also use less time than waiting for a full 12 hours to see the pattern of pressure change. In Table 4, the ranges of<br />
pressure change over time leading to the definition of the weather patterns is shown. It is a change in the pressure per one hour.<br />
2-3 hours are needed to deduce how the pressure is migrating.<br />
Table 4. Advanced Weather Determination<br />
dP/dt > 0.25 kPa/h<br />
Analysis<br />
Output<br />
Quickly rising High Pressure <strong>System</strong>, not stable<br />
0.05 kPa/h < dP/dt < 0.25 kPa/h Slowly rising High Pressure <strong>System</strong>, stable good weather<br />
-0.05 kPa/h < dP/dt < 0.05 kPa/h Stable weather condition<br />
-0.25 kPa/h < dP/dt < -0.05 kPa/h Slowly falling Low Pressure <strong>System</strong>, stable rainy weather<br />
dP/dt < -0.25 kPa/h<br />
Quickly falling Low Pressure, Thunderstorm, not stable<br />
In the provided source code, the pressure is sampled every minute for 3 hours/180 minutes into a data array. The first 5<br />
minutes are averaged, followed by 5 minutes near the first ½ hour point. Consecutive ½ hour marks have 5 minute averaged<br />
data-points stored. This leads to 7 averaged results over the 180 minutes depicting the pressure every ½ hour. Once the datapoints<br />
are collected, the patterns are deduced. A flowchart provides the method used in deducing the weather pattern. The initial<br />
starting point is the reference from which every ½ hour data point is compared to. As the pressure falls, the value is compared<br />
<strong>and</strong> divided so that the change in pressure per 1 hour is compared every half an hour.<br />
Data Example with Calculation for a Basic 3 Hour Run<br />
Data Analysis<br />
Beginning End<br />
Time<br />
(min)<br />
Current<br />
Average Value<br />
(counts)<br />
(Current Value<br />
- Initial Value)<br />
Multiplier to return<br />
to dP/dt for 1 hour<br />
Value Multiplied by<br />
(65 kPa/1023 counts) = dP/dt for 1 hour<br />
Designated<br />
Weather Pattern<br />
0 740<br />
Initial Value*<br />
0 0 0 Too early, wait a little<br />
longer.<br />
30 739.6 -0.2 x2 = -0.4 -0.4 x 0.0635 = -0.0254 Stable Weather<br />
60 739 -1 ÷ = -1 -1 x 0.0635 = -0.0635<br />
90 738 -2 ÷1.5 = -1.33 -1.33 x 0.0635 = -0.0844<br />
120 737 -3 ÷2 = -1.5 -1.5 x 0.0635 = -0.0953<br />
150 736 -4 ÷2.5 = -1.6 = -0.102<br />
Long Term Low<br />
Pressure Rain/Cloudy<br />
180 736.4 -3.6 ÷3 = -1.2 = -0.0762<br />
*The Initial Value is going to be reset to the value at 2 hours or 120 min = 737 counts <strong>and</strong> then the cycle is repeated again.<br />
<strong>AN3914</strong><br />
Sensors<br />
<strong>Freescale</strong> Semiconductor 8
Algorithm Code for Advanced Weather Station<br />
if (!Tmr2ms8b_weather)<br />
{<br />
//Minutes: Number of minutes that have elapsed.<br />
//dP_dt[]: Array to store current compensated Pressure siPcomp. Stores new value every 1 min, 180 min or 3 hours of current weather.<br />
//If more than 3 hours is stored, it goes back to storing in array cell [0].<br />
//weather_cntr: counter variable for weather dP_dt[] array.<br />
Minutes = Minutes +1;<br />
PTGD_PTGD3 ^= 1; //D1 RED LED<br />
if (weather_cntr > 180)<br />
weather_cntr =6;<br />
WeatherPressArray[weather_cntr] =siPcomp;<br />
weather_cntr = weather_cntr++;<br />
if (weather_cntr ==5){<br />
//Avg pressure in first 5 min, value averaged from 0 to 5 min.<br />
Pressure_1st_5min = ((WeatherPressArray[1]+WeatherPressArray[2]+WeatherPressArray[3]+WeatherPressArray[4]+WeatherPressArray[5])/5);<br />
}<br />
if (weather_cntr ==35){<br />
//Avg pressure in 30 min, value averaged from 0 to 5 min.<br />
Pressure_2nd_30min = ((WeatherPressArray[30]+WeatherPressArray[31]+WeatherPressArray[32]+WeatherPressArray[33]+WeatherPressArray[34])/5);<br />
Weather_change = (Pressure_2nd_30min - Pressure_1st_5min);<br />
if(pressure_second_round_flag ==0)<br />
dP_dt = ((65.0/1023.0)*2*Weather_change);<br />
//first time initial 3 hour<br />
//note this is for t = 0.5hour<br />
if(pressure_second_round_flag ==1) //more than inital 3 hour.<br />
dP_dt = (((65.0/1023.0)*Weather_change)/1.5); //divide by 1.5 as this is the difference in time from 0 value.<br />
}<br />
if (weather_cntr ==60){<br />
//Avg pressure at end of the hour, value averaged from 0 to 5 min.<br />
Pressure_3rd_55min = ((WeatherPressArray[55]+WeatherPressArray[56]+WeatherPressArray[57]+WeatherPressArray[58]+WeatherPressArray[59])/5);<br />
Weather_change = (Pressure_3rd_55min - Pressure_1st_5min);<br />
if(pressure_second_round_flag ==0) //first time initial 3 hour<br />
dP_dt = ((65.0/1023.0)*Weather_change); //note this is for t = 1 hour<br />
if(pressure_second_round_flag ==1) //more than initial 3 hour.<br />
dP_dt = (((65.0/1023.0)*Weather_change)/2); //divide by 2 as this is the difference in time from 0 value<br />
}<br />
if (weather_cntr ==95){<br />
//Avg pressure at end of the hour, value averaged from 0 to 5 min.<br />
Pressure_4th_90min = ((WeatherPressArray[90]+WeatherPressArray[91]+WeatherPressArray[92]+WeatherPressArray[93]+WeatherPressArray[94])/5);<br />
Weather_change = (Pressure_4th_90min - Pressure_1st_5min);<br />
if(pressure_second_round_flag ==0) //first time initial 3 hour<br />
dP_dt = (((65.0/1023.0)*Weather_change)/1.5); //note this is for t = 1.5 hour<br />
if(pressure_second_round_flag ==1) //more than initial 3 hour.<br />
dP_dt = (((65.0/1023.0)*Weather_change)/2.5); //divide by 2.5 as this is the difference in time from 0 value<br />
}<br />
<strong>AN3914</strong><br />
Sensors<br />
<strong>Freescale</strong> Semiconductor 9
if (weather_cntr ==120){<br />
//Avg pressure at end of the hour, value averaged from 0 to 5 min.<br />
Pressure_5th_115min = ((WeatherPressArray[115]+WeatherPressArray[116]+WeatherPressArray[117]+WeatherPressArray[118]+WeatherPressArray[119])/5);<br />
Weather_change = (Pressure_5th_115min - Pressure_1st_5min);<br />
if(pressure_second_round_flag ==0) //first time initial 3 hour<br />
dP_dt = (((65.0/1023.0)*Weather_change)/2); //note this is for t = 2 hour<br />
if(pressure_second_round_flag ==1) //more than initial 3 hour.<br />
dP_dt = (((65.0/1023.0)*Weather_change)/3); //divide by 3 as this is the difference in time from 0 value<br />
}<br />
if (weather_cntr ==155){<br />
//Avg pressure at end of the hour, value averaged from 0 to 5 min.<br />
Pressure_6th_150min = ((WeatherPressArray[150]+WeatherPressArray[151]+WeatherPressArray[152]+WeatherPressArray[153]+WeatherPressArray[154])/5);<br />
Weather_change = (Pressure_6th_150min - Pressure_1st_5min);<br />
if(pressure_second_round_flag ==0) //first time initial 3 hour<br />
dP_dt = (((65.0/1023.0)*Weather_change)/2.5); //note this is for t = 2.5 hour<br />
if(pressure_second_round_flag ==1) //more than initial 3 hour.<br />
dP_dt = (((65.0/1023.0)*Weather_change)/3.5); //divide by 3.5 as this is the difference in time from 0 value<br />
}<br />
if (weather_cntr ==180){<br />
//Avg pressure at end of the hour, value averaged from 0 to 5 min.<br />
Pressure_7th_180min = ((WeatherPressArray[175]+WeatherPressArray[176]+WeatherPressArray[177]+WeatherPressArray[178]+WeatherPressArray[179])/5);<br />
Weather_change = (Pressure_7th_180min - Pressure_1st_5min);<br />
if(pressure_second_round_flag ==0) //first time initial 3 hour<br />
dP_dt = (((65.0/1023.0)*Weather_change)/3); //note this is for t = 3 hour<br />
if(pressure_second_round_flag ==1) //more than initial 3 hour.<br />
dP_dt = (((65.0/1023.0)*Weather_change)/4); //divide by 4 as this is the difference in time from 0 value<br />
Pressure_1st_5min = Pressure_6th_150min; //Equating the pressure at 0 to the pressure at 2 hour after 3 hours have past.<br />
pressure_second_round_flag =1; // flag to let you know that this is on the past 3 hour mark. Initialized to 0 outside main loop.<br />
}<br />
if ((dP_dt > (-0.05)) && (dP_dt 0.05) && (dP_dt (-0.25)) && (dP_dt 0.25)<br />
weatherstatus = 3; // Quickly rising HP, not stable weather<br />
if (dP_dt < (-0.25))<br />
weatherstatus = 4; // Quickly falling LP, Thunderstorm, not stable<br />
//if ((weather_cntr
Display Code to Output to LCD Screen:<br />
//ADVANCED DP/Dt SECTION<br />
if (weatherstatus == 0){<br />
sprintf(LCDArray, "Stable Weather Patt ");<br />
LCD_WR (LCDArray,LR3+0);<br />
sprintf(LCDArray, " ");<br />
LCD_WR (LCDArray,LR1+8);<br />
}<br />
if (weatherstatus == 1){<br />
sprintf(LCDArray, "Slowly rising Good Weather");<br />
LCD_WR (LCDArray,LR3+0);<br />
sprintf(LCDArray, "Clear/Sunny ");<br />
LCD_WR (LCDArray,LR1+8);<br />
}<br />
if (weatherstatus == 2){<br />
sprintf(LCDArray, "Slowly falling L-Pressure ");<br />
LCD_WR (LCDArray,LR3+0);<br />
sprintf(LCDArray, "Cloudy/Rain ");<br />
LCD_WR (LCDArray,LR1+8);<br />
}<br />
if (weatherstatus == 3){<br />
sprintf(LCDArray, "Quickly rising H-Press");<br />
LCD_WR (LCDArray,LR3+0);<br />
sprintf(LCDArray, "Not Stable");<br />
LCD_WR (LCDArray,LR1+8);<br />
}<br />
if (weatherstatus == 4){<br />
sprintf(LCDArray, "Quickly falling L-Press");<br />
LCD_WR (LCDArray,LR3+0);<br />
sprintf(LCDArray, "Thunderstorm");<br />
LCD_WR (LCDArray,LR1+8);<br />
}<br />
if (weatherstatus == 5){<br />
sprintf(LCDArray, "Unknown (More Time) ");<br />
LCD_WR (LCDArray,LR3+0);<br />
sprintf(LCDArray, " ");<br />
LCD_WR (LCDArray,LR1+8);<br />
}<br />
<strong>AN3914</strong><br />
Sensors<br />
<strong>Freescale</strong> Semiconductor 11
Create Array to hold 180 Pressure Values (3 hours)<br />
Pressure Average of 1st Round<br />
(5 results averaged in Array, 1 Hz)<br />
@ t = 0 min<br />
Pressure Average of 2 nd Round<br />
(5 results averaged in Array, 1 Hz)<br />
@ t = 30 min<br />
Pressure Average of 3 rd Round<br />
(5 results averaged in Array, 1 Hz)<br />
@ t = 60 min<br />
Compare 2 nd Avg to 1 st Avg.<br />
1 st Round:<br />
Too early to determine weather pattern.<br />
2 nd <strong>and</strong> Above Round:<br />
Pressure at 1 st is from previous 150 min<br />
data point. Data not overwritten.<br />
First comparison at 2 nd Average, t = 30 min.<br />
1 st Round:<br />
Determine weather change for 0 to 30 min<br />
(multiply by 2 for 1 hour change).<br />
2 nd <strong>and</strong> Above Round:<br />
Determine weather change for 0 to 30 min<br />
(divide by 1.5 for 1.5 hour change).<br />
Pressure Average of 4 th Round<br />
(5 results averaged in Array, 1 Hz)<br />
@ t = 90 min<br />
Compare 3 rd Avg to 1 st Avg.<br />
1 st Round:<br />
Determine weather change for 0 to 60 min<br />
(divide by 1 for 1 hour change).<br />
2 nd <strong>and</strong> Above Round:<br />
Determine weather change for 0 to 60 min<br />
(divide by 2 for 2 hour change).<br />
Pressure Average of 5 th Round<br />
(5 results averaged in Array, 1 Hz)<br />
@ t = 120 min<br />
Compare 4 th Avg to 1 st Avg.<br />
1 st Round:<br />
Determine weather change for 0 to 90 min<br />
(divide by 1.5 for 1.5 hour change).<br />
2 nd <strong>and</strong> Above Round:<br />
Determine weather change for 0 to 90 min<br />
(divide by 2.5 for 2.5 hour change).<br />
Compare to<br />
chart to see<br />
average change<br />
over 1 hour <strong>and</strong><br />
the corresponding<br />
weather pattern.<br />
Pressure Average of 6 th Round<br />
(5 results averaged in Array, 1 Hz)<br />
@ t = 150 min<br />
Compare 5 th Avg to 1 st Avg.<br />
1 st Round:<br />
Determine weather change for 0 to 120 min<br />
(divide by 2 for 2 hour change).<br />
2 nd Round <strong>and</strong> Above Round:<br />
Determine weather change for 0 to 120 min<br />
(divide by 3 for 3 hour change).<br />
Display dP/dt<br />
<strong>and</strong><br />
weather pattern<br />
seen on display.<br />
Pressure Average of 7 th Round<br />
(5 results averaged in Array, 1 Hz)<br />
@ t = 180 min<br />
Compare 6 th Avg to 1 st Avg.<br />
1 st Round:<br />
Determine weather change for 0 to 150 min<br />
(divide by 2.5 for 2.5 hour change).<br />
2 nd Round <strong>and</strong> Above Round:<br />
Determine weather change for 0 to 150 min<br />
(divide by 3.5 for 3.5 hour change).<br />
Loop continuously<br />
Compare 7 th Avg to 1 st Avg.<br />
1 st Round:<br />
Determine weather change for 0 to 150 min<br />
(divide by 2.5 for 2.5 hour change).<br />
2 nd Round <strong>and</strong> Above Round:<br />
Determine weather change for 0 to 150 min<br />
(divide by 3.5 for 3.5 hour change).<br />
Figure 2. Advanced Weather Flowchart<br />
<strong>AN3914</strong><br />
Sensors<br />
<strong>Freescale</strong> Semiconductor 12
APPENDIX<br />
Table 5. Worldwide Altitudes<br />
City<br />
Feet (ft)<br />
Altitude<br />
Meters (m)<br />
City<br />
Feet (ft)<br />
Altitude<br />
Meters (m)<br />
Abu Dubai, UAE 33 10<br />
Accra, Ghana 98 30<br />
Algiers, Algeria 328 100<br />
Amman, Jordan 2297 700<br />
Amsterdam, Netherl<strong>and</strong>s 0 0<br />
Ankara, Turkey 2923 891<br />
Athens, Greece 328 100<br />
Atlanta, Georgia 983 300<br />
Baghdad, Iraq 98 30<br />
Bangkok, Thail<strong>and</strong> 26 8<br />
Belgrade, Serbia 453 138<br />
Berlin, Germany 164 50<br />
Bern, Switzerl<strong>and</strong> 1640 500<br />
Bogota, Colombia 8727 2660<br />
Bonn, Germany 262 80<br />
Boston, Massachusetts 20 6<br />
Brasilia, Brazil 2297 700<br />
Brussels, Belgium 230 70<br />
Bucharest, Romania 230 70<br />
Budapest, Hungary 656 200<br />
Buenos Aires, Argentina 82 25<br />
Cairo, Egypt 164 50<br />
Canberra, Australia 2297 700<br />
Caracas, Venezuela 3419 1042<br />
Charlotte, North Carolina 721 220<br />
Chicago, Illinois 596 182<br />
Colombo, Sri Lanka 23 7<br />
Copenhagen, Denmark 66 20<br />
Dar es Salaam, Tanzania 230 70<br />
Darwin, Australia 98 30<br />
Denver, Colorado 5184 1580<br />
Doha, Qatar 66 20<br />
Dublin, Irel<strong>and</strong> 164 50<br />
Haifa, Israel 328 100<br />
Harare, Zimbabwe 3937 1200<br />
Havana, Cuba 98 30<br />
Helsinki, Finl<strong>and</strong> 66 20<br />
Hong Kong, China 108 33<br />
Jakarta, Indonesia 98 30<br />
Jerusalem, Israel 2694 821<br />
Kabul, Afghanistan 5902 1799<br />
Karachi, Pakistan 13 4<br />
Khartoum, Sudan 1280 390<br />
Kinshasa, Congo 984 300<br />
Kuala Lumpur, Malaysia 492 150<br />
Kuwait City, Kuwait 66 20<br />
La Paz, Bolivia 10499 3200<br />
Lagos, Nigeria 98 30<br />
Lima, Peru 420 128<br />
Lisbon, Portugal 312 95<br />
London, United Kingdom 157 48<br />
Los Angles, California 371 113<br />
Lusaka, Zambia 3937 1200<br />
Luxembourg 984 300<br />
Madrid, Spain 2297 700<br />
Manama, Bahrain 66 20<br />
Manila, Philippines 46 14<br />
Mexico City, Mexico 7411 2259<br />
Miami, Florida 82 25<br />
Montevideo, Uruguay 131 40<br />
Moscow, Russia 548 167<br />
Nairobi, Kenya 4921 1500<br />
Nassau, Bahamas 98 30<br />
New Delhi, India 715 218<br />
New York, New York 315 96<br />
Oslo, Norway 394 120<br />
<strong>AN3914</strong><br />
Sensors<br />
<strong>Freescale</strong> Semiconductor 13
City<br />
Feet (ft)<br />
Altitude<br />
Meters (m)<br />
Ottawa, Canada 236 72<br />
Paris, France 262 80<br />
Beijing, China 125 38<br />
Prague, Czech Republic 984 300<br />
Pretoria, South Africa 4265 1300<br />
Quito, Ecuador 9186 2800<br />
Rabat, Morocco 98 30<br />
Reykjavik, Icel<strong>and</strong> 98 30<br />
Riyadh, Saudi Arabia 1969 600<br />
Rome, Italy 377 115<br />
Salt Lake City, Utah 4330 1320<br />
Santiago, Chile 1703 519<br />
Seoul, South Korea 197 60<br />
Singapore 16 5<br />
Sofia, Bulgaria 2461 750<br />
Stockholm, Sweden 98 30<br />
Taipei, Taiwan 197 60<br />
Tehran, Iran 3999 1219<br />
Tel Aviv, Israel 114 34<br />
Tokyo, Japan 69 21<br />
Tunis, Tunisia 131 40<br />
Vienna, Austria 656 200<br />
Warsaw, Pol<strong>and</strong> 230 70<br />
Wellington, New Zeal<strong>and</strong> 10 3<br />
<strong>AN3914</strong><br />
Sensors<br />
<strong>Freescale</strong> Semiconductor 14
How to Reach Us:<br />
Home Page:<br />
www.freescale.com<br />
Web Support:<br />
http://www.freescale.com/support<br />
USA/Europe or Locations Not Listed:<br />
<strong>Freescale</strong> Semiconductor, Inc.<br />
Technical Information Center, EL516<br />
2100 East Elliot Road<br />
Tempe, Arizona 85284<br />
1-800-521-6274 or +1-480-768-2130<br />
www.freescale.com/support<br />
Europe, Middle East, <strong>and</strong> Africa:<br />
<strong>Freescale</strong> Halbleiter Deutschl<strong>and</strong> GmbH<br />
Technical Information Center<br />
Schatzbogen 7<br />
81829 Muenchen, Germany<br />
+44 1296 380 456 (English)<br />
+46 8 52200080 (English)<br />
+49 89 92103 559 (German)<br />
+33 1 69 35 48 48 (French)<br />
www.freescale.com/support<br />
Japan:<br />
<strong>Freescale</strong> Semiconductor Japan Ltd.<br />
Headquarters<br />
ARCO Tower 15F<br />
1-8-1, Shimo-Meguro, Meguro-ku,<br />
Tokyo 153-0064<br />
Japan<br />
0120 191014 or +81 3 5437 9125<br />
support.japan@freescale.com<br />
Asia/Pacific:<br />
<strong>Freescale</strong> Semiconductor China Ltd.<br />
Exchange Building 23F<br />
No. 118 Jianguo Road<br />
Chaoyang District<br />
Beijing 100022<br />
China<br />
+86 010 5879 8000<br />
support.asia@freescale.com<br />
For Literature Requests Only:<br />
<strong>Freescale</strong> Semiconductor Literature Distribution Center<br />
1-800-441-2447 or +1-303-675-2140<br />
Fax: +1-303-675-2150<br />
LDCFor<strong>Freescale</strong>Semiconductor@hibbertgroup.com<br />
Information in this document is provided solely to enable system <strong>and</strong> software<br />
implementers to use <strong>Freescale</strong> Semiconductor products. There are no express or<br />
implied copyright licenses granted hereunder to design or fabricate any integrated<br />
circuits or integrated circuits based on the information in this document.<br />
<strong>Freescale</strong> Semiconductor reserves the right to make changes without further notice to<br />
any products herein. <strong>Freescale</strong> Semiconductor makes no warranty, representation or<br />
guarantee regarding the suitability of its products for any particular purpose, nor does<br />
<strong>Freescale</strong> Semiconductor assume any liability arising out of the application or use of any<br />
product or circuit, <strong>and</strong> specifically disclaims any <strong>and</strong> all liability, including without<br />
limitation consequential or incidental damages. “Typical” parameters that may be<br />
provided in <strong>Freescale</strong> Semiconductor data sheets <strong>and</strong>/or specifications can <strong>and</strong> do vary<br />
in different applications <strong>and</strong> actual performance may vary over time. All operating<br />
parameters, including “Typicals”, must be validated for each customer application by<br />
customer’s technical experts. <strong>Freescale</strong> Semiconductor does not convey any license<br />
under its patent rights nor the rights of others. <strong>Freescale</strong> Semiconductor products are<br />
not designed, intended, or authorized for use as components in systems intended for<br />
surgical implant into the body, or other applications intended to support or sustain life,<br />
or for any other application in which the failure of the <strong>Freescale</strong> Semiconductor product<br />
could create a situation where personal injury or death may occur. Should Buyer<br />
purchase or use <strong>Freescale</strong> Semiconductor products for any such unintended or<br />
unauthorized application, Buyer shall indemnify <strong>and</strong> hold <strong>Freescale</strong> Semiconductor <strong>and</strong><br />
its officers, employees, subsidiaries, affiliates, <strong>and</strong> distributors harmless against all<br />
claims, costs, damages, <strong>and</strong> expenses, <strong>and</strong> reasonable attorney fees arising out of,<br />
directly or indirectly, any claim of personal injury or death associated with such<br />
unintended or unauthorized use, even if such claim alleges that <strong>Freescale</strong><br />
Semiconductor was negligent regarding the design or manufacture of the part.<br />
<strong>Freescale</strong> <strong>and</strong> the <strong>Freescale</strong> logo are trademarks of <strong>Freescale</strong> Semiconductor, Inc.<br />
All other product or service names are the property of their respective owners.<br />
© <strong>Freescale</strong> Semiconductor, Inc. 2009. All rights reserved.<br />
<strong>AN3914</strong><br />
Rev. 0<br />
7/2009