AN3914, Modern Altimeter and Barometer System using ... - Freescale
AN3914, Modern Altimeter and Barometer System using ... - Freescale
AN3914, Modern Altimeter and Barometer System using ... - Freescale

Create successful ePaper yourself
Turn your PDF publications into a flip-book with our unique Google optimized e-Paper software.
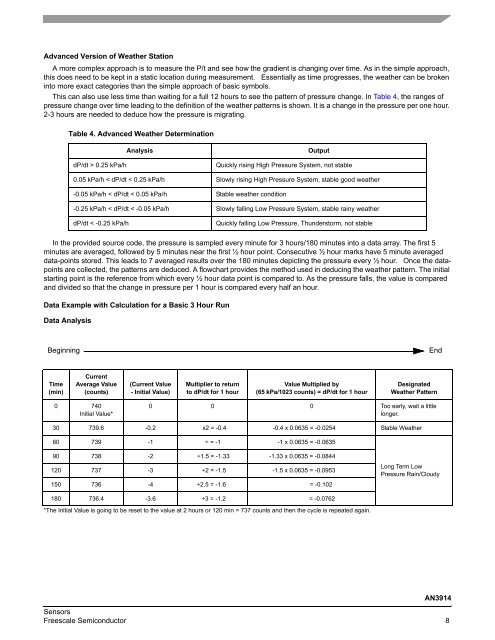
Advanced Version of Weather Station<br />
A more complex approach is to measure the P/t <strong>and</strong> see how the gradient is changing over time. As in the simple approach,<br />
this does need to be kept in a static location during measurement. Essentially as time progresses, the weather can be broken<br />
into more exact categories than the simple approach of basic symbols.<br />
This can also use less time than waiting for a full 12 hours to see the pattern of pressure change. In Table 4, the ranges of<br />
pressure change over time leading to the definition of the weather patterns is shown. It is a change in the pressure per one hour.<br />
2-3 hours are needed to deduce how the pressure is migrating.<br />
Table 4. Advanced Weather Determination<br />
dP/dt > 0.25 kPa/h<br />
Analysis<br />
Output<br />
Quickly rising High Pressure <strong>System</strong>, not stable<br />
0.05 kPa/h < dP/dt < 0.25 kPa/h Slowly rising High Pressure <strong>System</strong>, stable good weather<br />
-0.05 kPa/h < dP/dt < 0.05 kPa/h Stable weather condition<br />
-0.25 kPa/h < dP/dt < -0.05 kPa/h Slowly falling Low Pressure <strong>System</strong>, stable rainy weather<br />
dP/dt < -0.25 kPa/h<br />
Quickly falling Low Pressure, Thunderstorm, not stable<br />
In the provided source code, the pressure is sampled every minute for 3 hours/180 minutes into a data array. The first 5<br />
minutes are averaged, followed by 5 minutes near the first ½ hour point. Consecutive ½ hour marks have 5 minute averaged<br />
data-points stored. This leads to 7 averaged results over the 180 minutes depicting the pressure every ½ hour. Once the datapoints<br />
are collected, the patterns are deduced. A flowchart provides the method used in deducing the weather pattern. The initial<br />
starting point is the reference from which every ½ hour data point is compared to. As the pressure falls, the value is compared<br />
<strong>and</strong> divided so that the change in pressure per 1 hour is compared every half an hour.<br />
Data Example with Calculation for a Basic 3 Hour Run<br />
Data Analysis<br />
Beginning End<br />
Time<br />
(min)<br />
Current<br />
Average Value<br />
(counts)<br />
(Current Value<br />
- Initial Value)<br />
Multiplier to return<br />
to dP/dt for 1 hour<br />
Value Multiplied by<br />
(65 kPa/1023 counts) = dP/dt for 1 hour<br />
Designated<br />
Weather Pattern<br />
0 740<br />
Initial Value*<br />
0 0 0 Too early, wait a little<br />
longer.<br />
30 739.6 -0.2 x2 = -0.4 -0.4 x 0.0635 = -0.0254 Stable Weather<br />
60 739 -1 ÷ = -1 -1 x 0.0635 = -0.0635<br />
90 738 -2 ÷1.5 = -1.33 -1.33 x 0.0635 = -0.0844<br />
120 737 -3 ÷2 = -1.5 -1.5 x 0.0635 = -0.0953<br />
150 736 -4 ÷2.5 = -1.6 = -0.102<br />
Long Term Low<br />
Pressure Rain/Cloudy<br />
180 736.4 -3.6 ÷3 = -1.2 = -0.0762<br />
*The Initial Value is going to be reset to the value at 2 hours or 120 min = 737 counts <strong>and</strong> then the cycle is repeated again.<br />
<strong>AN3914</strong><br />
Sensors<br />
<strong>Freescale</strong> Semiconductor 8