AN3914, Modern Altimeter and Barometer System using ... - Freescale
AN3914, Modern Altimeter and Barometer System using ... - Freescale
AN3914, Modern Altimeter and Barometer System using ... - Freescale

Create successful ePaper yourself
Turn your PDF publications into a flip-book with our unique Google optimized e-Paper software.
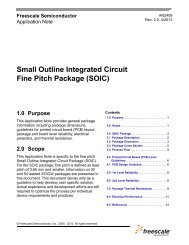
Pressure Change Altitude Change (m) ADC Change (counts) (meters/count)<br />
50 kPa to 49.85 kPa -24 2.36 10<br />
70 kPa to 69.85 kPa -17.1 2.36 7.2<br />
90 kPa to 89.85 kPa -13.3 2.36 5.6<br />
101 kPa to 101.15 kPa 11.9 2.36 5<br />
The MPL115A has a specification of a 0.15 kPa Resolution. While searching online for the current barometric pressure, the<br />
correct pressure may not be found. Most airports <strong>and</strong> cities have their current barometric pressure listed for weather conditions.<br />
In order to determine weather patterns, the current barometric conditions are often normalized with sea level. This removes<br />
altitude variation from the readings. So if the weather is clear, it may be listed as 101.3 kPa, but in actuality it may be 92 kPa.<br />
Please keep this in consideration when looking up the local altitude in kPa.<br />
WEATHER<br />
The MPL115A is an absolute device that can be used to predict <strong>and</strong> measure the barometric pressure to deduce weather<br />
patterns. Weather prediction requires a static location for the sensor <strong>and</strong> 2-3 hours to analyze a full weather pattern. Typically the<br />
pressure changes due to weather are slow, requiring a few hours to determine the sloping of the pressure change. Vertical<br />
movement or a significant airflow can interfere with results due to only weather patterns in barometric pressure. The sensor<br />
should be kept in a relatively protected area from any strong air flows, <strong>and</strong> kept at that static location during analysis. Temperature<br />
effects can change the results of a normal pressure sensor especially if the measurement is done over several hours in varying<br />
temperature. Due to the nature of the calibration <strong>and</strong> temperature compensation, MPL115A meets these requirements,<br />
compensating for temperature swings over a large 0 to 85°C operating range. It will not require auto-zeroing for shifts in offset or<br />
span over temperature.<br />
How Pressure Increases <strong>and</strong> Decreases with Weather<br />
For weather pattern prediction, the MPL115A is a well suited device with its pressure range <strong>and</strong> resolution. Barometric<br />
pressure changes can directly correlate to changes in the weather. Low pressure is typically seen as the precursor to worsening<br />
weather. High pressure increases can be interpreted as improving or clear weather. The typical reasoning can be seen in a<br />
comparison of molecular weights. If air is approximately 21% O 2 (g), 78% N 2 (g), O 2 (g) has a molecular mass of 32, N 2 (g) has a<br />
mass of 28. H 2 O (g) has a molecular mass of 18. So if there is a large amount of water vapor present in air, this air is going to<br />
be lighter than just regular dry air by itself. It’s an interesting fact that explains how weather patterns lead to high or low pressure.<br />
If bad weather originates in an area in the formation of water-vapor clouds, this is falling pressure on a barometer. The vapor<br />
will reduce the barometric pressure as the H 2 O reduces the mass above that point on the earth. High pressure will signal the<br />
clearing of the water vapor as the air dries.<br />
Another qu<strong>and</strong>ary is how weather during severe hurricanes/cyclones with high 150 mph winds be defined as low pressure?<br />
This is due to the fact that hurricanes are low pressure conditions surrounded by higher pressure. The rush of air from higher to<br />
low pressure creates the fast moving winds. The lower the pressure in the center, the greater differential pressure between high<br />
<strong>and</strong> low areas. This leads to a stronger cyclone or hurricane.<br />
Some areas are harder to predict weather patterns. Cities located at the base of mountainous regions where condensation<br />
<strong>and</strong> fog are a daily occurrence is an example. An area like Hawaii where high colder mountains meet low warm sea regions can<br />
have harder to predict results. A network of sensors can give a more exact trend, but for a single sensor in a static location, there<br />
are a few ways to have a simple st<strong>and</strong>alone weather station.<br />
Local Weather Stations<br />
When implementing a weather station, it is best to will check results with a local forecast. When researching local weather<br />
pressures, such as barometric pressure at the closest airport, remember that the weather is normalized for altitude. Normalization<br />
takes local barometric pressure <strong>and</strong> shifts it to reflect sea level altitude. Sea Level is 101.3 kPa, <strong>and</strong> by normalizing various points<br />
on a map, a meteorologist can see the weather pattern over a region. Without the normalization, the effect of altitude on the<br />
pressure reported by collection points will lead to useless data. A mountain data point will have pressure affected by altitude <strong>and</strong><br />
as it leads to the valleys, the pressure point there will be higher, telling nothing about the weather without the normalization.<br />
<strong>AN3914</strong><br />
Sensors<br />
<strong>Freescale</strong> Semiconductor 5