PRESENTATION OF THE GORENJE GROUP
PRESENTATION OF THE GORENJE GROUP
PRESENTATION OF THE GORENJE GROUP

Create successful ePaper yourself
Turn your PDF publications into a flip-book with our unique Google optimized e-Paper software.
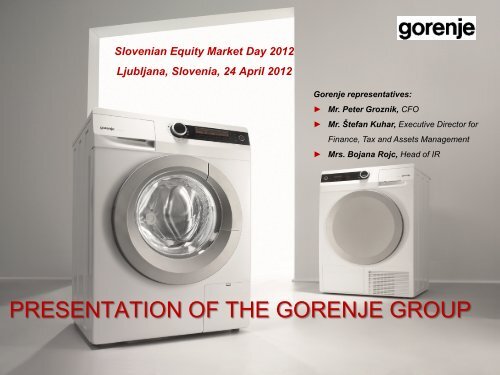
Slovenian Equity Market Day 2012<br />
Ljubljana, Slovenia, 24 April 2012<br />
Gorenje representatives:<br />
► Mr. Peter Groznik, CFO<br />
► Mr. Štefan Kuhar, Executive Director for<br />
Finance, Tax and Assets Management<br />
► Mrs. Bojana Rojc, Head of IR<br />
1<br />
<strong>PRESENTATION</strong> <strong>OF</strong> <strong>THE</strong> <strong>GORENJE</strong> <strong>GROUP</strong>
One of the leading European manufacturers of products for home<br />
Core business<br />
• Products and services for Home (MDA, SDA, HVAC, kitchen<br />
furniture)<br />
Gorenje Group<br />
• Main company Gorenje, d.d., and 102 Companies (79<br />
International)<br />
Number of employees<br />
• 10.932 / 2011<br />
Consolidated revenue<br />
• 1.4 bn EUR / 2011<br />
2<br />
Global presence<br />
• 70 Countries Worldwide, mostly in Europe, USA, Australia,<br />
Near and Far East<br />
Own production<br />
• Slovenia, Sweden, Czech Rep., Serbia, Finland<br />
Export<br />
• 95% of sales<br />
Legend:<br />
MDA (major domestic appliances)<br />
SDA (small domestic appliances)<br />
HVAC (heating, ventilation, air conditioning)
Only the very best from Gorenje … already 62 years!<br />
1950-1960<br />
1961-1970<br />
1971-1980<br />
► 1950 founded in the village of Gorenje<br />
► 1958 manufacturing stoves<br />
► Production of washing machines and refrigerators<br />
► 1961 first exports to Germany<br />
► Acquisition of companies with synergy to the core business<br />
► Setting-up own distribution network in Western Europe<br />
1981-1990 ► Major Focus on core business - household appliances<br />
1991-1996<br />
1997-2005<br />
2006-2007<br />
2008 - 2009<br />
2010<br />
2011<br />
► Restructuring and ownership transformation<br />
► Strong expansion into foreign markets<br />
► Gorenje, d.d., becomes a Public Company<br />
► Investing into new products and technology<br />
► Strategicaly Gorenje has infused new life into its business doctrine familiarly known as: "Everything for Home“<br />
► Acquisition of Mora Moravia, the cooking appliance manufacturer from the Czech Republic<br />
► Opening of the new refrigerator & freezer Plant in Valjevo, Serbia<br />
► New design of product lines Gorenje Pininfarina II; Gorenje Swarovski; Gorenje Ora-Ïto<br />
► Acquisition of Gorenje Surovina, d.d., Maribor, Slovenia<br />
► 15% capital increase and additional shares were listed on a prime market of Ljubljana Stock Exchange<br />
► New design of product lines Gorenje Pininfarina Black and Gorenje Ora-Ïto White<br />
► Acquisition of the company ATAG<br />
► New generation of cooking appliances;Innovative fridge freezer “Gorenje for iPod“<br />
► Gorenje designed by Karim Rashid; Gorenje Retro Collection; Gorenje Simplicity<br />
► Acquisition of the company ASKO<br />
► Entering IFC, member of the World Bank into the ownership structure<br />
► Launching of the new brand name Gorenje+<br />
► Start-up of the factory in Zaječar, Srbia<br />
► Confirmation of the new strategy 2015<br />
3
Public limited company since 1998<br />
Ten major shareholders No. of shares %<br />
KAPITALSKA DRUŽBA, D.D. 3,534,615 22.2207%<br />
Employees<br />
and former<br />
employees<br />
5.18%<br />
Private<br />
Individuals<br />
17.22%<br />
Treasury<br />
Stock<br />
0.76%<br />
Pension<br />
Fund<br />
22.91%<br />
IFC 1,876,876 11.7991%<br />
HOME PRODUCTS EUROPE B.V. 1,070,000 6.7267%<br />
NFD 1, delniški podsklad 820,045 5.1553%<br />
INGOR, d.o.o., & co. k.d. 794,473 4.9945%<br />
EECF AG 411,727 2.5884%<br />
RAIFFEISEN BANK AUSTRIA D.D. 375,889 2.3631%<br />
TRIGLAV VZAJEMNI SKLADI 297,090 1.8677%<br />
PROBANKA, d.d. 297,061 1.8675%<br />
4<br />
Financial<br />
Investors<br />
53.93%<br />
ERSTE <strong>GROUP</strong> BANK AG 222,204 1.3969%<br />
Top 10 Shareholders 9,699,980 60.9798%<br />
Other Shareholders 6,206,896 39.0202%<br />
Total* 15,906,876 100%<br />
<br />
<br />
<br />
Two-tier Corporate Governance System<br />
Supervisory Board: 6 Representatives of capital and 4 Representatives of employees<br />
Management Board: 6 Members<br />
121,311 Own Shares (0.7626%)<br />
<br />
Slovenian Corporate Governance Code<br />
*Ownership structure on 31 December 2011
With the new strategy changes to the Group organization<br />
Previous Gorenje Group organization: three divisions:<br />
HOME APPLIANCES<br />
HOME INTERIOR<br />
ECOLOGY, ENERGY,<br />
AND SERVICES<br />
1 - REFRIGERATION APPLIANCES (COLD APP.)<br />
2 - COOKING APPLIANCES (HOT APP.)<br />
3 - WASHING MACHINES, DRYERS, DISHWASHERS<br />
(WET APP.)<br />
COMPLEMENTARY PRODUCTS<br />
SUPPLEMENTARY PRODUCTS<br />
Water heaters, radiators, and air conditioners<br />
Kitchens<br />
Other furniture<br />
Ceramics<br />
Bathrooms<br />
Ecology<br />
Energy<br />
Tools and industrial<br />
equipment<br />
Trade<br />
Engineering<br />
Brokerage<br />
Tourism<br />
5<br />
Change in the new organization:<br />
Changes in the new<br />
organization:<br />
Changes in the new<br />
organization:<br />
A wide product range – major domestic appliances, small<br />
domesticappliances, HVAC, services<br />
.<br />
Gorenje's core activity is manufacturing HOME products; in 2015, it<br />
will represent approximately 90% of total operations.<br />
• Focus on kitchen<br />
furniture<br />
• Preparing a new<br />
business model<br />
• field of ENERGY divested<br />
• further development of the<br />
field of ECOLOGY<br />
• SERVICES seen as portfolio<br />
investments.
Greater focus on core activities until 2015<br />
► The main activity amounted to 77% of revenues in 2011.<br />
► The growth of core activities to 90% of revenues by 2015.<br />
CORE ACTIVITY SUPPLEMENTARY PORTFOLIO INVESTMENTS<br />
HOME<br />
Products and services for the home<br />
ECOLOGY<br />
Ecology-related services<br />
O<strong>THE</strong>R<br />
6<br />
MDA (major domestic appliances)<br />
SDA (small domestic appliances)<br />
HVAC (heating, ventilation, air conditioning)<br />
SERVICES related to the home<br />
KITCHEN<br />
FURNITURE<br />
Comprehensive<br />
waste management<br />
Tool-making<br />
Engineering<br />
Hotels and hospitality<br />
services<br />
Trade<br />
Design services<br />
KEY ORIENTATION<br />
SUPPORT<br />
role
New strategy, new vision<br />
VISION<br />
TO BECOME WORLD BEST<br />
DESIGN DRIVEN INNOVATOR<br />
<strong>OF</strong> HOME PRODUCTS<br />
MISSION<br />
TO CREATE INNOVATIVE, DESIGN-DRIVEN PRODUCTS AND<br />
SERVICES THAT BRING SIMPLICITY TO OUR USERS.<br />
7<br />
AMBITION CREATIVITY RESPONSIBILITY HONESTY SIMPLICITY<br />
FUNDAMENTAL VALUES
Strategic goals - Home<br />
► Price index 29 European Countries increase for 2 p.p. per year till 2015 – MDA 8;<br />
► Target structure by markets in 2015 WE / EE /GLOBAL: 45 / 45 / 10; in 2010* (46 / 47 / 7)<br />
►<br />
Strengthening of position on new markets active presence (sales office) in 15 megacities<br />
► Share of concepts in Gorenje brand 25% (volume) till 2015<br />
► Product complexity reduction for 30% till 2013<br />
► Growth of SDA for 2 p.p. in structure till 2015<br />
► Growth of HVAC for 1.5 p.p. in structure till 2015<br />
8<br />
►<br />
New businesses up to 1% 2015 in HOME structure<br />
► Growth of Kitchen furniture from 11.5 MEUR 2010 to 23.5 MEUR 2015<br />
►<br />
Use of Gorenje Group Synergies<br />
WE…Western Europe<br />
EE…Eastern Europe<br />
GLOBAL…outside Europe
Why to focus to built in<br />
Freestanding business will be more and more<br />
competitive and less and less profitable –<br />
especially for Gorenje since we can not have<br />
same economy of scale and real LCC<br />
production<br />
Build-in business still driven by local habits<br />
and still less competitive<br />
HIGH DEBT means LOWER POWER to<br />
INVEST means NEED to FOCUS<br />
9<br />
BI in Gorenje Group has strong BI platforms<br />
innovative BI OVENS and HOBS, strong BI cooling<br />
platform, strong hoods platforms<br />
Currently BI categories in GorenjeGroup (hobs,<br />
hoods, ovens) – most profitable categories
Product portfolio strategies - MAKE or BUY<br />
Premium: existing / new premium platforms or buy<br />
Assure efficient<br />
make or buy<br />
process in order to<br />
assure<br />
competitiveness of<br />
the product range<br />
for all brands<br />
(in order to assure long-term competitiveness in premium<br />
segment we need to have own unique solutions/platforms)<br />
Mid+: existing platforms with added innovative features<br />
Mid: existing platforms or buy (with co-development)<br />
Budget: old generations or buy (off the shelve)<br />
CONCEPT: mid and mid+ platforms (make or buy)<br />
All MAKE or BUY decisions will be evaluated based on<br />
following criteria:<br />
1. Target cost needed<br />
2. Platform differentiation between budget, mid, premium<br />
segment<br />
3. Production utilization<br />
10
Multi-brand strategy to cover all price segments<br />
BUILT-IN<br />
PREMIUM<br />
SPECIALIST<br />
BUILT-IN<br />
SPECIALIST<br />
PREMIUM<br />
MID+<br />
WET PREMIUM<br />
SPECIALIST<br />
BUILT-IN<br />
LOCAL<br />
SPECIALIST<br />
CONCEPTS<br />
MID<br />
11<br />
MAINSTREAM<br />
LOWER<br />
(BUDGET)<br />
SEGMENT<br />
BUDGET<br />
FREE<br />
STANDING<br />
LOCAL<br />
BUILT-IN (FREE<br />
STANDING) LOCAL<br />
LOWER<br />
(BUDGET)<br />
SEGMENT<br />
FOR BENELUX
Strategy by brands – Brand profiles<br />
Gorenje Group will serve all (price) segments of the market with multi-brand strategy<br />
Full range of premium BI selective expansion to<br />
WE, 2014 EE, high-end KRT<br />
NEW focus: premium WET, other products<br />
supportive role , selective expansion EE, global<br />
Full range of mid+ BI products, introduced<br />
D,A,CZ,SLO,UA,RU;SCAN, new markets 2013<br />
KRT specialist,<br />
12<br />
Main pan-European brand in portfolio, strong<br />
focus to Concepts, focus growth in mainstream<br />
(focus to BI segment, reducing cost in FS,<br />
implementing selective design driven<br />
innovations, reduction of complexity), develop<br />
sales of accessories<br />
Budget platforms, protective brand for SEE<br />
Adjusted product portfolio, brands will be<br />
developed&supported only if they can perform<br />
long-term sustainable profit
Europe domestic market, strengthening global presence till 2015<br />
11% market share in Finland<br />
10% market share in Denmark<br />
9% market share in Norway<br />
6% market share in Sweden<br />
Top 1 foreign brand in Germany<br />
7 % market share in Russia<br />
4% of the Group<br />
revenue comes<br />
from USA &<br />
Australia<br />
Leading brand<br />
in Slovenia & on<br />
the Balkan<br />
In Hong Kong luxury<br />
residential towers<br />
furnished with designer<br />
appliances<br />
13<br />
5% market share in the<br />
segment of dishwashers<br />
in Australia<br />
► Sales in 70 markets around the world: Europe = traditional domestic market, the USA,<br />
Australia, China, Middle East
Strategy markets<br />
RU<br />
NORDIC<br />
USA<br />
AUS<br />
ASKO<br />
P<br />
SLO<br />
CZ<br />
BIH<br />
UA<br />
RS<br />
GLOBAL<br />
MEGA<br />
CITIES<br />
<strong>GORENJE</strong><br />
UA<br />
ASIA<br />
14<br />
RU<br />
I<br />
BENELUX<br />
ATAG<br />
F<br />
UK<br />
STRONG RESOURCES MID RESOURCES LOW RESOURCES<br />
Focus resources to markets with strong position (&profitability) or to markets that<br />
represent strategic priorities
The difference is built on design and innovation<br />
15
Awards for design, innovations and brand recognition<br />
Design:<br />
• BIO Design Award, 1979, 1996, 2002, 2006, 2008<br />
• DIDA - Delo Industrial Design Award, 1997<br />
• Plus X Award TM , 2004 - 2011<br />
• Red Dot Design Award, 2005, 2010, 2011<br />
• The Design Awards, 2006, 2010<br />
• Timeless Slovenian design 2011 for Simple&Logical<br />
• Design 2011 (The Month of Design)<br />
• Good Industrial Design Award 2010, 2011<br />
• Golden Link Award, 2006, 2008<br />
• Observeur Design 08 Award, 2007<br />
• Wallpaper nomination, 2008<br />
Innovation:<br />
• SCC Innovation Award, 2003 - 2009, 2010, 2011<br />
• Formatool Award, 2005, 2007, 2011<br />
• Hevreka!06 Award, 2006<br />
• Get Connected Product of the Year Award, 2006, 2010, 2011<br />
• Le Grand Prix de l'Innovation nomination, 2007<br />
• Podium de l'Innovation inomination, 2008<br />
• Grüner Stecker prize, 2010<br />
16<br />
Brand name:<br />
• Trend Award, 2005<br />
• Success Story Award, 2005<br />
• Superbrands, 2006, 2007<br />
• Trusted Brand, 2007, 2008, 2009, 2010, 2011<br />
• Eurobrand, 2007, 2008, 2009<br />
• SiBrand 2011<br />
• China Home Style Award, 2008
Awards for product excellence<br />
Oven with the innovative electronic control module - the world revolution in the management of<br />
household appliances<br />
17
Awards for product excellence<br />
Hob designer line Magna – Atag brand<br />
18<br />
3 Classic Line Dishwasher - Asko brand
Awards for product excellence<br />
Washing machine from Gorenje RedSet line<br />
19
Awards for product excellence<br />
Gorenje SensoCARE washing machine and Gorenje IQcook cooking hob<br />
20
Sales Structure of Major Domestic Appliances in Europe 2011 – MDA ( 9 Product Groups)<br />
EUROPE (Market)<br />
~63.7 m units<br />
-1.3%<br />
WEST EUROPE (Market)<br />
~87% (share of total market sales)<br />
-3.2%<br />
Belgium; 2%<br />
3% Austria ;<br />
Netherlan<br />
2%<br />
ds; 3%<br />
Poland;<br />
5%<br />
Skandinav<br />
ia*; 6%<br />
2% Others,<br />
7%<br />
2%<br />
Germany;<br />
19%<br />
France;<br />
15%<br />
Ohranjanje tržnih<br />
deležev Gorenja<br />
EAST EUROPE (Market)<br />
~22% (share of total market sales)<br />
+5.7%<br />
21<br />
<strong>GORENJE</strong> (West Europe)*<br />
~ 43%<br />
-3.0%<br />
Spain;<br />
6%<br />
Russia ;<br />
10%<br />
UK;<br />
10%<br />
Italy;<br />
11%<br />
<strong>GORENJE</strong> (East Europe)<br />
~ 57%<br />
-8.2%<br />
<br />
CECED Figures do not include sales of groups Atag & Asko<br />
MDA9 (Refrigerators, Freezers, Dishwashers, Washing Machines, Dryers, Freestanding Cookers, Built-in Ovens, Hobs, Hoods)<br />
wo. Microwave Ovens<br />
Members: BSH, Candy, Electrolux, Fagor -Brandt, Gorenje, Indesit, Liebherr, Whirlpool, Miele, Smeg<br />
Source: CECED
Benchmarking<br />
Competition in the home appliances industry worsened results compared to 2010<br />
Electrolux<br />
Whirlpool<br />
Indesit<br />
Arcelik<br />
Gorenje<br />
Sales: -4.4%<br />
(to 11,263 M €)<br />
EBIT: -44.4%<br />
(to 335 M €)<br />
Negative FCF<br />
(to -721 M €)<br />
Sales: +1.6%<br />
(to 13,417 M €)<br />
EBIT: -21.4%<br />
(to 569 M €)<br />
Negative FCF<br />
(to -40 M €)<br />
Sales: -1.8%<br />
(to 2,825 M €)<br />
EBIT: -18.2%<br />
(to 150 M €)<br />
Negative FCF<br />
(to -39 M €)<br />
Sales: +21.6%<br />
(to 3,624 M €)<br />
EBIT: +1.3%<br />
(to 278 M €)<br />
Negative FCF<br />
(to -60 M €)<br />
Sales: +2.9%<br />
(to 1,422 M €)<br />
EBIT: -15.3%<br />
(to 37 M €)<br />
Positive FCF<br />
(to +36 M €)<br />
Strong drop of<br />
EBIT and PDT,<br />
acquisition of<br />
Olympic Group<br />
and CTI,<br />
Adaptation of<br />
production<br />
capacity,<br />
Reduction of<br />
overhead costs.<br />
Strong drop of<br />
FCF, Aggressive<br />
actions taken to<br />
reduce fixed cost<br />
structure<br />
(N.America<br />
achieves 2X EBIT<br />
improvement,<br />
Significantly lower<br />
inventory levels).<br />
The negative<br />
effects of material<br />
costs and lower<br />
volume of<br />
demand on<br />
profitability, a<br />
negative FCF.<br />
Strong growth in<br />
sales, negative<br />
FCF, takeover<br />
Defy Appliances.<br />
Lower reduction<br />
in profitability<br />
regard to<br />
competition and<br />
positive FCF.<br />
22<br />
▼ Significant deterioration in the results compared with 2010, negative trend continued in Q4 2011<br />
▼<br />
▼<br />
All analyzed companies, except of Gorenje, have a negative FCF<br />
Adjustment of structural (fix) costs to the scale and structure of business activities.
Business performance 2011: Highlights<br />
in EUR million 2011 2010 2009 2008<br />
comparable<br />
2011 2010<br />
Change<br />
(%)<br />
Consolidated revenue 1,422.2 1,382.2 1,185.9 1,330.8 1,288.1 1,221.8 5.4%<br />
EBITDA 86.7 108.7 68.2 94.0 85.4 91.4 -6.6%<br />
EBITDA Margin, % 6.1% 7.9% 5.8% 7.1% 6.6% 7.5% /<br />
EBIT 36.5 56.4 12.1 36.9 41.1 41.9 -1.9%<br />
EBIT Margin, % 2.6% 4.1% 1.0% 2.8% 3.2% 3.4% /<br />
Profit before tax 11.1 22.5 -9.3 15.5 15.1 8.0 88.8%<br />
Net income 9.1 20.0 -12.2 10.2 11.3 4.9 130.6%<br />
ROS, % 0.6% 1.4% -1.0% 0.8% 0.9% 0.4% /<br />
Free cash flow (narrow)* 35.8 17.8 33.0 -45.1 18.4 7.2 154.7%<br />
Net financial debt** 382.5 401.2 425.1 463.7 388.5 377.6 2.9%<br />
Net financial debt / EBITDA 4.4 3.7 6.2 4.9 4.5 4.1 10.1%<br />
Earnings per share (in EUR) 0.57 1.34 -0.83 0.66 0.71 0.32 119.5%<br />
23<br />
* Profit after tax + depreciation and amortization expense – CAPEX + divestment –+ change in inventories –+ allowances for trade receivables –+ change in trade payables<br />
** Long-term financial liabilities + short-term financial liabilities – cash and cash equivalents
BUSINESS PERFORMANCE 2011: Events that affect the comparability of data<br />
Effect of the elimination of the Asko Group and disposal of Istrabenz Gorenje on the profitability of the Gorenje Group<br />
in MEUR 2011 2010<br />
comparable<br />
Q4 Q4<br />
Q4 Q4<br />
2011 2010 2011 2010<br />
2011 2010<br />
Revenue 1,422.2 1,382.2 362.1 416.4 1,288.1 1,221.8 331.9 323.2<br />
= Contribution margin (CM1) / gross<br />
margin<br />
534,2 525.4 133.3 144.0 464.7 491.1 118.2 122.9<br />
CM 1 37.6% 38.0% 36.8% 34.6% 36.1% 40.2% 35.6% 38.0%<br />
= Added value / AV 352.6 353.1 92.8 94.4 309.8 316.8 85.9 80.3<br />
AV in revenue 24.8% 25.5% 25.6% 22.7% 24.1% 25.9% 25.9% 24.8%<br />
= EBITDA 86.7 108.7 24.6 25.3 85.4 91.4 28.1 22.5<br />
EBITDA margin 6.1% 7.9% 6.8% 6.1% 6.6% 7.5% 8.5% 7.0%<br />
= EBIT 36.5 56.4 13.1 12,0 41.1 41.9 18.0 10.9<br />
EBIT margin 2.6% 4.1% 3.6% 2.9% 3.2% 3.4% 5.4% 3.4%<br />
= Profit for the period 9.1 20.0 1.3 3.2 11.3 4.9 3.1 1.5<br />
ROS 0.6% 1.4% 0.4% 0.8% 0.9% 0.4% 0.9% 0.5%<br />
24<br />
in MEUR 2011 2010<br />
comparable<br />
2010<br />
NET ASSETS 735.0 740.0 718.4<br />
Net current assets 470.5 463.0 451.6<br />
Net working capital 264.5 277.0 266.8<br />
Working capital 551.4 623.6 590.8<br />
- Current liabilities -286.9 -346.6 -324.0<br />
NET EQUITY INVESTED 735.0 740.0 718.4<br />
Equity 397.8 392.1 385.1<br />
Net debt equity 337.2 347.9 333.3<br />
Effect of disposal of Istrabenz Gorenje on the<br />
financial position of the Gorenje Group
Business Plan 2012: Goals<br />
Goal:<br />
STRENG<strong>THE</strong>NING <strong>THE</strong> PR<strong>OF</strong>ITABILITY – CASH FLOW GROWTH - REDUCING DEBT<br />
through the realization of the model of<br />
BUSINESS EXCELLENCE.<br />
►<br />
►<br />
Improving sales and diversifying geographically and product range;<br />
►<br />
Launching new products;<br />
Decreasing inventories and receivables - increasing free cash flow;<br />
►<br />
►<br />
►<br />
►<br />
Factoring and other activities to improve capital structure;<br />
Optimizing material costs, faster purchasing from LCC;<br />
Restructuring of Asko Group, HI Division, Trade companies;<br />
Restructuring of production companies, transfers of production<br />
►<br />
►<br />
Divesting of some real estate;<br />
►<br />
Reducing headcount;<br />
Exploring new listing locations;<br />
► Implementing new Strategy 2015.<br />
25
Business Plan 2012 – Highlights / Gorenje Group (1)<br />
MEUR B 2012<br />
Change<br />
vs. 2011<br />
Change<br />
vs. 2011<br />
comparable<br />
2011<br />
2011<br />
comparable<br />
Sales 1,391.4 -2.2% 5.6% 1,422.2 1,317.4 1,382.2<br />
CM 585.6 9.6% 10.4% 534.2 530.5 525.4<br />
% CM 42.1% / / 37.6% 40.3% 38.0%<br />
EBITDA 101.3 16.8% 17.6% 86.7 86.2 108.7<br />
2010<br />
% from sales 7.3% / / 6.1% 6.5% 7.9%<br />
EBIT 50.0 36.8% 37.1% 36.5 36.4 56.4<br />
26<br />
% from sales 3.6% / / 2.6% 2.8% 4.1%<br />
PBT 15.9 43.4% 60.9% 11.1 9.9 22.5<br />
% from sales 1.1% / / 0.8% 0.8% 1.6%<br />
PAT 13.4 47.2% 66.3% 9.1 8.1 20.0<br />
% from sales 1.0% / / 0.6% 0.6% 1.4%<br />
• B – Budget<br />
• CM - Contribution margin at the level of difference between sales<br />
revenue and costs of goods and material<br />
Comparable: In the base year 2011 are, to achieve comparability, eliminated the effects of sales Istrabenz Gorenje
Business Plan 2012 – Highlights / Gorenje Group (2)<br />
MEUR B 2012<br />
Change<br />
vs. 2011<br />
2011<br />
Change<br />
vs. 2010<br />
2010<br />
FCF / narrow 28.6 / 35.8 / 17.8<br />
Net debt 380.3 -0.6% 382.5 -4.7% 401.2<br />
27<br />
Net debt / EBITDA 3.8 -14.9% 4.4 19.5% 3.7<br />
Legend:<br />
FCF Narrow = NCF – Capex + Disinvestment +- Changes in Net Working Capital<br />
Net debt = Financial debt – Cash and Cash Equivalents<br />
Net debt / EBITDA = Net financial debt / EBITDA
Business Plan 2012: Sales by region in MEUR<br />
Region B 2012<br />
2011<br />
comparable<br />
Change<br />
W Europe 559.8 (40%) 520.7 (40%) +7.5%<br />
E/SE Europe 718.2 (52%) 701.7 (53%) +2.4%<br />
Other 113.4 (8%) 95.0 (7%) +19.4%<br />
28<br />
Total sales 1,391.4 1,317.4 +5.6%<br />
Comparable: In the year 2011 are, to achieve comparability, eliminated the effects of sales Istrabenz Gorenje
Business Plan 2012: Sales performance in MEUR<br />
Sales<br />
Group<br />
1,422.2<br />
-2.2% +5.6%<br />
1,317.4<br />
1,391.4<br />
2011 2011 comparable B 2012<br />
29<br />
13.9%<br />
1,202.4<br />
Sales<br />
HA<br />
1,055.8 1,055.8<br />
2011 2011 comparable B 2012<br />
B2012<br />
Business<br />
Segment<br />
Home<br />
As % of<br />
Group sales<br />
74.2% 80.1%<br />
86.4%<br />
Comparable: In the year 2011 are, to achieve comparability, eliminated the effects of sales Istrabenz Gorenje
Business Plan 2012: EBIT performance<br />
EBIT<br />
Margin<br />
2.6%<br />
2.8%<br />
3.6%<br />
+36.8% +37.1%<br />
EBIT<br />
(MEUR)<br />
36.5 36.4<br />
50.0<br />
30<br />
2011 2011 comparable B 2012<br />
Comparable: In the year 2011 are, to achieve comparability, eliminated the effects of sales Istrabenz Gorenje
Business Plan 2012 – EBITDA performance<br />
7.3%<br />
EBITDA<br />
Margin<br />
6.5%<br />
6.1%<br />
+16.8% +17.6%<br />
101.3<br />
EBITDA<br />
(MEUR)<br />
86.7 86.2<br />
31<br />
2011 2011 comparable B 2012<br />
Comparable: In the year 2011 are, to achieve comparability, eliminated the effects of sales Istrabenz Gorenje
Business Plan 2012 – PAT performance<br />
1.0%<br />
ROS<br />
0.6% 0.6%<br />
PAT<br />
(MEUR)<br />
9.1 8.1<br />
+47.2% +66.3%<br />
13.4<br />
32<br />
2011 2011 comparable B 2012<br />
Comparable: In the year 2011 are, to achieve comparability, eliminated the effects of sales Istrabenz Gorenje
Business Plan 2012 – FCF (narrow) performance<br />
MEUR B 2012 2011 2010<br />
PAT 13.4 9.1 20.0<br />
Amortization 51.3 50.2 52.2<br />
= NCF 64.7 59.3 72.3<br />
Capex -47.6 -47.5 -44.7<br />
Divestment 19.7 4.4 4.5<br />
NWC -8.2 19.6 -14.2<br />
* Inventories 8.6 12.0 -6.0<br />
* Trade receivables -11.8 50.4 -25.3<br />
* Trade payables -5.0 -42.8 17.1<br />
= FCF (Narrow) 28.6 35.8 17.8<br />
33<br />
Effects of CF optimization in 2011 to 2010:<br />
‒ Net cash flow by -12.9 MEUR / -17.9%<br />
− Capex by -2.8 MEUR / +6.3%<br />
− Divestment by -0.1 MEUR / -2.2%<br />
+ Inventories by +18.0 MEUR<br />
+ Trade receivables by +75.7 MEUR<br />
‒ Trade payables by +59.9 MEUR<br />
Effects of CF optimization in B2012 to 2011:<br />
+ Net cash flow by +5.4 MEUR / +9.1%<br />
‒ Capex by -0.1 MEUR / +0.2%<br />
+ Divestment by +15.3 MEUR<br />
− Inventories by -3.4 MEUR / -28.3%<br />
− Trade receivables by -62.2 MEUR<br />
+ Trade payables by +37.8 MEUR
Business Plan 2012 – Consolidated Balance Sheet<br />
MEUR 2010 2011 B2012 MEUR 2010 2011 B2012<br />
Net non-current<br />
assets<br />
463.0 470.5 438.9 Equity 392.1 397.8 409.3<br />
Inventories 257.6 245.6 240.1 Financial<br />
investments<br />
as % in sales 18.6% 17.3% 17.3%<br />
-53.3 -45.3 -48.9<br />
Trade receivables 306.3 255.9 281.1 Cash and cash<br />
equivalents<br />
as % in sales 22.2% 18.0% 20.2%<br />
-82.7 -101.6 -23.5<br />
34<br />
Trade payables -237.0 -194.2 -180.4 Financial liabilities<br />
total<br />
as % in sales 17.1% 13.7% 13.0%<br />
Net Working Capital 326.9 307.3 340.8<br />
as % in sales 23.6% 21.6% 24.5%<br />
Other current assets /<br />
liabilities<br />
-49.9 -42.8 -39.0<br />
483.9 484.1 403.8<br />
Net Debt 347.9 337.2 331.4<br />
Net Assets 740.0 735.0 740.7<br />
Net Invested<br />
Capital<br />
740.0 735.0 740.7
Strategic plan 2015: Why a new strategy<br />
►<br />
Changes in the environment<br />
• Due to the unstable economic environment stirred by the global financial<br />
crisis, the operating conditions have changed drastically relative to the time<br />
of announcement of the previous strategic plan (early 2010).<br />
►<br />
Changes at the Gorenje Group<br />
• In August 2010, the Group acquired the Asko Group – a Swedish home<br />
appliance manufacturer.<br />
35<br />
• In 2011, intensive activities were launched for divestment of non-core<br />
property and activities (disposal of interest in the company Istrabenz-<br />
Gorenje, divestments in France, Serbia etc.).<br />
►<br />
Adjustment to the requirements of effective management<br />
• Taking a medium-term view of the Gorenje Group operating performance.
Strategic plan 2015: Measures to adjust to the new circumstances<br />
1. Increase robustness to the effects financial crises<br />
►<br />
►<br />
►<br />
►<br />
Profitable increase in volume of business operations<br />
Short-term generation of value: increase in free cash flow<br />
Long-term generation of value: improvement in economic profit / EVA<br />
Debt management: improving the capacity of self-financing, divestment of noncore<br />
assets and activities, diversification of financing sources → possibility of<br />
listing the share in an international stock exchange.<br />
36<br />
2. Seizing the opportunities in the core industry<br />
►<br />
►<br />
►<br />
►<br />
►<br />
Simplifying/streamlining the operations – new organization.<br />
Looking for market niches (both in terms of geographical distribution and<br />
products)<br />
Even more focus on design and innovation<br />
Multi-brand strategy to cover all price segments<br />
A shift from pan-European to global presence, especially with niche products.
Strategic plan 2015: New Gorenje Group Business Model<br />
FOCUS<br />
HOME<br />
DIFFERENTIATION<br />
THROUGH DESIGN<br />
INNOVATION<br />
GLOBALIZATION<br />
STRATEGIC<br />
ALLIANCES<br />
R&D, SALES,<br />
PRODUCTION<br />
INTERNATIONAL<br />
DRIVEN<br />
PERMANENT<br />
CREATION <strong>OF</strong> VALUE<br />
FOR <strong>THE</strong> CUSTOMERS,<br />
SHAREHOLDERS, AND<br />
EMPLOYEES<br />
BRAND/<br />
PRODUCT<br />
PORTFOLIO<br />
37<br />
RESEARCH AND<br />
DEVELOPMENT<br />
NICHE<br />
MANAGEMENT<br />
INDUSTRIAL<br />
KNOW-HOW<br />
DESIGN<br />
SCOPE<br />
&<br />
FLEXIBILITY<br />
CULTURE<br />
OPERATIONAL EXCELLENCE
Strategic plan 2015: Gorenje Group key strategic goals<br />
Profitability of<br />
operating volume<br />
Creating value,<br />
short term<br />
FCF (narrow) at least<br />
EUR 40 million,<br />
in 2015<br />
Turnover (sales<br />
revenue)<br />
> EUR 1.5 billion in<br />
2015<br />
(CAGR 3.8 %)*<br />
Share of brands/<br />
concepts in the<br />
premium price<br />
segment<br />
over 25% in 2015<br />
Creating value,<br />
long term<br />
EBIT above 5% in<br />
2015<br />
MAJOR<br />
STRATEGIC GOALS<br />
Turnover (sales<br />
revenue) beyond<br />
Europe<br />
more than EUR 150<br />
million<br />
in 2015<br />
38<br />
Debt<br />
management<br />
Net debt/EBITDA<br />
not more than 3.0<br />
from 2014 on<br />
* Base year 2011 (eliminated effect of<br />
Istrabenz-Gorenje divestment)<br />
New business model,<br />
organizational<br />
structure/human<br />
resource management,<br />
and corporate<br />
governance<br />
Core activity<br />
shall represent<br />
approximately 90%<br />
in 2015<br />
Financial/business goals<br />
Markets/marketing goals<br />
Business platforms
Strategic plan 2015: Specific goal s by 2015<br />
1<br />
Higher<br />
volume of<br />
operations<br />
2<br />
Improved<br />
profitability<br />
3<br />
Improving<br />
robustness to<br />
financial<br />
crisis<br />
39<br />
• Sales<br />
͌ 1.5 bn €<br />
3.5% CAGR<br />
> 5.0%<br />
• EBIT Margin<br />
• Net debt /<br />
EBITDA<br />
max. 3.0
Strategy without implementation is an illusion and therefore …<br />
►<br />
Annual update of the strategy.<br />
►<br />
The Management Board shall monitor<br />
strategy implementation on a monthly<br />
basis:<br />
►<br />
KPI, key strategic goals<br />
►<br />
Key implementation projects<br />
40<br />
►<br />
The Management Board shall report at<br />
each Supervisory Board session<br />
about the strategy implementation<br />
activities.<br />
STRATEGIC<br />
PLANNING<br />
►<br />
Annual review and adjustment of<br />
strategy – once per year, to be<br />
performed by the Strategic Business<br />
Council.
Factors affecting forward-looking statements<br />
This Presentation contains “forward-looking” statements and information – that is, statements related to future, not<br />
past, events, within the meaning of the Securities Market Act and the Rules and Regulations of the Ljubljana Stock<br />
Exchange. These statements may be identified by words such as “expects,” “looks forward to,” “anticipates,”<br />
“intends,” “plans,” “believes,” “seeks,” “estimates,” “will,” “project” or words of similar meaning. Such statements<br />
include, among others, the financial goals and targets of parent company Gorenje, d.d., and Gorenje Group for<br />
future periods and future business and financial plans. These statements are based on current expectations and<br />
are subject to risks and uncertainties that could cause actual results to differ materially due to a variety of factors. A<br />
variety of factors, many of which are beyond Gorenje's control, affect Gorenje’s operations, performance, business<br />
strategy and results and could cause the actual results, performance or achievements of Gorenje to be materially<br />
different from any future results, performance or achievements that may be expressed or implied by such forwardlooking<br />
statements. These factors include, but may not be limited to the following: consumer demand and market<br />
conditions in the geographical areas and industries in which Gorenje Group operates, effects of currency<br />
fluctuations, competitive pressures to reduce prices, significant loss of business from major retailers, the possibility<br />
that customers may delay the conversion of booked orders into revenue or that prices will decline as a result of<br />
continued adverse market conditions to a greater extent than currently anticipated by Gorenje's management, the<br />
success in developing new products and marketing initiatives, developments in product liability litigation, progress in<br />
achieving operational and capital efficiency goals, the success in identifying growth opportunities and acquisition<br />
candidates and the integration of these opportunities with existing businesses, continued volatility and a further<br />
deterioration of the capital markets, progress in achieving structural and supply-chain reorganization goals. Should<br />
one or more of these risks or uncertainties materialize, or should underlying assumptions prove incorrect, actual<br />
results may vary materially from those described in the relevant forward-looking statement as expected, anticipated,<br />
intended, planned, believed, sought, estimated or projected. Gorenje does not intend or assume any obligation to<br />
update or revise these forward-looking statements in light of developments which differ from those anticipated.<br />
41