Communicating Clearly with Charts and Graphs - Governor
Communicating Clearly with Charts and Graphs - Governor
Communicating Clearly with Charts and Graphs - Governor

You also want an ePaper? Increase the reach of your titles
YUMPU automatically turns print PDFs into web optimized ePapers that Google loves.
Part IV. Practical tips > E. Optional things to clean up<br />
Further ways to reduce noise or focus on the message:<br />
Change tick marks - I like them to point inward, toward the data,<br />
not outward like little saw teeth. Some folks eliminate them.<br />
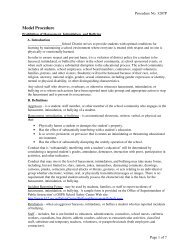
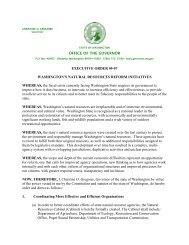
1. Highlight value axis (note black squares):<br />
Unneeded digits on the value (y) axis - Some scales have too<br />
many data points, too many decimals, or too many zeros.<br />
For all these<br />
1. Highlight the Value axis ( = y axis)<br />
2. Right-mouse-button click<br />
3 Choose "Format Axis . . ." menu<br />
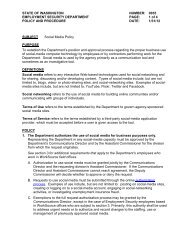
To change Tick marks:<br />
Patterns tab<br />
"Major tick mark type" - choose "Inside", or “None”<br />
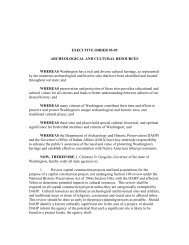
2. Right-mouse-button click to see menu:<br />
To clean up excess decimals in numbers:<br />
Number tab<br />
Choose "Number" or "Currency"<br />
Set Decimal places = 0<br />
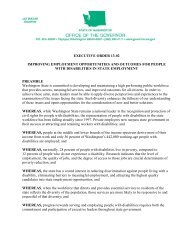
To change the scale:<br />
Scale tab<br />
Change the "Minimum" amount<br />
Change the "Major unit" amount<br />
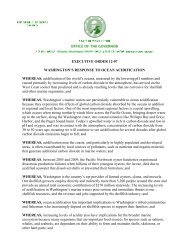
3. Pick the tab dealing <strong>with</strong> what you want:<br />
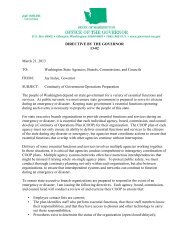
To clean up excess zeros in values:<br />
Scale tab<br />
"Display Units" box<br />
Select the one you want (hundreds, thous<strong>and</strong>s, millions, etc)<br />
The axis label will automatically change ("In Millions")<br />
<strong>Communicating</strong> <strong>with</strong> charts 20