offshore grids for wind power integration - Greenpeace
offshore grids for wind power integration - Greenpeace
offshore grids for wind power integration - Greenpeace

You also want an ePaper? Increase the reach of your titles
YUMPU automatically turns print PDFs into web optimized ePapers that Google loves.
GLOBAL ENERGY [R]EVOLUTION<br />
A NORTH SEA ELECTRICITY GRID [R]EVOLUTION<br />
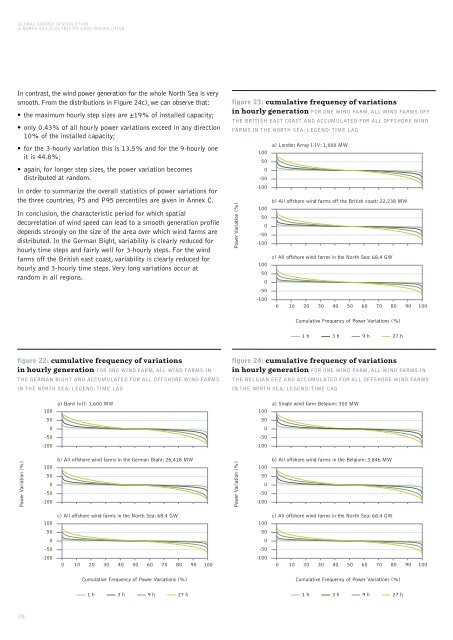
In contrast, the <strong>wind</strong> <strong>power</strong> generation <strong>for</strong> the whole North Sea is very<br />
smooth. From the distributions in Figure 24c), we can observe that:<br />
• the maximum hourly step sizes are ±19% of installed capacity;<br />
• only 0.43% of all hourly <strong>power</strong> variations exceed in any direction<br />
10% of the installed capacity;<br />
• <strong>for</strong> the 3-hourly variation this is 13.5% and <strong>for</strong> the 9-hourly one<br />
it is 44.8%;<br />
• again, <strong>for</strong> longer step sizes, the <strong>power</strong> variation becomes<br />
distributed at random.<br />
In order to summarize the overall statistics of <strong>power</strong> variations <strong>for</strong><br />
the three countries, P5 and P95 percentiles are given in Annex C.<br />
In conclusion, the characteristic period <strong>for</strong> which spatial<br />
decorrelation of <strong>wind</strong> speed can lead to a smooth generation profile<br />
depends strongly on the size of the area over which <strong>wind</strong> farms are<br />
distributed. In the German Bight, variability is clearly reduced <strong>for</strong><br />
hourly time steps and fairly well <strong>for</strong> 3-hourly steps. For the <strong>wind</strong><br />
farms off the British east coast, variability is clearly reduced <strong>for</strong><br />
hourly and 3-hourly time steps. Very long variations occur at<br />
random in all regions.<br />
figure 23: cumulative frequency of variations<br />
in hourly generation FOR ONE WIND FARM, ALL WIND FARMS OFF<br />
THE BRITISH EAST COAST AND ACCUMULATED FOR ALL OFFSHORE WIND<br />
FARMS IN THE NORTH SEA; LEGEND: TIME LAG<br />
Power Variation (%)<br />
100<br />
50<br />
0<br />
-50<br />
-100<br />
100<br />
50<br />
0<br />
-50<br />
-100<br />
100<br />
50<br />
0<br />
-50<br />
-100<br />
a) London Array I-IV: 1,000 MW<br />
b) All <strong>offshore</strong> <strong>wind</strong> farms off the British coast: 22,238 MW<br />
c) All <strong>offshore</strong> <strong>wind</strong> farms in the North Sea: 68.4 GW<br />
0 10 20 30 40 50 60 70 80 90 100<br />
Cumulative Frequency of Power Variations (%)<br />
1 h 3 h 9 h 27 h<br />
figure 22: cumulative frequency of variations<br />
in hourly generation FOR ONE WIND FARM, ALL WIND FARMS IN<br />
THE GERMAN BIGHT AND ACCUMULATED FOR ALL OFFSHORE WIND FARMS<br />
IN THE NORTH SEA; LEGEND: TIME LAG<br />
figure 24: cumulative frequency of variations<br />
in hourly generation FOR ONE WIND FARM, ALL WIND FARMS IN<br />
THE BELGIAN EEZ AND ACCUMULATED FOR ALL OFFSHORE WIND FARMS<br />
IN THE NORTH SEA; LEGEND: TIME LAG<br />
100<br />
50<br />
0<br />
-50<br />
-100<br />
a) Bard I+II: 1,600 MW<br />
100<br />
50<br />
0<br />
-50<br />
-100<br />
a) Single <strong>wind</strong> farm Belgium: 300 MW<br />
Power Variation (%)<br />
100<br />
50<br />
0<br />
-50<br />
-100<br />
b) All <strong>offshore</strong> <strong>wind</strong> farms in the German Bight: 26,418 MW<br />
Power Variation (%)<br />
100<br />
50<br />
0<br />
-50<br />
-100<br />
b) All <strong>offshore</strong> <strong>wind</strong> farms in the Belgium: 3,846 MW<br />
100<br />
50<br />
0<br />
-50<br />
-100<br />
c) All <strong>offshore</strong> <strong>wind</strong> farms in the North Sea: 68.4 GW<br />
0 10 20 30 40 50 60 70 80 90 100<br />
100<br />
50<br />
0<br />
-50<br />
-100<br />
c) All <strong>offshore</strong> <strong>wind</strong> farms in the North Sea: 68.4 GW<br />
0 10 20 30 40 50 60 70 80 90 100<br />
Cumulative Frequency of Power Variations (%)<br />
Cumulative Frequency of Power Variations (%)<br />
1 h 3 h 9 h 27 h<br />
1 h 3 h 9 h 27 h<br />
28