offshore grids for wind power integration - Greenpeace
offshore grids for wind power integration - Greenpeace
offshore grids for wind power integration - Greenpeace

You also want an ePaper? Increase the reach of your titles
YUMPU automatically turns print PDFs into web optimized ePapers that Google loves.
GLOBAL ENERGY [R]EVOLUTION<br />
A NORTH SEA ELECTRICITY GRID [R]EVOLUTION<br />
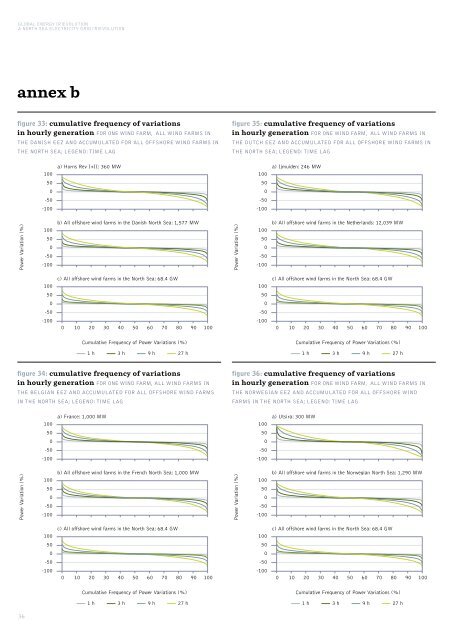
annex b<br />
figure 33: cumulative frequency of variations<br />
in hourly generation FOR ONE WIND FARM, ALL WIND FARMS IN<br />
THE DANISH EEZ AND ACCUMULATED FOR ALL OFFSHORE WIND FARMS IN<br />
THE NORTH SEA; LEGEND: TIME LAG<br />
figure 35: cumulative frequency of variations<br />
in hourly generation FOR ONE WIND FARM, ALL WIND FARMS IN<br />
THE DUTCH EEZ AND ACCUMULATED FOR ALL OFFSHORE WIND FARMS IN<br />
THE NORTH SEA; LEGEND: TIME LAG<br />
100<br />
50<br />
0<br />
-50<br />
-100<br />
a) Horns Rev I+II: 360 MW<br />
100<br />
50<br />
0<br />
-50<br />
-100<br />
a) Ijmuiden: 246 MW<br />
Power Variation (%)<br />
100<br />
50<br />
0<br />
-50<br />
-100<br />
b) All <strong>offshore</strong> <strong>wind</strong> farms in the Danish North Sea: 1,577 MW<br />
Power Variation (%)<br />
100<br />
50<br />
0<br />
-50<br />
-100<br />
b) All <strong>offshore</strong> <strong>wind</strong> farms in the Netherlands: 12,039 MW<br />
100<br />
50<br />
0<br />
-50<br />
-100<br />
c) All <strong>offshore</strong> <strong>wind</strong> farms in the North Sea: 68.4 GW<br />
0 10 20 30 40 50 60 70 80 90 100<br />
100<br />
50<br />
0<br />
-50<br />
-100<br />
c) All <strong>offshore</strong> <strong>wind</strong> farms in the North Sea: 68.4 GW<br />
0 10 20 30 40 50 60 70 80 90 100<br />
Cumulative Frequency of Power Variations (%)<br />
Cumulative Frequency of Power Variations (%)<br />
1 h 3 h 9 h 27 h<br />
1 h 3 h 9 h 27 h<br />
figure 34: cumulative frequency of variations<br />
in hourly generation FOR ONE WIND FARM, ALL WIND FARMS IN<br />
THE BELGIAN EEZ AND ACCUMULATED FOR ALL OFFSHORE WIND FARMS<br />
IN THE NORTH SEA; LEGEND: TIME LAG<br />
figure 36: cumulative frequency of variations<br />
in hourly generation FOR ONE WIND FARM, ALL WIND FARMS IN<br />
THE NORWEGIAN EEZ AND ACCUMULATED FOR ALL OFFSHORE WIND<br />
FARMS IN THE NORTH SEA; LEGEND: TIME LAG<br />
100<br />
50<br />
0<br />
-50<br />
-100<br />
a) France: 1,000 MW<br />
100<br />
50<br />
0<br />
-50<br />
-100<br />
a) Utsira: 300 MW<br />
Power Variation (%)<br />
100<br />
50<br />
0<br />
-50<br />
-100<br />
b) All <strong>offshore</strong> <strong>wind</strong> farms in the French North Sea: 1,000 MW<br />
Power Variation (%)<br />
100<br />
50<br />
0<br />
-50<br />
-100<br />
b) All <strong>offshore</strong> <strong>wind</strong> farms in the Norwegian North Sea: 1,290 MW<br />
100<br />
50<br />
0<br />
-50<br />
-100<br />
c) All <strong>offshore</strong> <strong>wind</strong> farms in the North Sea: 68.4 GW<br />
0 10 20 30 40 50 60 70 80 90 100<br />
100<br />
50<br />
0<br />
-50<br />
-100<br />
c) All <strong>offshore</strong> <strong>wind</strong> farms in the North Sea: 68.4 GW<br />
0 10 20 30 40 50 60 70 80 90 100<br />
Cumulative Frequency of Power Variations (%)<br />
Cumulative Frequency of Power Variations (%)<br />
1 h 3 h 9 h 27 h<br />
1 h 3 h 9 h 27 h<br />
36