2009 Annual Report - Hamilton Police Services
2009 Annual Report - Hamilton Police Services
2009 Annual Report - Hamilton Police Services

Create successful ePaper yourself
Turn your PDF publications into a flip-book with our unique Google optimized e-Paper software.
STATISTICAL HIGHLIGHTS<br />
HAMILTON OFFENCE AND CLEARANCE RATE COMPARISONS 2008 & <strong>2009</strong><br />
2008 <strong>2009</strong><br />
OFFENCE TYPE Offences Cleared<br />
Clearance<br />
Rate Offences Cleared<br />
Clearance<br />
Rate<br />
% Change<br />
Offence<br />
% Change<br />
Cleared<br />
VIOLENT CRIMES 7,265 4,441 60.7% 6,839 4,306 63.0% -5.1% -2.4%<br />
Homicide 6 6 100.0% 8 8 100.0% 33.3% 33.3%<br />
Other Violations Causing Death 0 0 0 4 4 100.0% 0 0<br />
Attempted Murder 4 3 75.0% 2 3 150.0% -50.0% 0.0%<br />
Sexual Assualt, level 3, aggravated 3 1 33.3% 3 3 100.0% 0.0% 200.0%<br />
Sexual Assualt, level 2,<br />
weapon or bodily harm<br />
11 6 54.5% 13 10 76.9% 18.2% 66.7%<br />
Sexual Assualt, level 1 280 138 49.3% 286 166 58.0% 2.1% 20.3%<br />
Sexual Violations Against Children 21 9 42.9% 11 4 36.4% -47.6% -55.6%<br />
Assualt, level 3, aggravated 78 49 62.8% 67 47 70.1% -14.1% -4.1%<br />
Assualt, level 2, weapon or bodily harm 736 497 67.5% 668 459 68.7% -9.2% -7.6%<br />
Assualt, level 1 2,863 2,076 72.5% 2,601 2,031 78.1% -9.2% -2.2%<br />
Assualt Peace Officier 93 86 92.5% 98 99 101.0% 5.4% 15.1%<br />
Aggravated Assualt to a Peace Officier 0 0 0% 0 0 0% 0% 0%<br />
Other Assualts 38 26 68.4% 39 26 66.7% 2.6% 0%<br />
Firearms - use of, discharge, pointing 22 4 18.2% 32 10 31.3% 45.5% 150.0%<br />
Robbery 765 311 40.7% 687 273 39.7% -10.2% -12.2%<br />
Forcible Confinement or Kidnapping 47 42 89.4% 42 37 88.1% -10.6% -11.9%<br />
Abduction 3 3 100.0% 5 2 40.0% 66.7% -33.3%<br />
Extortion 25 12 48.0% 20 6 30.0% -20.0% -50.0%<br />
Criminal Harassment 357 237 66.4% 394 206 52.3% 10.4% -13.1%<br />
Uttering Threats 1,129 634 56.2% 1,129 601 53.2% 0.0% -5.2%<br />
Threatening or Harassing Phone Calls 668 219 32.8% 613 259 42.3% -8.2% 18.3%<br />
Other Violent Criminal Code Violations 116 52 44.8% 117 52 44.4% 0.9% 0.0%<br />
PROPERTY CRIMES 21,938 3,942 18.3% 21,547 4,127 19.2% -1.8% 4.7%<br />
Break and Enter 2,845 601 21.1% 2,710 594 21.9% -4.7% -1.2%<br />
Possess Stolen Property 709 674 95.1% 716 698 97.5% 1.0% 3.6%<br />
Motor Vehicle Theft 2,747 158 5.8% 2,830 336 11.9% 3.0% 112.7%<br />
Theft Over $5,000 (non-motor vehicle) 250 32 12.8% 229 23 10.0% -8.4% -28.1%<br />
Theft Under $5,000 (non-motor vehicle) 9,032 1,471 16.3% 8,751 1,499 17.1% -3.1% 1.9%<br />
Fraud 1,468 429 29.2% 1,390 303 21.8% -5.3% -29.4%<br />
Mischief 4,683 561 12.0% 4,720 660 14.0% 0.8% 17.6%<br />
Arson 204 16 7.8% 201 14 7.0% -1.5% -12.5%<br />
OTHER CRIMINAL CODE 2,590 2,222 85.8% 2,389 2,155 90.2% -7.8% -3.0%<br />
Counterfeiting 1 1 100.0% 2 2 100.0% 100.0% 100.0%<br />
Weapons Violations 158 97 61.4% 119 82 68.9% -24.7% -15.5%<br />
Child Pornography 24 12 50.0% 11 6 54.5% -54.2% -50.0%<br />
Prostitution 86 81 94.2% 105 98 93.3% 22.1% 21.0%<br />
Disturb the Peace 60 39 65.0% 65 52 80.0% 8.3% 33.3%<br />
Administration of Justice Violations 2,038 1,875 92.0% 1,820 1,773 97.4% -10.7% -5.4%<br />
Other Violations 223 117 52.5% 267 142 53.2% 19.7% 21.4%<br />
TOTAL CRIMINAL CODE<br />
(EXCL. TRAFFIC)<br />
31,793 10,575 33.3% 30,775 10,588 34.4% 3.2% 0.1%<br />
HAMILTON OFFENCE AND CLEARANCE RATE COMPARISONS 2008 & <strong>2009</strong> (continued from pg 8)<br />
2008 <strong>2009</strong><br />
OFFENCE TYPE Offences Cleared Rate Offences Cleared Rate Offence Cleared<br />
Clearance<br />
Clearance % Change % Change<br />
DRUG OFFENCES 1,189 1,098 92.3% 1,174 1,112 94.7% -1.3% 1.3%<br />
Possession Cannabis 490 449 91.6% 590 580 98.3% 20.4% 29.2%<br />
Possession Cocaine 292 285 97.6% 183 180 98.4% -37.3% -36.8%<br />
Total Possession - other drugs 54 45 83.3% 63 55 87.3% 16.7% 22.2%<br />
Trafficing, Production or<br />
Distribution - cannabis<br />
108 95 88.0% 133 113 85.0% 23.1% 18.9%<br />
Trafficing, Production or<br />
Distribution - cocaine<br />
180 173 96.1% 147 145 98.6% -18.3% -16.2%<br />
Trafficing, Production or<br />
Distribution - other drugs<br />
65 51 78.5% 58 39 67.2% -10.8% -23.5%<br />
OTHER FEDERAL STATUTES<br />
VIOLATIONS<br />
183 156 85.2% 165 139 84.2% -9.8% -10.9%<br />
Youth Criminal Justice Act 138 139 100.7% 125 125 100.0% -9.4% -10.1%<br />
Other Federal Statutes 45 17 37.8% 40 14 35.0% -11.1% -17.6%<br />
TOTAL ALL VIOLATIONS<br />
(EXCL. TRAFFIC)<br />
33,165 11,829 35.7% 32,114 11,839 36.9% -3.2% 0.1%<br />
Source: Statistics Canada secure website - Downloaded July 28, 2010<br />
Note: Statistics Canada chamged the counting rules for Counterfi eting and Robbery and revised the Violent Crime and Property Crime categories in <strong>2009</strong>. The data for<br />
previous years has been restated to reflect these changes.<br />
COST PER CAPITA<br />
$350.00<br />
$300.00<br />
$250.00<br />
$200.00<br />
$150.00<br />
$100.00<br />
$50.00<br />
$0.00<br />
2008 ONTRIO MUNICIPAL BENCHMARKING INITIATIVE (OMBI) - Cost Per Capita<br />
Median - $230.83<br />
WATERLOO<br />
YORK<br />
HALTON<br />
DURHAM<br />
PEEL<br />
OTTAWA<br />
LONDON<br />
POLICE SERVICE<br />
HAMILTON<br />
NIAGARA<br />
THUNDER BAY<br />
SUDBURY<br />
WINDSOR<br />
TORONTO<br />
8<br />
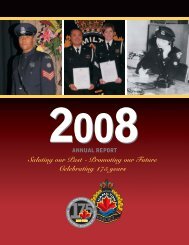
<strong>2009</strong> <strong>Annual</strong> <strong>Report</strong><br />
<strong>2009</strong> <strong>Annual</strong> <strong>Report</strong> 9