ANNUAL HEALTH BULLETIN 2004 - Ministry of Health
ANNUAL HEALTH BULLETIN 2004 - Ministry of Health
ANNUAL HEALTH BULLETIN 2004 - Ministry of Health

You also want an ePaper? Increase the reach of your titles
YUMPU automatically turns print PDFs into web optimized ePapers that Google loves.
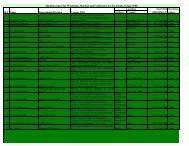
Table 15. Fertilitv status<br />
S Age<br />
No. <strong>of</strong><br />
women T~~al bi:T<br />
Fertility<br />
N Group interviewed in 1 vear Rate<br />
N.LinQ Kabesa Total N.Limz Kabesa Total N.Linll Kabesa Mean<br />
1 15-19 35 29 64 5 0 5 142.85 0 71.43<br />
2 20-24 42 41 83 11 6 17 261.9 146.34 204.12<br />
3 25-29 27 40 67 8 8 16 296.29 200 248.14<br />
4 30-34 30 32 62 4 8 12 133.33 250 191.66<br />
5 35-39 29 27 56 2 7 9 68.96 259.25 164.1<br />
6 40-44 22 23 45 1 6 7 45.45 260.86 153.15<br />
7 45-49 27 21 48 1 0 1 37.03 0 18.51<br />
Looking at the ASFRs (age specific fertility rate) in these seven age groups the total fertility rate is<br />
estimated to be 5.25 per woman. Fertility status was not studied at Kanglung gewog. Fertility in<br />
younger age group was higher in Norbuling gewog and older age group was higher in Kabisa gewog.<br />
5. Discussion:<br />
The women <strong>of</strong> reproductive age during these three surveys represents more then 50% <strong>of</strong> the total<br />
women interviewed .(TotaLwomen in--l6-49 yrs interviewed was 859 and total women in 15-49 yrs<br />
was 635). The study gives us a picture <strong>of</strong> the current situation <strong>of</strong> contraceptive use in the studied<br />
gewogs.<br />
The male to female ratio is found to be marginally higher than the National ratio <strong>of</strong> 98: 100<br />
(Statistical year book- 1997). As per the National <strong>Health</strong> Survey 0[2000, the ratio was found to be<br />
94: 100. Another important finding is the no. <strong>of</strong> women <strong>of</strong> reproductive age residing in these<br />
areas(30%). These aberrations are probably because <strong>of</strong> migration <strong>of</strong> adult male population to other<br />
areas looking for better opportunities or for studies. Other findings like the age and sex distribution<br />
are almost consistent with the existing averages.<br />
The overall contraceptives prevalence in these three gewogs is found to be 41.57% <strong>of</strong> women <strong>of</strong><br />
reproductive age. This shows an overall improvement <strong>of</strong> 10% from 2000 National <strong>Health</strong> Survey<br />
(30.7%). It was lowest in Kabisa gewog- 28%. A comparison <strong>of</strong> the age group wise contraceptive<br />
prevalence with 2000 National <strong>Health</strong> Survey (NHS) is shown in the table below.<br />
Table 16. Com arison <strong>of</strong> a<br />
15 - 19<br />
20-24<br />
25 - 29<br />
30 - 34<br />
35 - 39<br />
40-44<br />
45 -49<br />
Overall