You also want an ePaper? Increase the reach of your titles
YUMPU automatically turns print PDFs into web optimized ePapers that Google loves.
21<br />
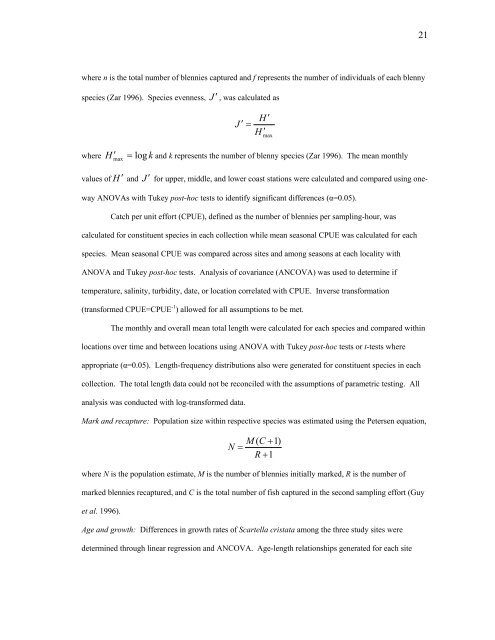
where n is the total number of blennies captured and f represents the number of individuals of each blenny<br />
species (Zar 1996). Species evenness, J ′ , was calculated as<br />
J ′ =<br />
H ′<br />
′<br />
H max<br />
where<br />
H<br />
′ and k represents the number of blenny species (Zar 1996). The mean monthly<br />
max<br />
=<br />
log k<br />
values of H ′ and J ′ for upper, middle, and lower coast stations were calculated and compared using oneway<br />
ANOVAs with Tukey post-hoc tests to identify significant differences (α=0.05).<br />
Catch per unit effort (CPUE), defined as the number of blennies per sampling-hour, was<br />
calculated for constituent species in each collection while mean seasonal CPUE was calculated for each<br />
species. Mean seasonal CPUE was compared across sites and among seasons at each locality with<br />
ANOVA and Tukey post-hoc tests. Analysis of covariance (ANCOVA) was used to determine if<br />
temperature, salinity, turbidity, date, or location correlated with CPUE. Inverse transformation<br />
(transformed CPUE=CPUE -1 ) allowed for all assumptions to be met.<br />
The monthly and overall mean total length were calculated for each species and compared within<br />
locations over time and between locations using ANOVA with Tukey post-hoc tests or t-tests where<br />
appropriate (α=0.05). Length-frequency distributions also were generated for constituent species in each<br />
collection. The total length data could not be reconciled with the assumptions of parametric testing. All<br />
analysis was conducted with log-transformed data.<br />
Mark and recapture: Population size within respective species was estimated using the Petersen equation,<br />
M ( C + 1)<br />
N =<br />
R + 1<br />
where N is the population estimate, M is the number of blennies initially marked, R is the number of<br />
marked blennies recaptured, and C is the total number of fish captured in the second sampling effort (Guy<br />
et al. 1996).<br />
Age and growth: Differences in growth rates of <strong>Scartella</strong> <strong>cristata</strong> among the three study sites were<br />
determined through linear regression and ANCOVA. Age-length relationships generated for each site


