HSBC Holdings plc Sustainability Report 2007
HSBC Holdings plc Sustainability Report 2007
HSBC Holdings plc Sustainability Report 2007

Create successful ePaper yourself
Turn your PDF publications into a flip-book with our unique Google optimized e-Paper software.
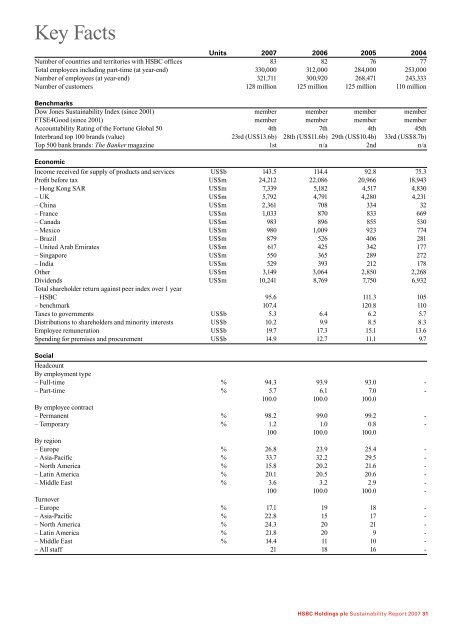
Key Facts<br />
Units <strong>2007</strong> 2006 2005 2004<br />
Number of countries and territories with <strong>HSBC</strong> offices 83 82 76 77<br />
Total employees including part-time (at year-end) 330,000 312,000 284,000 253,000<br />
Number of employees (at year-end) 321,711 300,920 268,471 243,333<br />
Number of customers 128 million 125 million 125 million 110 million<br />
Benchmarks<br />
Dow Jones <strong>Sustainability</strong> Index (since 2001) member member member member<br />
FTSE4Good (since 2001) member member member member<br />
Accountability Rating of the Fortune Global 50 4th 7th 4th 45th<br />
Interbrand top 100 brands (value) 23rd (US$13.6b) 28th (US$11.6b) 29th (US$10.4b) 33rd (US$8.7b)<br />
Top 500 bank brands: The Banker magazine 1st n/a 2nd n/a<br />
Economic<br />
Income received for supply of products and services US$b 143.5 114.4 92.8 75.3<br />
Profit before tax US$m 24,212 22,086 20,966 18,943<br />
– Hong Kong SAR US$m 7,339 5,182 4,517 4,830<br />
– UK US$m 5,792 4,791 4,280 4,231<br />
– China US$m 2,361 708 334 32<br />
– France US$m 1,033 870 833 669<br />
– Canada US$m 983 896 855 530<br />
– Mexico US$m 980 1,009 923 774<br />
– Brazil US$m 879 526 406 281<br />
– United Arab Emirates US$m 617 425 342 177<br />
– Singapore US$m 550 365 289 272<br />
– India US$m 529 393 212 178<br />
Other US$m 3,149 3,064 2,850 2,268<br />
Dividends US$m 10,241 8,769 7,750 6,932<br />
Total shareholder return against peer index over 1 year<br />
– <strong>HSBC</strong> 95.6 111.3 105<br />
– benchmark 107.4 120.8 110<br />
Taxes to governments US$b 5.3 6.4 6.2 5.7<br />
Distributions to shareholders and minority interests US$b 10.2 9.9 8.5 8.3<br />
Employee remuneration US$b 19.7 17.3 15.1 13.6<br />
Spending for premises and procurement US$b 14.9 12.7 11.1 9.7<br />
Social<br />
Headcount<br />
By employment type<br />
– Full-time % 94.3 93.9 93.0 -<br />
– Part-time % 5.7 6.1 7.0 -<br />
100.0 100.0 100.0<br />
By employee contract<br />
– Permanent % 98.2 99.0 99.2 -<br />
– Temporary % 1.2 1.0 0.8 -<br />
100 100.0 100.0<br />
By region<br />
– Europe % 26.8 23.9 25.4 -<br />
– Asia-Pacific % 33.7 32.2 29.5 -<br />
– North America % 15.8 20.2 21.6 -<br />
– Latin America % 20.1 20.5 20.6 -<br />
– Middle East % 3.6 3.2 2.9 -<br />
100 100.0 100.0 -<br />
Turnover<br />
– Europe % 17.1 19 18 -<br />
– Asia-Pacific % 22.8 15 17 -<br />
– North America % 24.3 20 21 -<br />
– Latin America % 21.8 20 9 -<br />
– Middle East % 14.4 11 10 -<br />
– All staff 21 18 16 -<br />
<strong>HSBC</strong> <strong>Holdings</strong> <strong>plc</strong> <strong>Sustainability</strong> <strong>Report</strong> <strong>2007</strong> 31