Serendip: Turning Topics Back to the Text
Serendip: Turning Topics Back to the Text
Serendip: Turning Topics Back to the Text

You also want an ePaper? Increase the reach of your titles
YUMPU automatically turns print PDFs into web optimized ePapers that Google loves.
<strong>Serendip</strong>: <strong>Turning</strong> <strong>Topics</strong> <strong>Back</strong> <strong>to</strong> <strong>the</strong> <strong>Text</strong><br />
Eric Alexander ∗<br />
University of Wisconsin-Madison<br />
Joe Kohlmann †<br />
University of Wisconsin-Madison<br />
Michael Gleicher §<br />
University of Wisconsin-Madison<br />
Robin Valenza ‡<br />
University of Wisconsin-Madison<br />
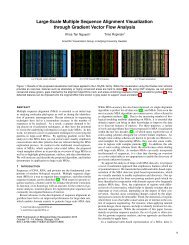
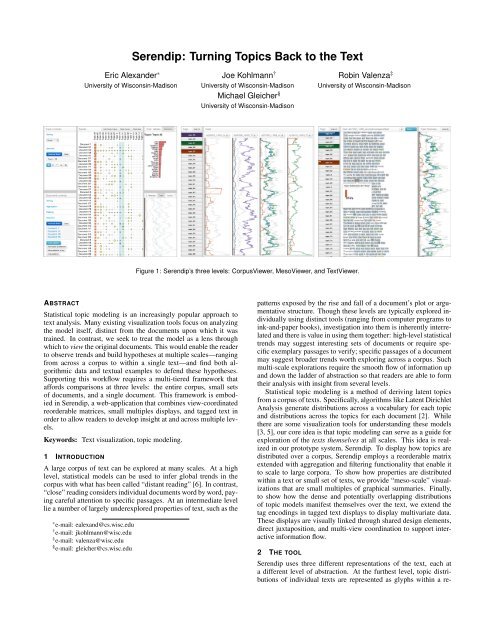
Figure 1: <strong>Serendip</strong>’s three levels: CorpusViewer, MesoViewer, and <strong>Text</strong>Viewer.<br />
ABSTRACT<br />
Statistical <strong>to</strong>pic modeling is an increasingly popular approach <strong>to</strong><br />
text analysis. Many existing visualization <strong>to</strong>ols focus on analyzing<br />
<strong>the</strong> model itself, distinct from <strong>the</strong> documents upon which it was<br />
trained. In contrast, we seek <strong>to</strong> treat <strong>the</strong> model as a lens through<br />
which <strong>to</strong> view <strong>the</strong> original documents. This would enable <strong>the</strong> reader<br />
<strong>to</strong> observe trends and build hypo<strong>the</strong>ses at multiple scales—ranging<br />
from across a corpus <strong>to</strong> within a single text—and find both algorithmic<br />
data and textual examples <strong>to</strong> defend <strong>the</strong>se hypo<strong>the</strong>ses.<br />
Supporting this workflow requires a multi-tiered framework that<br />
affords comparisons at three levels: <strong>the</strong> entire corpus, small sets<br />
of documents, and a single document. This framework is embodied<br />
in <strong>Serendip</strong>, a web-application that combines view-coordinated<br />
reorderable matrices, small multiples displays, and tagged text in<br />
order <strong>to</strong> allow readers <strong>to</strong> develop insight at and across multiple levels.<br />
Keywords: <strong>Text</strong> visualization, <strong>to</strong>pic modeling.<br />
1 INTRODUCTION<br />
A large corpus of text can be explored at many scales. At a high<br />
level, statistical models can be used <strong>to</strong> infer global trends in <strong>the</strong><br />
corpus with what has been called “distant reading” [6]. In contrast,<br />
“close” reading considers individual documents word by word, paying<br />
careful attention <strong>to</strong> specific passages. At an intermediate level<br />
lie a number of largely underexplored properties of text, such as <strong>the</strong><br />
∗ e-mail: ealexand@cs.wisc.edu<br />
† e-mail: jkohlmann@wisc.edu<br />
‡ e-mail: valenza@wisc.edu<br />
§ e-mail: gleicher@cs.wisc.edu<br />
patterns exposed by <strong>the</strong> rise and fall of a document’s plot or argumentative<br />
structure. Though <strong>the</strong>se levels are typically explored individually<br />
using distinct <strong>to</strong>ols (ranging from computer programs <strong>to</strong><br />
ink-and-paper books), investigation in<strong>to</strong> <strong>the</strong>m is inherently interrelated<br />
and <strong>the</strong>re is value in using <strong>the</strong>m <strong>to</strong>ge<strong>the</strong>r: high-level statistical<br />
trends may suggest interesting sets of documents or require specific<br />
exemplary passages <strong>to</strong> verify; specific passages of a document<br />
may suggest broader trends worth exploring across a corpus. Such<br />
multi-scale explorations require <strong>the</strong> smooth flow of information up<br />
and down <strong>the</strong> ladder of abstraction so that readers are able <strong>to</strong> form<br />
<strong>the</strong>ir analysis with insight from several levels.<br />
Statistical <strong>to</strong>pic modeling is a method of deriving latent <strong>to</strong>pics<br />
from a corpus of texts. Specifically, algorithms like Latent Dirichlet<br />
Analysis generate distributions across a vocabulary for each <strong>to</strong>pic<br />
and distributions across <strong>the</strong> <strong>to</strong>pics for each document [2]. While<br />
<strong>the</strong>re are some visualization <strong>to</strong>ols for understanding <strong>the</strong>se models<br />
[3, 5], our core idea is that <strong>to</strong>pic modeling can serve as a guide for<br />
exploration of <strong>the</strong> texts <strong>the</strong>mselves at all scales. This idea is realized<br />
in our pro<strong>to</strong>type system, <strong>Serendip</strong>. To display how <strong>to</strong>pics are<br />
distributed over a corpus, <strong>Serendip</strong> employs a reorderable matrix<br />
extended with aggregation and filtering functionality that enable it<br />
<strong>to</strong> scale <strong>to</strong> large corpora. To show how properties are distributed<br />
within a text or small set of texts, we provide “meso-scale” visualizations<br />
that are small multiples of graphical summaries. Finally,<br />
<strong>to</strong> show how <strong>the</strong> dense and potentially overlapping distributions<br />
of <strong>to</strong>pic models manifest <strong>the</strong>mselves over <strong>the</strong> text, we extend <strong>the</strong><br />
tag encodings in tagged text displays <strong>to</strong> display multivariate data.<br />
These displays are visually linked through shared design elements,<br />
direct juxtaposition, and multi-view coordination <strong>to</strong> support interactive<br />
information flow.<br />
2 THE TOOL<br />
<strong>Serendip</strong> uses three different representations of <strong>the</strong> text, each at<br />
a different level of abstraction. At <strong>the</strong> fur<strong>the</strong>st level, <strong>to</strong>pic distributions<br />
of individual texts are represented as glyphs within a re-
orderable matrix. At an intermediate level, document structure is<br />
represented in color-coded line graphs showing <strong>the</strong> rise and fall of<br />
individual <strong>to</strong>pics. At <strong>the</strong> closest level, <strong>to</strong>pic assignments are represented<br />
as colored tags overlaid upon <strong>the</strong> raw text. These three<br />
encodings form <strong>the</strong> core visualization elements of <strong>the</strong> three components<br />
of <strong>Serendip</strong>: CorpusViewer, MesoViewer, and <strong>Text</strong>Viewer.<br />
2.1 CorpusViewer<br />
Our highest level encoding of <strong>the</strong> texts is a reorderable matrix [1]<br />
which plots documents (rows) against <strong>to</strong>pics (columns). The values<br />
of <strong>the</strong> document distributions are encoded as circular glyphs located<br />
at <strong>the</strong> vertices of <strong>the</strong> grid. It has been shown that people can find<br />
interesting attributes and patterns within <strong>the</strong> data of such matrices if<br />
<strong>the</strong>y are given direct control of <strong>the</strong> orders <strong>the</strong>mselves [7]. We extend<br />
this control <strong>to</strong> include a set of meaningful metrics by which readers<br />
can rearrange <strong>the</strong>ir data, including similarity distances, statistical<br />
properties of <strong>the</strong> distributions, and human-generated metadata. We<br />
give readers access <strong>to</strong> all of <strong>the</strong>se features with which <strong>to</strong> aggregate,<br />
rank, filter, and annotate <strong>the</strong> data as <strong>the</strong>y see fit. Rows and columns<br />
can also be moved manually.<br />
2.2 MesoViewer<br />
At <strong>the</strong> intermediate level, we sought <strong>to</strong> represent document structure<br />
as inferred by <strong>the</strong> <strong>to</strong>pic model. Just as <strong>the</strong>mes and subject<br />
matter will come and go throughout <strong>the</strong> course of a s<strong>to</strong>ry, so do occurrences<br />
of a <strong>to</strong>pic vary in density, especially in longer documents.<br />
We reflect <strong>the</strong>se variations using line graphs displaying densities for<br />
each <strong>to</strong>pic. MesoViewer provides a small multiples display of <strong>the</strong>se<br />
line graphs, allowing easy comparison between sets of documents.<br />
Individual <strong>to</strong>pics can be <strong>to</strong>ggled on and off, in which case <strong>the</strong>y are<br />
color coded <strong>to</strong> facilitate comparison.<br />
2.3 <strong>Text</strong>Viewer<br />
At <strong>the</strong> level of passages, we annotate <strong>the</strong> raw text with data from <strong>the</strong><br />
statistical model using colored backgrounds <strong>to</strong> highlight individual<br />
words. These sorts of “tagged text” displays allow us <strong>to</strong> adorn <strong>the</strong><br />
text with additional information without sacrificing readability [4].<br />
In our encoding, we use such tags <strong>to</strong> indicate <strong>the</strong> <strong>to</strong>pics that our<br />
model predicts <strong>to</strong> have generated <strong>the</strong> words in a given document.<br />
The process we use does not generate a single <strong>to</strong>pic for each<br />
word, but ra<strong>the</strong>r a distribution across <strong>to</strong>pics, such that words are<br />
potentially labeled with overlapping tags, each with an associated<br />
probability. We provide a number of options for displaying <strong>the</strong>se<br />
probabilities (see Fig. 2). One option highlights words from multiple<br />
<strong>to</strong>pics using gray backgrounds <strong>to</strong> indicate <strong>the</strong> overlap—<strong>the</strong>y<br />
are <strong>the</strong>n underlined with <strong>the</strong>ir most probable <strong>to</strong>pic’s color. Ano<strong>the</strong>r<br />
option indicates <strong>the</strong> corresponding probabilities of <strong>the</strong> tags by representing<br />
<strong>to</strong>pics as single-hue color ramps ra<strong>the</strong>r than single colors<br />
(e.g. a word with high likelihood of being in a <strong>to</strong>pic might be dark<br />
blue while a word with low likelihood might be light blue). This<br />
gives greater perceptual weight <strong>to</strong> <strong>the</strong> tags about which <strong>the</strong> model<br />
is most confident. Finally, clicking on an individual word displays<br />
a popup showing its full distribution.<br />
<strong>Text</strong>Viewer’s tagged text display is juxtaposed with ano<strong>the</strong>r instance<br />
of <strong>the</strong> <strong>to</strong>pic distribution line graph described in Section 2.2.<br />
This line graph operates as a navigational <strong>to</strong>ol for longer texts. Simply<br />
by clicking on a section of <strong>the</strong> graph with an interesting feature<br />
(e.g. a peak or valley of a particular <strong>to</strong>pic), <strong>the</strong> reader can navigate<br />
<strong>to</strong> <strong>the</strong> corresponding passage of text <strong>to</strong> see how said feature is<br />
reflected in <strong>the</strong> semantic content of <strong>the</strong> words.<br />
2.4 Cross-Viewer Interaction<br />
Interaction techniques across <strong>the</strong> three Viewers allow readers <strong>to</strong><br />
identify interesting documents or sets of documents in one level and<br />
open <strong>the</strong>m in ano<strong>the</strong>r level. Shared <strong>to</strong>pic colors and cross-viewer<br />
brushing aid in transferring insight from one level <strong>to</strong> ano<strong>the</strong>r.<br />
Figure 2: In <strong>Text</strong>Viewer, <strong>to</strong>pic assignments are indicated using colored<br />
tags. Probabilities can be shown using varied-hue color ramps.<br />
Individual words’ <strong>to</strong>pic distributions are displayed within popups.<br />
3 CONCLUSION<br />
As part of a project <strong>to</strong> understand <strong>the</strong> development of English language<br />
literature after <strong>the</strong> introduction of print, our collabora<strong>to</strong>rs<br />
used <strong>Serendip</strong> <strong>to</strong> explore a corpus of 1080 documents sampled from<br />
1530 <strong>to</strong> 1799. Already familiar with <strong>the</strong> dataset, <strong>the</strong>y were able <strong>to</strong><br />
quickly spot unexpected <strong>to</strong>pic occurrences in CorpusViewer, especially<br />
when documents were aggregated by metadata such as genre<br />
and decade. The real advantage of <strong>Serendip</strong>’s workflow was evident<br />
in our collabora<strong>to</strong>rs’ ability <strong>to</strong> make comparisons amongst <strong>the</strong>se aggregations<br />
in MesoViewer and drill down <strong>to</strong> explana<strong>to</strong>ry passages<br />
in <strong>Text</strong>Viewer. These lower level views provided <strong>the</strong> context and<br />
examples needed <strong>to</strong> make sense of high level trends.<br />
In addition <strong>to</strong> <strong>the</strong> literature domain, we used <strong>Serendip</strong> <strong>to</strong> explore<br />
models built on corpora of online hotel reviews and news articles.<br />
In <strong>the</strong> future, we will examine <strong>Serendip</strong>’s utility within o<strong>the</strong>r disciplines<br />
and extend its use <strong>to</strong> more general statistical models of text.<br />
ACKNOWLEDGEMENTS<br />
This work was supported in part by NSF award IIS-1162037 and a<br />
grant from <strong>the</strong> Andrew W. Mellon Foundation. Thanks <strong>to</strong> Ce Zhang<br />
for <strong>to</strong>pic modeling support and Mattie Burkert for corpus curation.<br />
REFERENCES<br />
[1] J. Bertin. Semiology of graphics: diagrams, networks, maps. 1983.<br />
[2] D. Blei et al. Latent dirichlet allocation. JMLR, 3:993–1022, 2003.<br />
[3] J. Chuang et al. Interpretation and trust: Designing model-driven visualizations<br />
for text analysis. In Proc. 2012 ACM Human Fac<strong>to</strong>rs in<br />
Computing Systems, pages 443–452. ACM, 2012.<br />
[4] M. Greco et al. On <strong>the</strong> portability of computer-generated presentations:<br />
The effect of text-background color combinations on text legibility. Human<br />
Fac<strong>to</strong>rs: The Journal of <strong>the</strong> Human Fac<strong>to</strong>rs and Ergonomics Society,<br />
50(5):821–833, 2008.<br />
[5] S. Liu et al. Interactive, <strong>to</strong>pic-based visual text summarization and analysis.<br />
In Proc. 18th ACM Conf. Information and Knowledge Management,<br />
pages 543–552. ACM, 2009.<br />
[6] F. Moretti. Graphs, Maps, Trees: Abstract models for a literary his<strong>to</strong>ry.<br />
Verso Books, 2005.<br />
[7] H. Siir<strong>to</strong>la. Interaction with <strong>the</strong> reorderable matrix. In Proc. 1999 IEEE<br />
Int. Conf. on Information Visualization, pages 272–277. IEEE, 1999.