Reading 1D Barcodes with Mobile Phones Using Deformable ...
Reading 1D Barcodes with Mobile Phones Using Deformable ...
Reading 1D Barcodes with Mobile Phones Using Deformable ...

You also want an ePaper? Increase the reach of your titles
YUMPU automatically turns print PDFs into web optimized ePapers that Google loves.
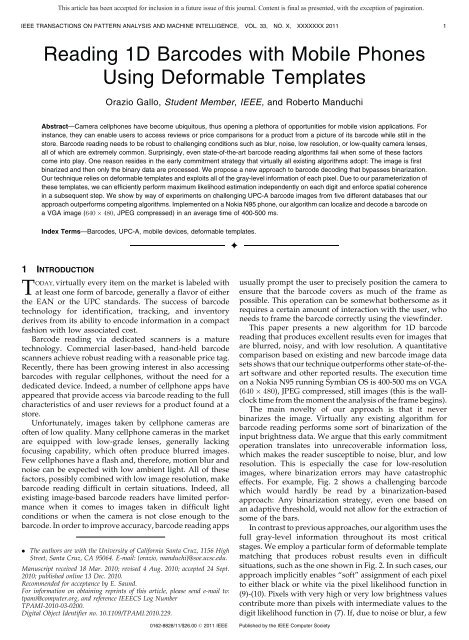
This article has been accepted for inclusion in a future issue of this journal. Content is final as presented, <strong>with</strong> the exception of pagination.<br />
IEEE TRANSACTIONS ON PATTERN ANALYSIS AND MACHINE INTELLIGENCE, VOL. 33, NO. X, XXXXXXX 2011 1<br />
<strong>Reading</strong> <strong>1D</strong> <strong>Barcodes</strong> <strong>with</strong> <strong>Mobile</strong> <strong>Phones</strong><br />
<strong>Using</strong> <strong>Deformable</strong> Templates<br />
Orazio Gallo, Student Member, IEEE, and Roberto Manduchi<br />
Abstract—Camera cellphones have become ubiquitous, thus opening a plethora of opportunities for mobile vision applications. For<br />
instance, they can enable users to access reviews or price comparisons for a product from a picture of its barcode while still in the<br />
store. Barcode reading needs to be robust to challenging conditions such as blur, noise, low resolution, or low-quality camera lenses,<br />
all of which are extremely common. Surprisingly, even state-of-the-art barcode reading algorithms fail when some of these factors<br />
come into play. One reason resides in the early commitment strategy that virtually all existing algorithms adopt: The image is first<br />
binarized and then only the binary data are processed. We propose a new approach to barcode decoding that bypasses binarization.<br />
Our technique relies on deformable templates and exploits all of the gray-level information of each pixel. Due to our parameterization of<br />
these templates, we can efficiently perform maximum likelihood estimation independently on each digit and enforce spatial coherence<br />
in a subsequent step. We show by way of experiments on challenging UPC-A barcode images from five different databases that our<br />
approach outperforms competing algorithms. Implemented on a Nokia N95 phone, our algorithm can localize and decode a barcode on<br />
a VGA image (640 480, JPEG compressed) in an average time of 400-500 ms.<br />
Index Terms—<strong>Barcodes</strong>, UPC-A, mobile devices, deformable templates.<br />
1 INTRODUCTION<br />
TODAY, virtually every item on the market is labeled <strong>with</strong><br />
at least one form of barcode, generally a flavor of either<br />
the EAN or the UPC standards. The success of barcode<br />
technology for identification, tracking, and inventory<br />
derives from its ability to encode information in a compact<br />
fashion <strong>with</strong> low associated cost.<br />
Barcode reading via dedicated scanners is a mature<br />
technology. Commercial laser-based, hand-held barcode<br />
scanners achieve robust reading <strong>with</strong> a reasonable price tag.<br />
Recently, there has been growing interest in also accessing<br />
barcodes <strong>with</strong> regular cellphones, <strong>with</strong>out the need for a<br />
dedicated device. Indeed, a number of cellphone apps have<br />
appeared that provide access via barcode reading to the full<br />
characteristics of and user reviews for a product found at a<br />
store.<br />
Unfortunately, images taken by cellphone cameras are<br />
often of low quality. Many cellphone cameras in the market<br />
are equipped <strong>with</strong> low-grade lenses, generally lacking<br />
focusing capability, which often produce blurred images.<br />
Few cellphones have a flash and, therefore, motion blur and<br />
noise can be expected <strong>with</strong> low ambient light. All of these<br />
factors, possibly combined <strong>with</strong> low image resolution, make<br />
barcode reading difficult in certain situations. Indeed, all<br />
existing image-based barcode readers have limited performance<br />
when it comes to images taken in difficult light<br />
conditions or when the camera is not close enough to the<br />
barcode. In order to improve accuracy, barcode reading apps<br />
. The authors are <strong>with</strong> the University of California Santa Cruz, 1156 High<br />
Street, Santa Cruz, CA 95064. E-mail: {orazio, manduchi}@soe.ucsc.edu.<br />
Manuscript received 18 Mar. 2010; revised 4 Aug. 2010; accepted 24 Sept.<br />
2010; published online 13 Dec. 2010.<br />
Recommended for acceptance by E. Saund.<br />
For information on obtaining reprints of this article, please send e-mail to:<br />
tpami@computer.org, and reference IEEECS Log Number<br />
TPAMI-2010-03-0200.<br />
Digital Object Identifier no. 10.1109/TPAMI.2010.229.<br />
Ç<br />
usually prompt the user to precisely position the camera to<br />
ensure that the barcode covers as much of the frame as<br />
possible. This operation can be somewhat bothersome as it<br />
requires a certain amount of interaction <strong>with</strong> the user, who<br />
needs to frame the barcode correctly using the viewfinder.<br />
This paper presents a new algorithm for <strong>1D</strong> barcode<br />
reading that produces excellent results even for images that<br />
are blurred, noisy, and <strong>with</strong> low resolution. A quantitative<br />
comparison based on existing and new barcode image data<br />
sets shows that our technique outperforms other state-of-theart<br />
software and other reported results. The execution time<br />
on a Nokia N95 running Symbian OS is 400-500 ms on VGA<br />
(640 480), JPEG compressed, still images (this is the wallclock<br />
time from the moment the analysis of the frame begins).<br />
The main novelty of our approach is that it never<br />
binarizes the image. Virtually any existing algorithm for<br />
barcode reading performs some sort of binarization of the<br />
input brightness data. We argue that this early commitment<br />
operation translates into unrecoverable information loss,<br />
which makes the reader susceptible to noise, blur, and low<br />
resolution. This is especially the case for low-resolution<br />
images, where binarization errors may have catastrophic<br />
effects. For example, Fig. 2 shows a challenging barcode<br />
which would hardly be read by a binarization-based<br />
approach: Any binarization strategy, even one based on<br />
an adaptive threshold, would not allow for the extraction of<br />
some of the bars.<br />
In contrast to previous approaches, our algorithm uses the<br />
full gray-level information throughout its most critical<br />
stages. We employ a particular form of deformable template<br />
matching that produces robust results even in difficult<br />
situations, such as the one shown in Fig. 2. In such cases, our<br />
approach implicitly enables “soft” assignment of each pixel<br />
to either black or white via the pixel likelihood function in<br />
(9)-(10). Pixels <strong>with</strong> very high or very low brightness values<br />
contribute more than pixels <strong>with</strong> intermediate values to the<br />
digit likelihood function in (7). If, due to noise or blur, a few<br />
0162-8828/11/$26.00 ß 2011 IEEE Published by the IEEE Computer Society
This article has been accepted for inclusion in a future issue of this journal. Content is final as presented, <strong>with</strong> the exception of pagination.<br />
2 IEEE TRANSACTIONS ON PATTERN ANALYSIS AND MACHINE INTELLIGENCE, VOL. 33, NO. X, XXXXXXX 2011<br />
pixels have intermediate gray values, as in Fig. 2, the<br />
ambiguity is generally resolved by the barcode-specific<br />
structural priors M. We shift and scale the archetypal<br />
models of each individual barcode digit to match the<br />
measured brightness profile in a maximum likelihood<br />
framework. Although deformable template matching usually<br />
requires costly optimization techniques, we prove that in<br />
the case of these patterns, matching can be obtained exactly<br />
<strong>with</strong> a simple discrete search. In addition, we propose an<br />
optimization procedure to enforce spatial coherence of the<br />
individual digits found by deformable template matching.<br />
Our decoding algorithm requires that the barcode has<br />
been localized <strong>with</strong> fairly good precision (<strong>with</strong>in twice the<br />
width of the base width, that is, the smallest possible bar in<br />
the barcode). This operation is facilitated by the fact that a<br />
barcode is bordered to the side by a quiet (white) area whose<br />
size is prescribed by the standard. We propose a simple and<br />
fast algorithm for localization that assumes that the bars are<br />
approximately vertical. It should be understood that the<br />
main contribution of this work and the more intellectually<br />
original one is the barcode decoding algorithm. The<br />
localization algorithm has no pretense of optimality but<br />
works reasonably well in our tests, better than other<br />
published algorithms that we also experimented <strong>with</strong>.<br />
This paper is organized as follows: Section 2 describes<br />
previous work on image-based barcode localization and<br />
decoding. Section 3 describes in detail the proposed<br />
algorithm. Section 4.1 reports a thorough performance<br />
analysis of the algorithm, implemented in Matlab and<br />
tested on different data sets. Section 4.2 describes the<br />
Symbian implementation of the algorithm.<br />
2 PREVIOUS WORK<br />
Barcode reading has been studied and optimized for decades<br />
and it now represents a well-established industrial standard.<br />
(Pavlidis et al. provide an interesting analysis of this<br />
technology from an information theory standpoint [9].) Until<br />
recently, however, barcode reading was performed almost<br />
exclusively <strong>with</strong> dedicated hardware. Despite the rapid<br />
growth of interest in camera-based readers, most of the<br />
challenges posed by this new approach are yet to be solved.<br />
Commercial scanners, such as those used in supermarkets,<br />
shine a stripe of pulsed light on the code and<br />
measure the intensity of its reflection; the use of active<br />
illumination makes them virtually insensitive to changes of<br />
ambient illumination. Additionally, their design often<br />
requires the codes to be fairly close to the scanner. In<br />
general, these dedicated devices produce a high quality<br />
signal that allows for robust barcode reading. On the other<br />
hand, reading barcodes <strong>with</strong> cameras presents new challenges.<br />
In particular, the image may be of poor quality due<br />
to noise and possibly low contrast.<br />
The first step for a barcode reader is the localization of the<br />
barcode in the image. Most existing applications require the<br />
user to move the camera toward the barcode so as to<br />
maximize its apparent width in the image. Although<br />
beneficial to resolution, this procedure can be bothersome<br />
for the user. Our system lets the user take a snapshot of the<br />
barcode once it is at a reasonable distance from the camera; it<br />
then proceeds to identify the location of the end points of the<br />
barcode in the image. Once the barcode has been localized,<br />
decoding takes place. Keeping localization and decoding<br />
distinct allows for higher computational efficiency. Existing<br />
approaches for barcode localization apply to the binarized<br />
image methods based on Hough transforms [6], edge<br />
orientation histograms [14], morphological operators [4], or<br />
wavelet transforms [13]. Other approaches assume that the<br />
center of the image falls <strong>with</strong>in the barcode area [7], [12], thus<br />
greatly simplifying the problem: Ohbuchi et al. reduce the<br />
problem to one of finding the angular direction of the bars<br />
[7], while Wachenfeld et al. extract a scanline through the<br />
center of the image and binarize it <strong>with</strong> an adaptive<br />
threshold; the end points are localized by counting the<br />
number of bars detected [12].<br />
Decoding can be performed by simply finding the<br />
sequence of digits that best explains one or more binarized<br />
scanlines. Chai and Hock use a single scanline, binarized<br />
using the average gray level as a threshold [4], whereas<br />
Wachenfeld et al. use a simple adaptive thresholding [12].<br />
Adelmann et al. use multiple scanlines <strong>with</strong> different<br />
thresholds and a voting scheme [3]. These approaches<br />
report high accuracy, but unfortunately do not present<br />
comparative tests nor make their data sets public.<br />
Kresic-Juric et al. find potential edges by computing<br />
brightness derivatives of the scanline and then use hidden<br />
Markov models to remove false positives [5]. Their method<br />
compares favorably <strong>with</strong> previous approaches although it<br />
was only implemented on laser-based barcode scanners.<br />
Tekin and Coughlan propose an elegant Bayesian framework<br />
for barcode decoding [10]. Their approach aims to<br />
find the edges of the bars in a fashion similar to Kresic-Juric<br />
et al. [5] while allowing for undetected peaks.<br />
Early commitment approaches, whether based on binarization<br />
or edge detection, are efficient from a computational<br />
standpoint, but heavily rely on the good quality of the input<br />
image. Unfortunately, binarization is very sensitive to noise<br />
and blur, in particular when the features to be detected,<br />
such as the narrow bars of a barcode, are smaller in size<br />
than a couple of pixels. The same can be said for edge<br />
extraction. In contrast, our decoding algorithm never performs a<br />
binarization or an edge extraction operation. As a result, our<br />
approach is capable of decoding <strong>1D</strong> barcodes from noisy<br />
pictures even in the presence of motion blur or lack focus.<br />
Additionally, our method also proves effective on highly<br />
compressed pictures. In order to allow other researchers to<br />
compare their results against ours, we provide a publicly<br />
accessible barcode image data set [2].<br />
3 THE BARCODE READER<br />
Given an image containing a barcode, two distinct operations<br />
are needed for accessing the information contained in<br />
the barcode: localization and decoding. Localization typically<br />
relies on the strong textural content of the barcode, <strong>with</strong>out<br />
the need to exactly measure and interpret the width<br />
distribution of the bars. Decoding can be performed on<br />
one or more scanlines. Throughout this paper, we make use<br />
of the following definitions (see the Appendix for a more<br />
complete description of the terminology). A UPC-A barcode<br />
encodes 12 symbols (each representing a number 0-9). Each<br />
of the consecutive, nonoverlapping segments which encode<br />
the symbols are called digits segments or simply digits. For
This article has been accepted for inclusion in a future issue of this journal. Content is final as presented, <strong>with</strong> the exception of pagination.<br />
GALLO AND MANDUCHI: READING <strong>1D</strong> BARCODES WITH MOBILE PHONES USING DEFORMABLE TEMPLATES 3<br />
Fig. 1. Our algorithm is able to decode a barcode <strong>with</strong>out requiring the<br />
user to precisely frame it <strong>with</strong>in the viewfinder. The result is shown on<br />
the screen of the phone above the captured picture, in this case 043396<br />
111554.<br />
instance, in the barcode shown in Fig. 1, the symbol<br />
encoded in the second digit is “4.” Note that each symbol is<br />
encoded by two white and two black bars.<br />
3.1 Barcode Localization<br />
The localization algorithm provides the decoding algorithm<br />
<strong>with</strong> a scanline where the barcode’s end points have been<br />
localized as accurately as possible. In principle, any reliable<br />
algorithm for localization could be used, including the<br />
techniques mentioned in Section 2. However, we have<br />
found out that the simple and fast algorithm presented in<br />
this section provides excellent results even in challenging<br />
situations. Note that, contrary to approaches that assume<br />
that the barcode is in the center of the captured frame (e.g.,<br />
[1], [12]), our method only requires that the barcode be<br />
completely visible. We implemented other algorithms from<br />
the literature [11], [14]; however, these methods produced<br />
results comparable or inferior to our simple method, at a<br />
substantially higher computational cost.<br />
Our localization algorithm assumes that the image of the<br />
barcode is captured <strong>with</strong> the camera oriented so that its<br />
vertical axis is approximately parallel to the bars. Thus, in<br />
correspondence of a barcode, one should expect an<br />
extended region characterized by strong horizontal gradients<br />
and weak vertical gradients. Accordingly, we first<br />
compute the horizontal and vertical derivatives, IxðnÞ and<br />
IyðnÞ, at each pixel n. We then combine them together in a<br />
nonlinear fashion as by<br />
IeðnÞ ¼jIxðnÞj jIyðnÞj: ð1Þ<br />
It is reasonable to assume that many points <strong>with</strong>in a<br />
barcode should have a large value of IeðnÞ. We run a<br />
block filter of size 31 31 over IeðnÞ, obtaining the<br />
smoothed map IsðnÞ. The size of the filter was chosen based<br />
on the range of the size of the input images and the<br />
minimum size of the barcode readable by our method. Note<br />
that block filtering can be implemented efficiently so that<br />
only few operations per pixel are required. Finally, we<br />
binarize IsðnÞ <strong>with</strong> a single threshold, selected using the<br />
method proposed by Otsu [8]. Note that this binarization is<br />
only used to localize the barcode while the decoding is<br />
performed on the gray-level image. As a consequence of<br />
Fig. 2. A challenging barcode image that is correctly decoded by our<br />
algorithm. The intensity profile from the segment highlighted in red on<br />
the blue scanline is shown in the plot, where the black lines represent<br />
the symbols as output by our algorithm. Note how blur and low resolution<br />
affect the intensity profile. A system that binarizes the intensity would be<br />
hard-pressed to detect the correct pattern. For example, consider the<br />
segment between pixels 32 and 38 representing a sequence of two<br />
black and two white bars. The observed brightness has an almost flat<br />
profile which is nearly impossible to binarize. The barcode shown was<br />
automatically extracted from a 1;152 864, JPEG image and its total<br />
width was 114 pixels.<br />
thresholding, the map IsðnÞ may contain more than one<br />
blob. Rather than computing the connected components of<br />
the thresholded map, we simply select the pixel n0 that<br />
maximizes IsðnÞ, under the assumption that the correct<br />
blob, i.e., the one corresponding to the barcode, contains<br />
such a pixel. In our experiments, this assumption was<br />
always found to be correct. Then, we expand a vertical and<br />
an horizontal line from n0, and form a rectangle <strong>with</strong> sides<br />
parallel to the axes of the image and containing the<br />
intersections of these lines <strong>with</strong> the edge of the blob. The<br />
horizontal line lðnÞ that passes through the center of this<br />
rectangle is chosen as the scanline for the analysis. Note that<br />
the leftmost and rightmost bars of a barcode are bordered<br />
by a quiet zone, a white region around the barcode which<br />
facilitates localization (see the Appendix). The quiet zone,<br />
along <strong>with</strong> the large size of the block filter, ensures that the<br />
vertical sides of this rectangle fall outside the area of the<br />
barcode by at least a few pixels. Therefore, in order to<br />
localize the end points oL and oR of the barcode, we first<br />
determine the intersections iL and iR of the scanline lðnÞ<br />
<strong>with</strong> the rectangle and then, the rectangle being larger than<br />
the actual barcode, we proceed inward from each end (see<br />
Fig. 3d). We stop when we find a value that is less than<br />
85 percent of the average luminance from the intersection<br />
points to the current pixels:<br />
and<br />
oL : lðoLÞ < 0:85<br />
oR : lðoRÞ < 0:85<br />
P oL 1<br />
n¼iL lðnÞ<br />
oL iL 1<br />
Pn¼oRþ1 iR<br />
iR oR þ 1<br />
ð2Þ<br />
lðnÞ<br />
: ð3Þ
This article has been accepted for inclusion in a future issue of this journal. Content is final as presented, <strong>with</strong> the exception of pagination.<br />
4 IEEE TRANSACTIONS ON PATTERN ANALYSIS AND MACHINE INTELLIGENCE, VOL. 33, NO. X, XXXXXXX 2011<br />
Fig. 3. An example of barcode localization <strong>with</strong> our algorithm.<br />
(a) Original image (1;152 864, JPEG compressed). (b) The smoothed<br />
map IsðnÞ <strong>with</strong> its maximum marked by a black square. (c) Binarization<br />
by thresholding of IsðnÞ. (d) The resulting rectangular segment (black<br />
square), along <strong>with</strong> the selected scanline lðnÞ, the intersection points iL<br />
and iR, and the end points oL and oR.<br />
Although this algorithm relies on the assumption that the<br />
bars of the barcode are approximately vertical in the image,<br />
our studies show that the map IeðnÞ can be segmented even<br />
when this assumption is not satisfied. Indeed, as long as the<br />
barcode’s bars are slanted by an angle smaller than 45 degrees,<br />
the segmentation algorithm usually succeeds. However, it<br />
must be noted that our algorithm only uses horizontal<br />
scanlines for decoding and requires that all bars of a barcode<br />
be intersected by one such scanline. Due to the aspect ratio of<br />
typical barcodes, this adds the requirement that the bars form<br />
an angle no larger than 30 degrees from the vertical. We<br />
present an assessment of the performance and speed of this<br />
algorithm when implemented in Matlab and Symbian in<br />
Sections 4.1 and 4.2.<br />
3.2 Barcode Decoding<br />
Our decoding algorithm analyzes a single scanline extracted<br />
from the detected barcode area as described in<br />
Section 3.1. The only requirement is that the beginning and<br />
the end of the barcode pattern in the scanline are detected<br />
<strong>with</strong> a certain accuracy. In our implementation, we assume<br />
a localization tolerance in either end point equal to twice the<br />
width of the narrowest bar.<br />
Algorithm outline. First, based on the previously detected<br />
end points of the scanline, we compute the spatial location<br />
of each digit segment in the barcode. As described in the<br />
Appendix, these digits are encoded independently of each<br />
other and occupy contiguous, nonoverlapping intervals on<br />
the scanline. For each of the 12 digits in the barcode, we<br />
compare the intensity profile of the corresponding segment<br />
of the scanline <strong>with</strong> binary templates, each representing a<br />
symbol, as shown in Fig. 4. In order to account for<br />
inaccuracy in the localization of the spatial extent of each<br />
digit, we allow these templates to shift and scale in the<br />
horizontal direction. We then define a likelihood function to<br />
measure how well a deformed (shifted and scaled) template<br />
explains the observed intensity. A possible strategy could<br />
Fig. 4. Each digit in a UPC-A code is encoded <strong>with</strong> a sequence of two bars<br />
and two spaces, represented in these graphs by values of 1 and 1.<br />
be to search for the deformation parameters that maximize<br />
the likelihood, i.e., the shifted and scaled template that best<br />
explains the data, hoping to avoid the many existing local<br />
maxima. Rather than focusing on a single deformation, we<br />
propose integrating the likelihood over the space of<br />
deformations, having defined a prior distribution of the<br />
deformation parameters. One important contribution of this<br />
work is to derive an algorithm to compute this integral<br />
exactly and in affordable computing time.<br />
Independent likelihood maximization over each digit<br />
segment produces a sequence of symbols. However, the<br />
result of this operation may be incorrect due to noise, blur,<br />
or other causes. The risk of such errors can be reduced by<br />
exploiting global constraints on the overall sequence of<br />
symbols. The idea is that the “optimal” sequence of<br />
deformed templates should not present overlaps or gaps.<br />
We define a global cost function that, for each possible<br />
sequence of symbols, penalizes overlaps or gaps in the<br />
sequence of deformed templates, <strong>with</strong> the deformation<br />
parameters obtained by least squares regression. The<br />
minimum cost sequence can then be found via dynamic<br />
programming. We now describe in detail each of the steps<br />
of this procedure.<br />
<strong>Deformable</strong> models. We define a model (or template) M k for a<br />
given symbol k as a continuous piecewise constant function<br />
that alternates between 1 and 1, where a value of 1 (1)<br />
represents a black (white) bar (see Fig. 4). A model M k for a<br />
symbol in the left half of a UPC-A barcode begins <strong>with</strong> a “ 1”<br />
segment and ends <strong>with</strong> a “1” segment, where both such<br />
segments have length of 1. The length of the ith constant<br />
segment between these two end segments is equal to the<br />
module width r k i<br />
(as defined in the Appendix). A model is<br />
therefore an archetypal representation of one symbol of a<br />
standardized scanline plus one bar from each one of the<br />
nearby symbols. These two additional bars have base width<br />
and known polarity; adding such bars to the template<br />
increases the robustness of the matching process.<br />
A parameterized model is a shifted and scaled (deformed)<br />
version of the original model:<br />
M k<br />
o;wðxÞ ¼Mkððx oÞ=wÞ; ð4Þ<br />
where o represents the starting point of the pattern and w<br />
represents the base width. (Note that models are functions<br />
of the continuous line, while the observation IðnÞ is defined<br />
over the discrete space of pixels.) An example of a deformed<br />
model is shown in Fig. 5.<br />
Digit segment—conditional likelihood. Once the barcode has<br />
been localized in the image and the end points ðoL;oRÞ of
the selected scanline have been estimated, the approximate<br />
position of each digit segment of the barcode is computed.<br />
More precisely, the jth digit segment in the left side of the<br />
barcode is assumed to start at<br />
where<br />
This article has been accepted for inclusion in a future issue of this journal. Content is final as presented, <strong>with</strong> the exception of pagination.<br />
GALLO AND MANDUCHI: READING <strong>1D</strong> BARCODES WITH MOBILE PHONES USING DEFORMABLE TEMPLATES 5<br />
Fig. 5. A sample of the intensity profile in a scanline (blue line). The<br />
segment ½o; o þ 7wŠ represents the location of the initial digit segment<br />
obtained from (5)-(6), whereas the segment ½o2; o2 þ 7w2Š is the<br />
estimated support segment as by (15) for k ¼ 2. The red line<br />
represents the deformed model M 2<br />
. For the sake of graphical<br />
o2;w2<br />
clarity, the model was scaled in amplitude so that it alternates between<br />
b and w (as defined in Section 3.2).<br />
o ¼ oL þ 3w þ 7w ðj 1Þ; ð5Þ<br />
w ¼ oR oL<br />
ð6Þ<br />
95<br />
is the estimated base width. These expressions derive from<br />
the fact that the overall length of the barcode is (ideally)<br />
equal to 95 times the base width, that each digit occupies a<br />
segment equal to seven times the base width, and that the<br />
first three bars are guard bars.<br />
We should stress the fact that, for a generic digit being<br />
considered, the value of o as computed in (5) is, in general,<br />
an incorrect estimate of the actual left edge of the digit<br />
segment, as a consequence of errors in the estimation of the<br />
end points ðoL;oRÞ together <strong>with</strong> image distortion as due,<br />
for example, to perspective. However, suppose for a<br />
moment that the estimated location o and minimum bar<br />
width w are indeed correct. Then, in order to read the value<br />
of the digit, we could simply compare the intensity IðnÞ<br />
<strong>with</strong>in the segment <strong>with</strong> the models M k<br />
o;w for 0 k 9, and<br />
pick the model that best fits the data. More precisely, we<br />
define the likelihood of the intensity <strong>with</strong>in a generic digit<br />
segment for symbol k (conditioned on o and w) as<br />
pkðIjo; wÞ /e D I;Mk o;w ; ð7Þ<br />
where IðnÞ represents the intensity profile of the considered<br />
scanline. The log-likelihood term D can be expressed as<br />
D I;M k<br />
o;w<br />
X<br />
¼ boþ8wc<br />
n¼do we<br />
D IðnÞ; M k<br />
o;wðnÞ ; ð8Þ<br />
where the variable n takes on only integer values (see Fig. 5).<br />
Note that this sum is computed over all pixels that fall <strong>with</strong>in<br />
the segment ½o w; o þ 8wŠ, which is the support of M k<br />
o;w ðxÞ.<br />
A variety of functions can be considered for the loglikelihood<br />
D modeling the discrepancy between model and<br />
observation. We use the following robust formulation,<br />
which gave good results in our experiments. First, the<br />
quantities w and b representing the mean of the largest<br />
50 percent and smallest 50 percent values of IðnÞ are<br />
computed, along <strong>with</strong> their variance 2 . Then,<br />
and<br />
DðIðnÞ; 1Þ ¼ ½maxðIðnÞ b; 0ÞŠ 2<br />
2 2<br />
DðIðnÞ; 1Þ ¼ ½minðIðnÞ w; 0ÞŠ 2<br />
2 2 : ð10Þ<br />
This function penalizes values of IðnÞ that are small<br />
when M k<br />
o;wðnÞ ¼1 or large when Mko;wðnÞ<br />
¼ 1. Note that<br />
this is not equivalent to binarizing the data. Indeed, the<br />
original value of IðnÞ can be recovered from DðIðnÞ;<br />
and DðIðnÞ; 1Þ.<br />
1Þ<br />
Digit segment—total likelihood. In order to compute the<br />
likelihood of an observed scanline for a given symbol, it is<br />
necessary to take the uncertainty about o and w into<br />
consideration. This uncertainty derives from the finite<br />
tolerance on the estimation of oL and oR. Assume, for<br />
example, that both oL and oR are computed <strong>with</strong> a tolerance<br />
of o. Then, barring deformations or perspective effects, o<br />
has a tolerance of o as well, whereas w has a tolerance of<br />
2 o=95.<br />
We approach this problem by first defining a probability<br />
density function pðo; wÞ over the space of deformations. We<br />
then compute the total likelihood pkðIÞ by averaging<br />
pkðIjo; wÞ over such density:<br />
ZZ<br />
pkðIÞ ¼ pkðIjo; wÞpðo; wÞ do dw: ð11Þ<br />
Computing this integral may seem like a daunting task,<br />
especially if it needs to be performed on an embedded<br />
system such as a cellphone. On the contrary, we show that<br />
due to the particular nature of the model M k and assuming<br />
a simple form for the prior pðo; wÞ, the integral in (11) can be<br />
computed exactly via numerical means <strong>with</strong> reasonably<br />
small complexity.<br />
Our derivation exploits the fact that DðI;M k<br />
o;wÞ is<br />
piecewise constant in the ðo; wÞ space. This, in turn, is due<br />
to the very nature of the scanline, which is itself piecewise<br />
constant: If the change in o and w is small enough, none of<br />
the boundaries di will “jump” to a different pixel. If we<br />
break up the sum in (8) into six pieces, corresponding to the<br />
segments in which M k<br />
o;wðxÞ takes on constant values of 1 or<br />
1, we notice that, <strong>with</strong>in segment ½di;diþ1Š, where di ¼<br />
o þ w Pi l¼0 rk l for 0 i 5 and having set rk 0 ¼ 1 and<br />
¼ 1, the function Mko;wðxÞ<br />
is identically equal to ð 1Þi .<br />
r k 5<br />
<strong>with</strong><br />
D I;M k<br />
o;w<br />
Ai ¼ Xbdic<br />
n¼ddi 1e<br />
¼ X5<br />
i¼1<br />
ð9Þ<br />
Ai; ð12Þ<br />
DðIðnÞ; ð 1Þ i Þ: ð13Þ
This article has been accepted for inclusion in a future issue of this journal. Content is final as presented, <strong>with</strong> the exception of pagination.<br />
6 IEEE TRANSACTIONS ON PATTERN ANALYSIS AND MACHINE INTELLIGENCE, VOL. 33, NO. X, XXXXXXX 2011<br />
Fig. 6. The space ðdo; dwÞ can be broken into polygons in which the<br />
conditional likelihoods pkðIjo; wÞ are constant. (a) shows this partition for<br />
symbol “2,” for which fr2 i g is f2; 1; 2; 2g. Each one of the four bars in a<br />
symbol defines a set of parallel lines in the space ðdo; dwÞ; for example,<br />
when the values of ðdo; dwÞ in (b) cross one of the red lines, the right<br />
boundary of the first bar crosses a pixel and, therefore, the likelihood<br />
changes. (c)-(d) show in red the sets of parallel lines corresponding to<br />
bars 2-4. The equations for these lines are easily computed; for the third<br />
1<br />
bar (d), for instance, we can write dw ¼ 2þ1þ2 do þ q. The final partition<br />
is shown in (a). Intuitively, if ðo1;w1Þ and ðo2;w2Þ fall <strong>with</strong>in the same cell<br />
of (a), the conditional likelihoods p2ðIjo1;w1Þ and p2ðIjo2;w2Þ are<br />
identical. In other words, instead of computing the integral in (11) over<br />
every point of the space, the problem can be made tractable by only<br />
considering one point per cell <strong>with</strong>out introducing any approximation<br />
(see Section 3.2).<br />
Hence, a variation of o or w determines a change of Ai (and<br />
therefore of pkðIjo; wÞ) only when it causes di 1 or di to cross<br />
over an integer value. Consequently, pkðIjo; wÞ is piecewise<br />
constant, and the integral in (11) can be computed exactly as<br />
a sum of a few dozen terms. Next, we show how to compute<br />
the terms in this sum.<br />
Let fV t kg be the minimum partition of the ðo; wÞ plane<br />
such that pkðIjo; wÞ is constant <strong>with</strong>in each cell V t k (<strong>with</strong> t<br />
representing the index of cells in the partition). Then,<br />
pkðIÞ / X<br />
e Dt<br />
ZZ<br />
pðo; wÞ do dw; ð14Þ<br />
t<br />
where Dt ¼ DðI;M k<br />
o;wÞ for any ðo; wÞ in Vtk . Note that the<br />
cells V t k are polygonal as they are defined by the lines of<br />
equation o þ wð Pi l¼1 rk l 1Þ ¼q, where q is any integer and<br />
i is any integer between 1 and 4 (see Fig. 6). The list of cells<br />
fV t kg, as well as the integral of pðo; wÞ <strong>with</strong>in each cell, can<br />
be computed offline and stored for online use. In fact, one<br />
easily sees that the cells form a periodic pattern (<strong>with</strong><br />
period equal to 1 both in o and w); hence only the cells<br />
<strong>with</strong>in such a period need to be stored.<br />
V t<br />
k<br />
Regarding the implementation of this procedure, the<br />
following observations are in order:<br />
1. The computation of the likelihood in (14) can be<br />
sped up by precomputing the sequences DðIðnÞ; 1Þ<br />
and DðIðnÞ; 1Þ. Then, for each cell, one only needs<br />
to add together selected samples from the two<br />
sequences. Suppose that (11) requires summing over<br />
Nj cells. For each cell V t j;k<br />
, the negative log-likelihood<br />
Dt needs to be computed, which requires two<br />
additions and two multiplications per sample, overall,<br />
2Nj additions and 2Nj multiplications per<br />
sample. However, it is easily seen that by precomputing<br />
DðIðnÞ; 1Þ and DðIðnÞ; 1Þ, each computation<br />
of Dt only requires one addition per sample. This<br />
reduces the computational weight to 2 þ Nj<br />
tions and four multiplications per sample.<br />
addi-<br />
2. At runtime, a specific set of cells is chosen from the<br />
list based on the tolerance o and w on the<br />
estimated values of o and w, which are easily<br />
derived from the tolerance of the estimated end<br />
points oL and oR. More precisely, we compute the<br />
sum in (14) over the cells that intersect the rectangle<br />
<strong>with</strong> sides ½o o; o þ oŠ and ½w w; w þ wŠ,<br />
3.<br />
where o and w are estimated as by (5).<br />
The integration of pðo; wÞ <strong>with</strong>in each cell result is<br />
particularly simple if pðo; wÞ is assumed to be<br />
uniform <strong>with</strong>in the considered rectangle in the<br />
ðo; wÞ space. In this case, the integral is proportional<br />
to the area of the polygonal cell, which can be easily<br />
computed and stored offline. In our implementation,<br />
we made use of this simple, yet effective model.<br />
As will be shown shortly, it is also useful to estimate, for<br />
each possible symbol k, the deformation parameters ðo; wÞ<br />
given the intensity profile IðnÞ <strong>with</strong>in a digit segment. We<br />
choose the least squares estimator ðok; wkÞ of these quantities<br />
(under the density pðo; wÞ), which is given by the conditional<br />
expectation. <strong>Using</strong> Bayes rule, this is equivalent to<br />
ZZ<br />
ðok; wkÞ<br />
¼ ðo; wÞ pkðIjo; wÞpðo; wÞ<br />
do dw<br />
pkðIÞ<br />
/ 1<br />
pkðIÞ<br />
X<br />
t<br />
e Dt<br />
ZZ<br />
V t<br />
k<br />
owpðo; wÞ do dw:<br />
ð15Þ<br />
The integrals in the above equation can be precomputed<br />
and stored for online use. If the assumption of uniformly<br />
distributed ðo; wÞ is made (as in point 3 above), then the<br />
terms in the sum are the centroids of the cells fV t k g.<br />
Imposing Spatial Coherence. Our model makes the simplifying<br />
initial assumption that the digit segments are equally<br />
spaced (see (5)-(6)). This also implies that the base width w<br />
is constant across the barcode. In practice, we should expect<br />
that the digit segment length may vary from segment to<br />
segment, generally <strong>with</strong>in the confidence intervals o and<br />
w. Ideally, however, the segment representing a given<br />
digit in the scanline (as computed from the estimates ok and<br />
wk) should be adjacent to (but nonoverlapping <strong>with</strong>) the<br />
neighboring segments. The choice of an incorrect value of k<br />
due to single-digit analysis is likely to result in a supported<br />
segment that does not fit together well <strong>with</strong> the other<br />
segments (see Fig. 7). This observation can be exploited by<br />
imposing a global constraint as follows:
This article has been accepted for inclusion in a future issue of this journal. Content is final as presented, <strong>with</strong> the exception of pagination.<br />
GALLO AND MANDUCHI: READING <strong>1D</strong> BARCODES WITH MOBILE PHONES USING DEFORMABLE TEMPLATES 7<br />
Fig. 7. The support segments ½o j;kðjÞ; o j;kðjÞ þ 7w j;kðjÞŠ, where kðjÞ are the<br />
maximizers of the total likelihood p j;kðjÞðIÞ for each digit index j, are shown<br />
in blue against the support segments corresponding to the sequence of<br />
values fkg minimizing the global cost C in (17), shown in green. Digits 5,<br />
6, and 11 are not correctly decoded and their position is therefore<br />
miscalculated (blue). The algorithm described in Section 3.2 successfully<br />
enforces global consistency and, thus, correct decoding (green). The red<br />
lines represent the original digit segments, obtained from (5)-(6). In order<br />
to provide a visual intuition of the intensity profile of the scanline under<br />
consideration, the latter was repeated vertically to form a gray-level<br />
image.<br />
Suppose that the jth digit takes value kðjÞ. (Note that we<br />
need to make the dependency on j explicit in our notation<br />
from now on.) The estimated deformation parameters<br />
ðoj;kðjÞ; wj;kðjÞÞ define the supported segment ½oj;kðjÞ; oj;kðjÞ þ<br />
7w j;kðjÞŠ. We define the overlap/gap extent between the jth<br />
and ðj þ 1Þth estimated digit segments as<br />
O j;kðjÞ;kjþ1 ¼jo j;kðjÞ þ 7w j;kðjÞ o jþ1;kðjþ1Þj: ð16Þ<br />
Now, define a global cost function as follows:<br />
CðfkgÞ ¼ X<br />
j<br />
O 2 j;kðjÞ;kðjþ1Þ log pj;kðjÞ; ð17Þ<br />
where is a balancing parameter and the sum extends to all<br />
digit segments in the left and right half of the barcode. ( was<br />
set to be equal to 0.1 in our experiments.) The cost function in<br />
(17) penalizes sequences of symbols that create large overlaps<br />
or gaps between two consecutive digit segments or that<br />
produce low values of likelihood. Dynamic programming<br />
can be used to minimize the cost function C over the space of<br />
sequences fkg of symbols. Fig. 7 shows the outcome of the<br />
application of this technique.<br />
4 IMPLEMENTATION AND TESTS<br />
We implemented and tested our algorithm both in Matlab<br />
and in Symbian OS, a platform used by several cellphone<br />
brands. In the following sections, we provide results in<br />
terms of accuracy and computational load for both<br />
implementations.<br />
4.1 Matlab Implementation<br />
Localization. The algorithm described in Section 3.1 proved<br />
rather robust in our experiments. Although the algorithm<br />
relies on the assumption that the user is holding the<br />
cellphone so that the bars are vertical in the image, it<br />
produces good results even when the phone is rotated at an<br />
angle. The maximum rotation angle for correct localization is<br />
bound by simple geometric considerations. Recall that<br />
localization comprises two steps: segmentation of the<br />
barcode image, followed by determination of the horizontal<br />
scanline segment used for decoding. The first step fails if the<br />
barcode is rotated by more than 45 degrees since, in that case,<br />
the horizontal image gradient has smaller magnitude than<br />
the vertical gradient (see Fig. 8d). Our experiments show that<br />
the segmentation generally fails for angles larger than<br />
40-45 degrees, depending on the overall quality of the image.<br />
Fig. 8. The localization algorithm assumes that the cellphone is held in an<br />
approximately vertical fashion. However, it proves robust to a large<br />
deviation from the ideal setup. (a) An image of a barcode at 37 degrees,<br />
(b) the corresponding energy map computed as described in Section 3.1,<br />
(c) a barcode at 45 degrees, and (d) the corresponding energy map. Note<br />
that, as long as the barcode’s angle is below 45 degrees, the map is still<br />
easy to segment, whereas the energy in the area corresponding to the<br />
barcode is dramatically low for angles from 45 degrees and above.<br />
The second step requires that the scanline intersect all of<br />
the bars, from the left to the right guard bars; since we<br />
extract an horizontal line, this becomes harder as the angle<br />
increases too much. In our tests, the scanline was correctly<br />
extracted for angles up to 30 degrees.<br />
We also characterize the performance of the localization<br />
algorithm in terms of its accuracy. For each image in the<br />
data sets, we manually selected the end points oL and oR<br />
and compared them <strong>with</strong> the output of our localization<br />
algorithm (see Fig. 9). Note that approximately 75 percent of<br />
the points are detected <strong>with</strong>in one pixel of the correct<br />
location. Approximately 10 percent of the points have a<br />
localization error of more than 10 pixels. In the case of these<br />
“gross errors,” the decoding algorithm typically breaks<br />
down. These situations are responsible for most of the<br />
failures in the experiments described below.<br />
Proportion<br />
50 %<br />
25 %<br />
Localization Accuracy<br />
0 %<br />
0 5 10 15 20+<br />
Error (in pixels)<br />
Fig. 9. Accuracy of the localization algorithm in pixels. The end points oL<br />
and oR were manually selected for each image in our data sets and<br />
compared <strong>with</strong> the output of the localization algorithm described in<br />
Section 3.1. The bin labeled “20þ” contains all of the pixels that were at<br />
least 20 pixels away from the ground truth.
This article has been accepted for inclusion in a future issue of this journal. Content is final as presented, <strong>with</strong> the exception of pagination.<br />
8 IEEE TRANSACTIONS ON PATTERN ANALYSIS AND MACHINE INTELLIGENCE, VOL. 33, NO. X, XXXXXXX 2011<br />
Fig. 10. Comparative results showing the number of barcodes correctly detected in the different data sets considered (on the left, the data sets from<br />
Tekin and Coughlan [10], on the right, our data sets). For each data set, the black, horizontal line indicates the total number of images.<br />
The execution time is only a function of the size of the<br />
image. Our Matlab implementation takes from approximately<br />
0.065 seconds for a 640 480 image to approximately<br />
0.21 seconds for a 1;152 864 image.<br />
Decoding. The localization algorithm is used to provide a<br />
single scanline segment together <strong>with</strong> its end points as the<br />
input to our reader. The maximum tolerance o at the end<br />
points oL and oR was set to 2w, where w, the initial<br />
estimate of the base width, was defined in (6). In practice,<br />
this means that we expect the localization algorithm to<br />
possibly miss up to one bar in both the start and end<br />
patterns. The minimum scanline width oR oL that our<br />
algorithm was able to decode was of 100 pixels. Note that<br />
this corresponds to a base width of only 1.05 pixels.<br />
The computational speed of the algorithm depends<br />
heavily on the scanline width. This is mostly due to the<br />
fact that the number of cells V t<br />
k depends on the tolerances<br />
o and w, which are proportional to the scanline width.<br />
For example, when the scanline width is equal to 100 pixels,<br />
then 25 cells are generated. However, in the case of a high<br />
resolution image of a barcode at a short distance, producing<br />
a scanline width of 1,128 pixels, 2,185 cells are generated. In<br />
order to reduce the number of cells to be processed, we<br />
implemented a simple variation of the algorithm by fixing<br />
the width of the first and last bars in the model to the<br />
minimum width considered. Remember that these are<br />
“overlap” bars <strong>with</strong> nearby digits and that they always<br />
have unitary width in the model M k . With this modification,<br />
the number of cells is reduced to 17 in the 100 pixel<br />
scanline width case and to 641 in the 1,128 pixel case. The<br />
computational speed of the decoder (excluding localization)<br />
ranges between 0.076 and 0.65 seconds.<br />
In order to assess the performance of the system, we tested<br />
it on a variety of images. Unfortunately, we could find only<br />
one barcode image database for comparative assessment. 1<br />
This database, which was created by Tekin and Coughlan, is<br />
accessible at www.ski.org/Rehab/Coughlan_lab/Barcode.<br />
The images are all of high resolution and each image was<br />
manually cropped around the barcode. The authors divided<br />
it into “Hard” and “Clean” subsets and showed results of<br />
their algorithm on both sets [10].<br />
In order to assess our system in other realistic situations,<br />
we gathered a number of images taken from two different<br />
cellphones, and created three new data sets. Data set 1<br />
contains images at high resolution (1;024 768) from a<br />
Nokia N95 cell phone. This device has autofocus capability,<br />
1. Wachenfeld et al. [12] claim to have assembled a barcode image<br />
database for public use, but we have not been granted access to it.<br />
although not all images collected were properly in focus<br />
(whether because the focus was on the wrong object or<br />
because the focusing algorithm failed), and some were<br />
affected by motion blur. Data set 2 contains images taken by<br />
the same cell phone, but at 640 480 resolution and highly<br />
compressed in JPEG (<strong>with</strong> apparent coding artifacts). Data<br />
set 3 contains images at 1;152 864 resolution taken <strong>with</strong> an<br />
older Nokia 7610 phone, <strong>with</strong> fixed focus. All three data sets<br />
have multiple pictures of several barcodes, taken from<br />
different distances and in different conditions.<br />
Our algorithm was tested against the algorithm of Tekin<br />
and Coughlan [10], for the “Hard” and “Clean” data set, as<br />
well as against two barcode reading softwares that are<br />
available online. The first one, from DataSymbol, 2 was also<br />
considered by Tekin and Coughlan [10]. The second one,<br />
from DTK, 3 was shown to produce impressive results. A<br />
third online software, from QualitySoft, was considered by<br />
Tekin and Coughlan [10], but we neglected comparison<br />
<strong>with</strong> it since it gives very poor results.<br />
Numerical results from our tests are presented in Fig. 10.<br />
Note that the checksum digit can be used to determine<br />
whether a barcode is correctly decoded. In all of the data<br />
sets, our algorithm outperforms the other techniques, in<br />
particular for the most challenging sets (Data set “Hard”<br />
and Data set 3). A sample of images correctly decoded by<br />
our algorithm is shown in Fig. 11, while examples of<br />
failures are shown in Fig. 12. Note that in many cases,<br />
failure was due to incorrect initial localization. Our<br />
algorithm correctly decodes barcodes even when the image<br />
quality is extremely poor, as can be appreciated by zooming<br />
in on the images.<br />
4.2 Symbian Implementation<br />
We implemented our algorithm in Symbian and tested it on<br />
a Nokia N95 8 GB device using VGA (640 480) still<br />
images. The localization algorithm is implemented exactly<br />
as in the Matlab version. As for the decoding algorithm, we<br />
implemented a minor modification concerning the storage<br />
of the polygons in Section 3.2. Indeed, storing the partition<br />
of the ðdo; dwÞ plane and intersecting it at runtime <strong>with</strong> a<br />
rectangle whose sides are given by the tolerances described<br />
in Section 4.1 would be computationally intensive. Therefore,<br />
we only store area and centroid location of each<br />
polygon. Then, at runtime, we compute (11) using all of the<br />
polygons whose centroid falls <strong>with</strong>in mentioned rectangle.<br />
While dramatically decreasing the search time, based on<br />
2. http://www.datasymbol.com.<br />
3. http://www.dtksoft.com.
This article has been accepted for inclusion in a future issue of this journal. Content is final as presented, <strong>with</strong> the exception of pagination.<br />
GALLO AND MANDUCHI: READING <strong>1D</strong> BARCODES WITH MOBILE PHONES USING DEFORMABLE TEMPLATES 9<br />
Fig. 11. Example of barcodes correctly decoded by our algorithm from<br />
the three data sets described in Section 4.1: The crop outs in the first<br />
row are from 1;024 768 images (data set 1), those in the second are<br />
from 640 480 images (data set 2), and those in the third from 1;152<br />
864 images (data set 3). These crop outs are the output of the<br />
localization algorithm described in Section 3.1. The green stars indicate<br />
ðoL;oRÞ, the original estimates for the end points of the scanline. Please<br />
note the extremely poor quality of the images by zooming in.<br />
our experiments, this change does not seem to affect the<br />
accuracy of the algorithm.<br />
From the moment that the frame is received from the<br />
camera and the analysis begins, our algorithm takes an<br />
average of 400-500 ms for both localization and decoding.<br />
(Localization is only a function of the image size and it takes<br />
approximately 250 ms for a VGA image.) This shows that<br />
our algorithm is suitable for mobile applications and also<br />
proves that, in the event of failure at reading the barcode,<br />
the process can be quickly repeated.<br />
It is important to note that our algorithm allows the user<br />
to take a shot of the scene <strong>with</strong>out strong constraints on the<br />
location or distance of the barcode, as long as the resolution<br />
is sufficient for decoding. This is in contrast to other<br />
mainstream applications, such as RedLaser for iPhone [1],<br />
which require the user to carefully maneuver the cellphone<br />
in close proximity to the barcode to center it and to<br />
maximize its apparent size in the viewfinder frame. Moreover,<br />
the user needs to wait, slightly adjusting the position<br />
of the phone, until a frame is grabbed that can be<br />
successfully decoded by the algorithm.<br />
The barcodes printed on commercial products have<br />
sizes typically ranging from 2.5 to 4 cm, which directly<br />
affects the maximum distance at which it can be correctly<br />
read. Given the field of view of the Nokia N95, our<br />
implementation can successfully localize and read barcodes<br />
that are 2.5 cm wide when they are imaged from up<br />
to 30 cm away. <strong>Barcodes</strong> that are 4 cm wide can be<br />
decoded from up to 45 cm. This provides an advantage<br />
over other methods in cases where it might not be possible<br />
to place the phone in close proximity to the barcode, a<br />
strict requirement of RedLaser and similar applications.<br />
5 CONCLUSIONS<br />
We have presented a new algorithm for barcode decoding<br />
(localization and reading) that can deal <strong>with</strong> images that are<br />
blurred, noisy, and <strong>with</strong> low resolution.<br />
Our localization technique is fast and accurate even for<br />
cluttered images; in more than 75 percent of the images in our<br />
challenging data sets, the detected end points of the barcodes<br />
are <strong>with</strong>in one pixel of their actual location, a higher accuracy<br />
than that required by our decoding algorithm.<br />
Unlike previous approaches, our algorithm does not<br />
binarize the image, thus sidestepping a critical and often<br />
Fig. 12. Example of images in which our algorithm fails from data sets 1<br />
(1;024 768) and 3 (1;152 864). These crop outs are the output of the<br />
localization algorithm described in Section 3.1. The green stars indicate<br />
ðoL;oRÞ, the original estimates for the end points of the scanline.<br />
error-prone, early commitment procedure. We use deformable<br />
templates to represent each digit of the barcode,<br />
averaging over the set of all expected deformations. A final<br />
procedure for global spatial coherence helps reduce the risk<br />
of errors at the individual digit level. We extensively tested<br />
our algorithm, showing improved performance <strong>with</strong> respect<br />
to other state-of-the-art software and algorithms,<br />
especially for the most challenging images. We also made<br />
the data sets public to allow other researchers to test and<br />
compare their methods.<br />
Implemented on a Nokia N95, the complete reading<br />
algorithm is executed in less than 0.5 seconds and is<br />
therefore suitable for mobile vision applications.<br />
APPENDIX<br />
UPC-A BARCODES—SYNTAX<br />
UPC-A is a technology to encode numbers <strong>with</strong> 12 decimal<br />
digits (symbols) as an alternating sequence of black bars and<br />
white bars (spaces) <strong>with</strong> different widths. (The last digit is an<br />
error correcting check digit which can be used to detect<br />
decoding errors.) Each bar may have width equal to r w,<br />
where r (the module width) is an integer between 1 and 4,<br />
and w, the base width (sometime called X-dimension), is the<br />
width of the narrowest bar. The code is divided into two<br />
halves separated by a sequence of three spaces and two bars<br />
(central guard bars), all of unitary module width. At the two<br />
ends of the barcode there is a sequence of two bars<br />
separated by a space, all of unitary module width (lateral<br />
guard bars). The lateral guard bars are sided by a space of<br />
width equal to at least nine times the base width (quiet zone),<br />
although this requirement is sometimes violated in realworld<br />
instances. Between the lateral and the central guard<br />
bars, the code is divided into six equally spaced digit<br />
segments, or simply digits, each of which has length equal to<br />
seven times the base width. Thus, the overall length of the<br />
barcode is equal to 95 base widths. Each digit represents<br />
one symbol as a sequence of two spaces and two bars. The<br />
value k of a symbol is encoded by the sequence of module<br />
widths ðrk 1 ;rk2 ;rk3 ;rk4 Þ of the bars and spaces in the digit<br />
segment. The standardized UPC-A sequences for the left<br />
half of the code are shown in Fig. 4. In the right half of the<br />
code, the same sequence of widths is used to encode a<br />
symbol; however, the role of spaces and bars is inverted.<br />
ACKNOWLEDGMENTS<br />
This material is based upon work supported in part by the<br />
US National Science Foundation (NSF) under Grant No. IIS-<br />
0835645 and in part by the the US National Institutes of<br />
Health under Grant 1 R21 EY017003-01A1.
REFERENCES<br />
This article has been accepted for inclusion in a future issue of this journal. Content is final as presented, <strong>with</strong> the exception of pagination.<br />
10 IEEE TRANSACTIONS ON PATTERN ANALYSIS AND MACHINE INTELLIGENCE, VOL. 33, NO. X, XXXXXXX 2011<br />
[1] Redlaser, http://redlaser.com/, Feb. 2010.<br />
[2] UCSC UPC Dataset, http://soe.ucsc.edu/~orazio/Data/UCSC_<br />
UPC_Dataset.zip, Mar. 2010.<br />
[3] R. Adelmann, M. Langheinrich, and C. Flörkemeier, “A Toolkit for<br />
Bar-Code Recognition and Resolving on Camera <strong>Phones</strong>—Jump<br />
Starting the Internet of Things,” Proc. Informatik Workshop <strong>Mobile</strong><br />
and Embedded Interactive Systems, 2006.<br />
[4] D. Chai and F. Hock, “Locating and Decoding EAN-13 <strong>Barcodes</strong><br />
from Images Captured by Digital Cameras,” Proc. Int’l Conf.<br />
Information, Comm., and Signal Processing, pp. 1595-1599, 2005.<br />
[5] S. Kresic-Juric, D. Madej, and F. Santosa, “Applications of Hidden<br />
Markov Models in Bar Code Decoding,” Pattern Recognition<br />
Letters, vol. 27, no. 14, pp. 1665-1672, 2006.<br />
[6] R. Muniz, L. Junco, and A. Otero, “A Robust Software Barcode<br />
Reader <strong>Using</strong> the Hough Transform,” Proc. Int’l Conf. Information<br />
Intelligence and Systems ’99, pp. 313-319, 1999.<br />
[7] E. Ohbuchi, H. Hanaizumi, and L. Hock, “Barcode Readers <strong>Using</strong><br />
the Camera Device in <strong>Mobile</strong> <strong>Phones</strong>,” Proc. IEEE Third Int’l Conf.<br />
Cyberworlds, pp. 260-265, 2004.<br />
[8] N. Otsu, “A Threshold Selection Method from Gray-Level<br />
Histograms,” IEEE Trans. Systems, Man, and Cybernetics, vol. 9,<br />
no. 1, pp. 62-66, Jan. 1979.<br />
[9] T. Pavlidis, J. Swartz, and Y. Wang, “Fundamentals of Bar Code<br />
Information Theory,” Computer, vol. 23, no. 4, pp. 74-86, 1990.<br />
[10] E. Tekin and J. Coughlan, “A Bayesian Algorithm for <strong>Reading</strong> <strong>1D</strong><br />
<strong>Barcodes</strong>,” Proc. Sixth Canadian Conf. Computer and Robot Vision,<br />
2009.<br />
[11] A. Tropf and D. Chai, “Locating 1-D Bar Codes in DCT-Domain,”<br />
Proc. IEEE Int’l Conf. Acoustics, Speech and Signal Processing, vol. 2,<br />
2006.<br />
[12] S. Wachenfeld, S. Terlunen, and X. Jiang, “Robust Recognition of<br />
1-D <strong>Barcodes</strong> <strong>Using</strong> Camera <strong>Phones</strong>,” Proc. Int’l Conf. Pattern<br />
Recognition, pp. 1-4, 2008.<br />
[13] K. Wang, Y. Zou, and H. Wang, “<strong>1D</strong> Bar Code <strong>Reading</strong> on Camera<br />
<strong>Phones</strong>,” Int’l J. Image and Graphics, vol. 7, no. 3, pp. 529-550, July<br />
2007.<br />
[14] C. Zhang, J. Wang, S. Han, M. Yi, and Z. Zhang, “Automatic Real-<br />
Time Barcode Localization in Complex Scenes,” Proc. Int’l Conf.<br />
Image Processing, pp. 497-500, 2006.<br />
member of the IEEE.<br />
Orazio Gallo received the Laurea degree (MS)<br />
in biomedical engineering from the Politecnico di<br />
Milano, Italy, in 2004. He then worked on a novel<br />
bioimaging technique at the Smith-Kettlewell<br />
Eye Research Institute from 2004 to 2006.<br />
Currently, he is working toward the PhD degree<br />
in the Department of Computer Engineering at<br />
the University of California, Santa Cruz. His<br />
main research interests are computer vision and<br />
computational photography. He is a student<br />
Roberto Manduchi received the PhD degree in<br />
electrical engineering from the University of<br />
Padova, Italy, in 1993. Currently, he is an<br />
associate professor of computer engineering at<br />
the University of California, Santa Cruz (UCSC).<br />
Prior to joining UCSC in 2001, he worked at<br />
Apple Computer, Inc., and at the NASA Jet<br />
Propulsion Laboratory.<br />
. For more information on this or any other computing topic,<br />
please visit our Digital Library at www.computer.org/publications/dlib.