

Age-standardized incidence rates by histological type - IARC
Age-standardized incidence rates by histological type - IARC
Age-standardized incidence rates by histological type - IARC

Create successful ePaper yourself
Turn your PDF publications into a flip-book with our unique Google optimized e-Paper software.
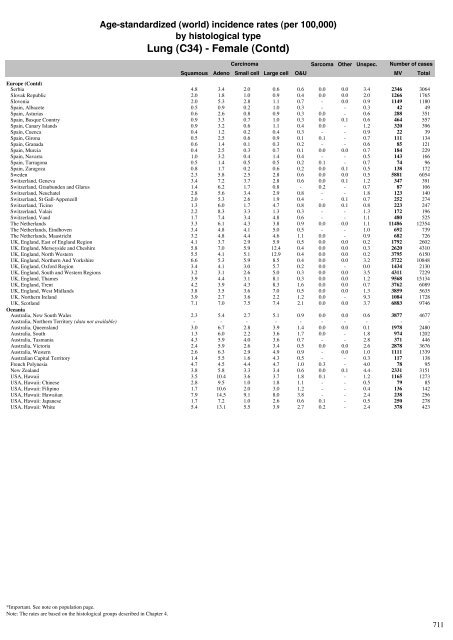
<strong>Age</strong>-<strong>standardized</strong> (world) <strong>incidence</strong> <strong>rates</strong> (per 100,000)<br />
<strong>by</strong> <strong>histological</strong> <strong>type</strong><br />
Lung (C34) - Female (Contd)<br />
Carcinoma<br />
Sarcoma Other Unspec.<br />
Number of cases<br />
Squamous Adeno Small cell Large cell O&U MV Total<br />
Europe (Contd)<br />
Serbia 4.8 3.4 2.0 0.6 0.6 0.0 0.0 3.4 2346 3064<br />
Slovak Republic 2.0 1.8 1.0 0.9 0.4 0.0 0.0 2.0 1266 1765<br />
Slovenia 2.0 5.3 2.8 1.1 0.7 - 0.0 0.9 1149 1180<br />
Spain, Albacete 0.5 0.9 0.2 1.0 0.3 - - 0.3 42 49<br />
Spain, Asturias 0.6 2.6 0.8 0.9 0.3 0.0 - 0.6 288 351<br />
Spain, Basque Country 0.9 3.3 0.7 1.0 0.3 0.0 0.1 0.6 464 557<br />
Spain, Canary Islands 0.9 3.2 0.6 1.1 0.4 0.0 - 1.2 320 396<br />
Spain, Cuenca 0.4 1.2 0.2 0.4 0.3 - - 0.9 22 39<br />
Spain, Girona 0.5 2.5 0.6 0.9 0.1 0.1 - 0.7 111 134<br />
Spain, Granada 0.6 1.4 0.1 0.3 0.2 - - 0.6 85 121<br />
Spain, Murcia 0.4 2.5 0.3 0.7 0.1 0.0 0.0 0.7 184 229<br />
Spain, Navarra 1.0 3.2 0.4 1.4 0.4 - - 0.5 143 166<br />
Spain, Tarragona 0.5 1.4 0.5 0.5 0.2 0.1 - 0.7 74 96<br />
Spain, Zaragoza 0.8 1.7 0.2 0.6 0.2 0.0 0.1 0.5 138 172<br />
Sweden 2.3 5.8 2.5 2.8 0.6 0.0 0.0 0.5 5881 6054<br />
Switzerland, Geneva 3.4 7.2 3.7 2.8 0.6 0.0 0.1 1.2 347 391<br />
Switzerland, Graubunden and Glarus 1.4 6.2 1.7 0.8 - 0.2 - 0.7 87 106<br />
Switzerland, Neuchatel 2.8 5.6 3.4 2.9 0.8 - - 1.8 123 140<br />
Switzerland, St Gall-Appenzell 2.0 5.3 2.6 1.9 0.4 - 0.1 0.7 252 274<br />
Switzerland, Ticino 1.3 6.0 1.7 4.7 0.8 0.0 0.1 0.8 223 247<br />
Switzerland, Valais 2.2 8.3 3.3 1.3 0.3 - - 1.3 172 196<br />
Switzerland, Vaud 1.7 7.4 3.4 4.8 0.6 - - 1.1 480 525<br />
The Netherlands 3.3 6.1 4.3 3.8 0.9 0.0 0.0 1.1 11486 12354<br />
The Netherlands, Eindhoven 3.4 4.8 4.1 5.0 0.5 - - 1.0 692 739<br />
The Netherlands, Maastricht 3.2 4.8 4.4 4.6 1.1 0.0 - 0.9 682 726<br />
UK, England, East of England Region 4.1 3.7 2.9 5.9 0.5 0.0 0.0 0.2 1792 2602<br />
UK, England, Merseyside and Cheshire 5.8 7.0 5.9 12.4 0.4 0.0 0.0 0.3 2620 4310<br />
UK, England, North Western 5.5 4.1 5.1 12.9 0.4 0.0 0.0 0.2 3795 6150<br />
UK, England, Northern And Yorkshire 6.6 5.3 5.9 8.5 0.4 0.0 0.0 3.2 5722 10848<br />
UK, England, Oxford Region 3.4 4.1 3.0 5.7 0.2 0.0 - 0.0 1434 2130<br />
UK, England, South and Western Regions 3.2 3.1 2.6 5.0 0.3 0.0 0.0 3.5 4311 7229<br />
UK, England, Thames 3.9 4.4 3.1 8.1 0.3 0.0 0.0 1.2 9568 15134<br />
UK, England, Trent 4.2 3.9 4.3 8.3 1.6 0.0 0.0 0.7 3762 6089<br />
UK, England, West Midlands 3.8 3.5 3.6 7.0 0.5 0.0 0.0 1.3 3859 5635<br />
UK, Northern Ireland 3.9 2.7 3.6 2.2 1.2 0.0 - 9.3 1084 1728<br />
UK, Scotland 7.1 7.0 7.5 7.4 2.1 0.0 0.0 3.7 6883 9746<br />
Oceania<br />
Australia, New South Wales 2.3 5.4 2.7 5.1 0.9 0.0 0.0 0.6 3877 4677<br />
Australia, Northern Territory (data not available) - - - - - - - - - -<br />
Australia, Queensland 3.0 6.7 2.8 3.9 1.4 0.0 0.0 0.1 1978 2480<br />
Australia, South 1.3 6.0 2.2 3.6 1.7 0.0 - 1.8 974 1202<br />
Australia, Tasmania 4.3 5.9 4.0 3.6 0.7 - - 2.8 371 446<br />
Australia, Victoria 2.4 5.9 2.6 3.4 0.5 0.0 0.0 2.6 2878 3676<br />
Australia, Western 2.6 6.3 2.9 4.9 0.9 - 0.0 1.0 1111 1339<br />
Australian Capital Territory 1.4 5.5 1.6 4.3 0.5 - - 0.3 117 138<br />
French Polynesia 4.7 4.5 4.4 4.7 1.0 0.3 - 4.0 78 95<br />
New Zealand 3.8 5.8 3.3 3.4 0.6 0.0 0.1 4.4 2331 3151<br />
USA, Hawaii 3.5 10.4 3.6 3.7 1.8 0.1 - 1.2 1165 1273<br />
USA, Hawaii: Chinese 2.8 9.5 1.0 1.8 1.1 - - 0.5 79 85<br />
USA, Hawaii: Filipino 1.7 10.6 2.0 3.0 1.2 - - 0.4 136 142<br />
USA, Hawaii: Hawaiian 7.9 14.5 9.1 8.0 3.8 - - 2.4 238 256<br />
USA, Hawaii: Japanese 1.7 7.2 1.0 2.6 0.6 0.1 - 0.5 250 278<br />
USA, Hawaii: White 5.4 13.1 5.5 3.9 2.7 0.2 - 2.4 378 423<br />
*Important. See note on population page.<br />
Note: The <strong>rates</strong> are based on the <strong>histological</strong> groups described in Chapter 4.<br />
Cancer Incidence in Five Continents Vol. IX, <strong>IARC</strong> 2008<br />
653<br />
711


