

Age-standardized and cumulative incidence rates (three-digit ... - IARC
Age-standardized and cumulative incidence rates (three-digit ... - IARC
Age-standardized and cumulative incidence rates (three-digit ... - IARC

Create successful ePaper yourself
Turn your PDF publications into a flip-book with our unique Google optimized e-Paper software.
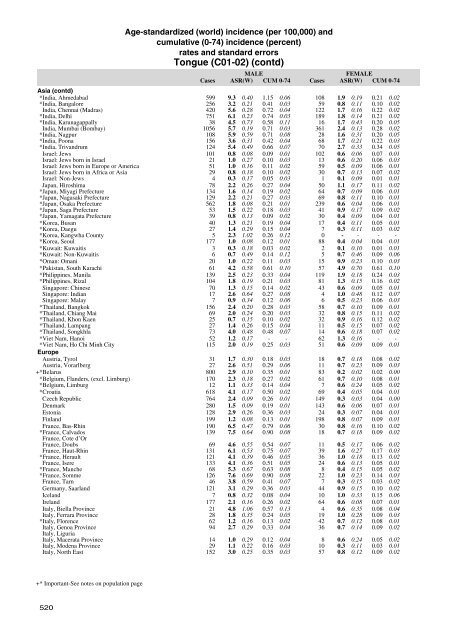
<strong>Age</strong>-<strong>st<strong>and</strong>ardized</strong> (world) <strong>incidence</strong> (per 100,000) <strong>and</strong><br />
<strong>cumulative</strong> (0-74) <strong>incidence</strong> (percent)<br />
<strong>rates</strong> <strong>and</strong> st<strong>and</strong>ard errors<br />
Tongue (C01-02) (contd)<br />
MALE<br />
Cases ASR(W) CUM 0-74<br />
FEMALE<br />
Cases ASR(W) CUM 0-74<br />
Asia (contd)<br />
*India, Ahmedabad 599 9.3 0.40 1.15 0.06 108 1.9 0.19 0.21 0.02<br />
*India, Bangalore 256 3.2 0.21 0.41 0.03 59 0.8 0.11 0.10 0.02<br />
India, Chennai (Madras) 420 5.6 0.28 0.72 0.04 122 1.7 0.16 0.22 0.02<br />
*India, Delhi 751 6.1 0.23 0.74 0.03 189 1.8 0.14 0.21 0.02<br />
*India, Karunagappally 38 4.5 0.73 0.58 0.11 16 1.7 0.43 0.20 0.05<br />
India, Mumbai (Bombay) 1056 5.7 0.19 0.71 0.03 361 2.4 0.13 0.28 0.02<br />
*India, Nagpur 108 5.9 0.59 0.71 0.08 28 1.6 0.31 0.20 0.05<br />
*India, Poona 156 3.6 0.31 0.42 0.04 68 1.7 0.21 0.22 0.03<br />
*India, Triv<strong>and</strong>rum 124 5.4 0.49 0.66 0.07 70 2.7 0.33 0.34 0.05<br />
Israel: Jews 101 0.8 0.08 0.09 0.01 102 0.6 0.06 0.07 0.01<br />
Israel: Jews born in Israel 21 1.0 0.27 0.10 0.03 13 0.6 0.20 0.06 0.03<br />
Israel: Jews born in Europe or America 51 1.0 0.16 0.11 0.02 59 0.5 0.09 0.06 0.01<br />
Israel: Jews born in Africa or Asia 29 0.8 0.18 0.10 0.02 30 0.7 0.13 0.07 0.02<br />
Israel: Non-Jews 4 0.3 0.17 0.05 0.03 1 0.1 0.09 0.01 0.01<br />
Japan, Hiroshima 78 2.2 0.26 0.27 0.04 50 1.1 0.17 0.11 0.02<br />
*Japan, Miyagi Prefecture 134 1.6 0.14 0.19 0.02 64 0.7 0.09 0.06 0.01<br />
*Japan, Nagasaki Prefecture 129 2.2 0.21 0.27 0.03 69 0.8 0.11 0.10 0.01<br />
*Japan, Osaka Prefecture 562 1.8 0.08 0.21 0.01 239 0.6 0.04 0.06 0.01<br />
*Japan, Saga Prefecture 53 1.5 0.22 0.18 0.03 41 0.9 0.17 0.09 0.02<br />
*Japan, Yamagata Prefecture 39 0.8 0.13 0.09 0.02 30 0.4 0.09 0.04 0.01<br />
*Korea, Busan 40 1.3 0.21 0.19 0.04 17 0.4 0.11 0.05 0.01<br />
*Korea, Daegu 27 1.4 0.29 0.15 0.04 7 0.3 0.11 0.03 0.02<br />
*Korea, Kangwha County 5 2.3 1.02 0.26 0.12 0 - - - -<br />
*Korea, Seoul 177 1.0 0.08 0.12 0.01 88 0.4 0.04 0.04 0.01<br />
*Kuwait: Kuwaitis 3 0.3 0.18 0.03 0.02 2 0.1 0.10 0.01 0.01<br />
*Kuwait: Non-Kuwaitis 6 0.7 0.49 0.14 0.12 5 0.7 0.46 0.09 0.06<br />
*Oman: Omani 20 1.0 0.22 0.11 0.03 15 0.9 0.23 0.10 0.03<br />
*Pakistan, South Karachi 61 4.2 0.58 0.61 0.10 57 4.9 0.70 0.61 0.10<br />
*Philippines, Manila 139 2.5 0.23 0.33 0.04 119 1.9 0.18 0.24 0.03<br />
*Philippines, Rizal 104 1.8 0.19 0.21 0.03 81 1.3 0.15 0.16 0.02<br />
Singapore: Chinese 70 1.3 0.15 0.14 0.02 43 0.6 0.09 0.05 0.01<br />
Singapore: Indian 17 2.6 0.64 0.27 0.08 4 1.0 0.48 0.12 0.07<br />
Singapore: Malay 7 0.9 0.34 0.12 0.06 6 0.5 0.23 0.06 0.03<br />
*Thail<strong>and</strong>, Bangkok 156 2.4 0.20 0.28 0.03 58 0.7 0.10 0.09 0.01<br />
*Thail<strong>and</strong>, Chiang Mai 69 2.0 0.24 0.20 0.03 32 0.8 0.15 0.11 0.02<br />
*Thail<strong>and</strong>, Khon Kaen 25 0.7 0.15 0.10 0.02 32 0.9 0.16 0.12 0.02<br />
*Thail<strong>and</strong>, Lampang 27 1.4 0.26 0.15 0.04 11 0.5 0.15 0.07 0.02<br />
*Thail<strong>and</strong>, Songkhla 73 4.0 0.48 0.48 0.07 14 0.6 0.18 0.07 0.02<br />
*Viet Nam, Hanoi 52 1.2 0.17 - - 62 1.3 0.16 - -<br />
*Viet Nam, Ho Chi Minh City 115 2.0 0.19 0.25 0.03 51 0.6 0.09 0.09 0.01<br />
Europe<br />
Austria, Tyrol 31 1.7 0.30 0.18 0.03 18 0.7 0.18 0.08 0.02<br />
Austria, Vorarlberg 27 2.6 0.51 0.29 0.06 11 0.7 0.23 0.09 0.03<br />
+*Belarus 800 2.9 0.10 0.35 0.01 83 0.2 0.02 0.02 0.00<br />
*Belgium, Fl<strong>and</strong>ers, (excl. Limburg) 170 2.3 0.18 0.27 0.02 61 0.7 0.10 0.08 0.01<br />
*Belgium, Limburg 12 1.1 0.33 0.14 0.04 7 0.6 0.24 0.05 0.02<br />
*Croatia 618 4.1 0.17 0.50 0.02 69 0.4 0.05 0.04 0.01<br />
Czech Republic 764 2.4 0.09 0.26 0.01 149 0.3 0.03 0.04 0.00<br />
Denmark 280 1.5 0.09 0.19 0.01 143 0.6 0.06 0.07 0.01<br />
Estonia 128 2.9 0.26 0.36 0.03 24 0.3 0.07 0.04 0.01<br />
Finl<strong>and</strong> 199 1.2 0.08 0.13 0.01 198 0.8 0.07 0.09 0.01<br />
France, Bas-Rhin 190 6.5 0.47 0.79 0.06 30 0.8 0.16 0.10 0.02<br />
*France, Calvados 139 7.5 0.64 0.90 0.08 18 0.7 0.18 0.09 0.02<br />
France, Cote d’Or<br />
France, Doubs 69 4.6 0.55 0.54 0.07 11 0.5 0.17 0.06 0.02<br />
France, Haut-Rhin 131 6.1 0.53 0.75 0.07 39 1.6 0.27 0.17 0.03<br />
*France, Herault 121 4.1 0.39 0.46 0.05 36 1.0 0.18 0.13 0.02<br />
France, Isere 133 4.1 0.36 0.51 0.05 24 0.6 0.13 0.05 0.01<br />
*France, Manche 68 5.3 0.67 0.63 0.08 8 0.4 0.15 0.05 0.02<br />
*France, Somme 126 7.6 0.69 0.90 0.08 22 1.0 0.23 0.14 0.03<br />
France, Tarn 46 3.8 0.59 0.41 0.07 7 0.3 0.15 0.03 0.02<br />
Germany, Saarl<strong>and</strong> 121 3.1 0.29 0.36 0.03 44 0.9 0.15 0.10 0.02<br />
Icel<strong>and</strong> 7 0.8 0.32 0.08 0.04 10 1.0 0.33 0.15 0.06<br />
Irel<strong>and</strong> 177 2.1 0.16 0.26 0.02 64 0.6 0.08 0.07 0.01<br />
Italy, Biella Province 21 4.8 1.06 0.57 0.13 4 0.6 0.35 0.08 0.04<br />
Italy, Ferrara Province 28 1.8 0.35 0.24 0.05 19 1.0 0.28 0.09 0.03<br />
*Italy, Florence 62 1.2 0.16 0.13 0.02 42 0.7 0.12 0.08 0.01<br />
Italy, Genoa Province 94 2.7 0.29 0.33 0.04 36 0.7 0.14 0.09 0.02<br />
Italy, Liguria<br />
Italy, Macerata Province 14 1.0 0.29 0.12 0.04 8 0.6 0.24 0.05 0.02<br />
Italy, Modena Province 29 1.1 0.22 0.16 0.03 10 0.3 0.11 0.03 0.01<br />
Italy, North East 152 3.0 0.25 0.35 0.03 57 0.8 0.12 0.09 0.02<br />
+* Important-See notes on population page<br />
520


