Growth and study of some gel grown group II single crystals of iodate
Growth and study of some gel grown group II single crystals of iodate
Growth and study of some gel grown group II single crystals of iodate

You also want an ePaper? Increase the reach of your titles
YUMPU automatically turns print PDFs into web optimized ePapers that Google loves.
464<br />
Sharda J Shitole <strong>and</strong> K B Saraf<br />
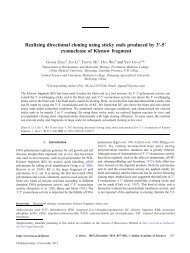
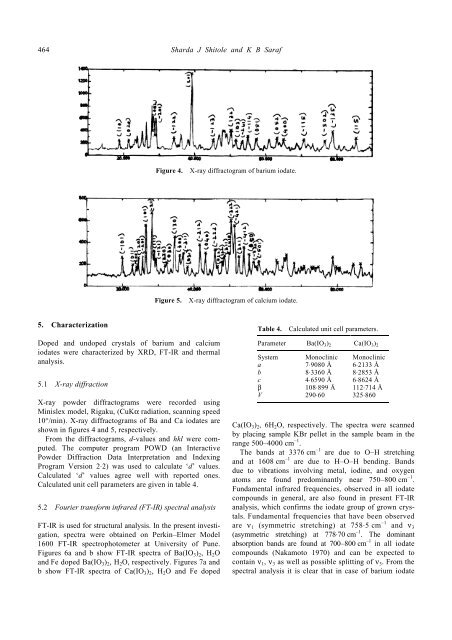
Figure 4. X-ray diffractogram <strong>of</strong> barium <strong>iodate</strong>.<br />
Figure 5. X-ray diffractogram <strong>of</strong> calcium <strong>iodate</strong>.<br />
5. Characterization<br />
Doped <strong>and</strong> undoped <strong>crystals</strong> <strong>of</strong> barium <strong>and</strong> calcium<br />
<strong>iodate</strong>s were characterized by XRD, FT-IR <strong>and</strong> thermal<br />
analysis.<br />
5.1 X-ray diffraction<br />
X-ray powder diffractograms were recorded using<br />
Minislex model, Rigaku, (CuKα radiation, scanning speed<br />
10°/min). X-ray diffractograms <strong>of</strong> Ba <strong>and</strong> Ca <strong>iodate</strong>s are<br />
shown in figures 4 <strong>and</strong> 5, respectively.<br />
From the diffractograms, d-values <strong>and</strong> hkl were computed.<br />
The computer program POWD (an Interactive<br />
Powder Diffraction Data Interpretation <strong>and</strong> Indexing<br />
Program Version 2⋅2) was used to calculate ‘d’ values.<br />
Calculated ‘d’ values agree well with reported ones.<br />
Calculated unit cell parameters are given in table 4.<br />
5.2 Fourier transform infrared (FT-IR) spectral analysis<br />
FT-IR is used for structural analysis. In the present investigation,<br />
spectra were obtained on Perkin–Elmer Model<br />
1600 FT-IR spectrophotometer at University <strong>of</strong> Pune.<br />
Figures 6a <strong>and</strong> b show FT-IR spectra <strong>of</strong> Ba(IO 3 ) 2 , H 2 O<br />
<strong>and</strong> Fe doped Ba(IO 3 ) 2 , H 2 O, respectively. Figures 7a <strong>and</strong><br />
b show FT-IR spectra <strong>of</strong> Ca(IO 3 ) 2 , H 2 O <strong>and</strong> Fe doped<br />
Table 4. Calculated unit cell parameters.<br />
Parameter Ba(IO 3 ) 2 Ca(IO 3 ) 2<br />
System Monoclinic Monoclinic<br />
a 7⋅9080 Å 6⋅2133 Å<br />
b 8⋅3360 Å 8⋅2853 Å<br />
c 4⋅6590 Å 6⋅8624 Å<br />
β 108⋅899 Å 112⋅714 Å<br />
V 290⋅60 325⋅860<br />
Ca(IO 3 ) 2 , 6H 2 O, respectively. The spectra were scanned<br />
by placing sample KBr pellet in the sample beam in the<br />
range 500–4000 cm –1 .<br />
The b<strong>and</strong>s at 3376 cm –1 are due to O–H stretching<br />
<strong>and</strong> at 1608 cm –1 are due to H–O–H bending. B<strong>and</strong>s<br />
due to vibrations involving metal, iodine, <strong>and</strong> oxygen<br />
atoms are found predominantly near 750–800 cm –1 .<br />
Fundamental infrared frequencies, observed in all <strong>iodate</strong><br />
compounds in general, are also found in present FT-IR<br />
analysis, which confirms the <strong>iodate</strong> <strong>group</strong> <strong>of</strong> <strong>grown</strong> <strong>crystals</strong>.<br />
Fundamental frequencies that have been observed<br />
are ν 1 (symmetric stretching) at 758⋅5 cm –1 <strong>and</strong> ν 3<br />
(asymmetric stretching) at 778⋅70 cm –1 . The dominant<br />
absorption b<strong>and</strong>s are found at 700–800 cm –1 in all <strong>iodate</strong><br />
compounds (Nakamoto 1970) <strong>and</strong> can be expected to<br />
contain ν 1 , ν 3 as well as possible splitting <strong>of</strong> ν 3 . From the<br />
spectral analysis it is clear that in case <strong>of</strong> barium <strong>iodate</strong>