An Evaluation of the Analysis of Monazite and REE ... - ICDD
An Evaluation of the Analysis of Monazite and REE ... - ICDD
An Evaluation of the Analysis of Monazite and REE ... - ICDD

You also want an ePaper? Increase the reach of your titles
YUMPU automatically turns print PDFs into web optimized ePapers that Google loves.
Copyright (C) JCPDS-International Centre for Diffraction Data 1999<br />
829<br />
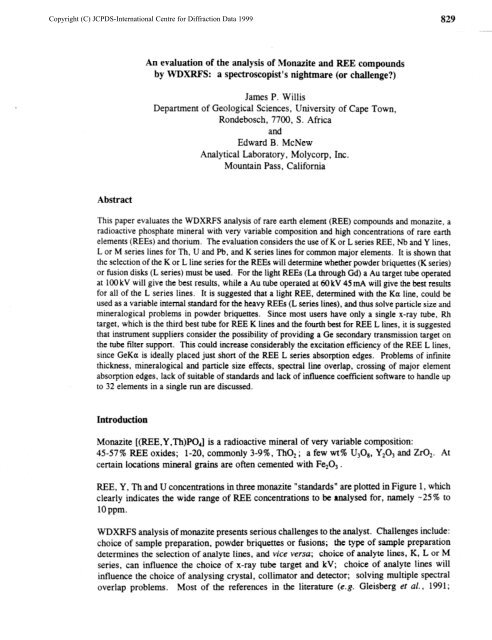
<strong>An</strong> evaluation <strong>of</strong> <strong>the</strong> analysis <strong>of</strong> <strong>Monazite</strong> <strong>and</strong> <strong>REE</strong> compounds<br />
by WIXRFS: a spectroscopist’s nightmare (or challenge?)<br />
James P. Willis<br />
Department <strong>of</strong> Geological Sciences, University <strong>of</strong> Cape Town,<br />
Rondebosch, 7700, S. Africa<br />
<strong>and</strong><br />
Edward B. McNew<br />
<strong>An</strong>alytical Laboratory, Molycorp, Inc.<br />
Mountain Pass, California<br />
Abstract<br />
This paper evaluates <strong>the</strong> WDXRFS analysis <strong>of</strong> rare earth element (<strong>REE</strong>) compounds <strong>and</strong> monazite, a<br />
radioactive phosphate mineral with very variable composition <strong>and</strong> high concentrations <strong>of</strong> rare earth<br />
elements (<strong>REE</strong>s) <strong>and</strong> thorium. The evaluation considers <strong>the</strong> use <strong>of</strong> K or L series <strong>REE</strong>, Nb <strong>and</strong> Y lines,<br />
L or M series lines for Th, U <strong>and</strong> Pb, <strong>and</strong> K series lines for common major elements. It is shown that<br />
<strong>the</strong> selection <strong>of</strong> <strong>the</strong> K or L line series for <strong>the</strong> <strong>REE</strong>s will determine whe<strong>the</strong>r powder briquettes (K series)<br />
or fusion disks (L series) must be used. For <strong>the</strong> light <strong>REE</strong>s (La through Gd) a Au target tube operated<br />
at 100 kV will give <strong>the</strong> best results, while a Au tube operated at 60 kV 45 mA will give <strong>the</strong> best results<br />
for all <strong>of</strong> <strong>the</strong> L series lines. It is suggested that a light <strong>REE</strong>, determined with <strong>the</strong> Ka line, could be<br />
used as a variable internal st<strong>and</strong>ard for <strong>the</strong> heavy <strong>REE</strong>s (L series lines), <strong>and</strong> thus solve particle size <strong>and</strong><br />
mineralogical problems in powder briquettes. Since most users have only a single x-ray tube, Rh<br />
target, which is <strong>the</strong> third best tube for <strong>REE</strong> K lines <strong>and</strong> <strong>the</strong> fourth best for <strong>REE</strong> L lines, it is suggested<br />
that instrument suppliers consider <strong>the</strong> possibility <strong>of</strong> providing a Ge secondary transmission target on<br />
<strong>the</strong> tube filter support. This could increase considerably <strong>the</strong> excitation efficiency <strong>of</strong> <strong>the</strong> <strong>REE</strong> L lines,<br />
since GeKcl is ideally placed just short <strong>of</strong> <strong>the</strong> <strong>REE</strong> L series absorption edges. Problems <strong>of</strong> infinite<br />
thickness, mineralogical <strong>and</strong> particle size effects, spectral line overlap, crossing <strong>of</strong> major element<br />
absorption edges, lack <strong>of</strong> suitable <strong>of</strong> st<strong>and</strong>ards <strong>and</strong> lack <strong>of</strong> influence coefficient s<strong>of</strong>tware to h<strong>and</strong>le up<br />
to 32 elements in a single run are discussed.<br />
Introduction<br />
<strong>Monazite</strong> [(<strong>REE</strong>,Y,Th)PO,] is a radioactive mineral <strong>of</strong> very variable composition:<br />
45-57% <strong>REE</strong> oxides; l-20, commonly 3-9%) ThO, ; a few wt% U308, Y,O, <strong>and</strong> ZrO,. At<br />
certain locations mineral grains are <strong>of</strong>ten cemented with FeO, .<br />
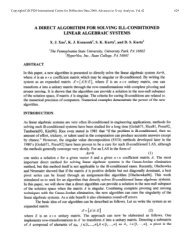
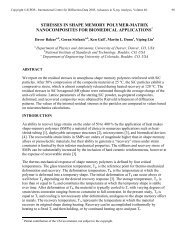
<strong>REE</strong>, Y, Tb <strong>and</strong> U concentrations in three monazite “st<strong>and</strong>ards” are plotted in Figure 1, which<br />
clearly indicates <strong>the</strong> wide range <strong>of</strong> <strong>REE</strong> concentrations to be analysed for, namely -25% to<br />
10 ppm.<br />
WDXRFS analysis <strong>of</strong> monazite presents serious challenges to <strong>the</strong> analyst. Challenges include:<br />
choice <strong>of</strong> sample preparation, powder briquettes or fusions; <strong>the</strong> type <strong>of</strong> sample preparation<br />
determines <strong>the</strong> selection <strong>of</strong> analyte lines, <strong>and</strong> vice versa; choice <strong>of</strong> analyte lines, K, L or M<br />
series, can influence <strong>the</strong> choice <strong>of</strong> x-ray tube target <strong>and</strong> kV; choice <strong>of</strong> analyte lines will<br />
influence <strong>the</strong> choice <strong>of</strong> analysing crystal, collimator <strong>and</strong> detector; solving multiple spectral<br />
overlap problems. Most <strong>of</strong> <strong>the</strong> references in <strong>the</strong> literature (e.g. Gleisberg et al., 1991;
Copyright (C) JCPDS-International Centre for Diffraction Data 1999<br />
830<br />
Moriyasu et al., 1991) refer to <strong>the</strong> separation <strong>of</strong> <strong>the</strong> <strong>REE</strong>s prior to analysis by XRFS or o<strong>the</strong>r<br />
techniques. A few papers refer to <strong>the</strong> determination <strong>of</strong> <strong>REE</strong>s in powder samples by XRFS<br />
(Kim et al., 1986; Kim et al., 1987; La1 et al., 1989).<br />
1 - IGS-36<br />
----- 700K<br />
--- 800K<br />
0.001<br />
-I I<br />
La Ce Pr Nd (Prn)Sm Eu Gd Tb Dy Ho Er Tm Yb Lu Y Th U<br />
Element<br />
Figure 1.<br />
Some oxide concentrations in three monazite “st<strong>and</strong>ards”. The radioactive<br />
element Pm has long since decayed away, <strong>and</strong> is no longer present in <strong>the</strong><br />
earth’s crust.<br />
Sample preparation<br />
Sample preparation is strongly influenced by <strong>the</strong> choice <strong>of</strong> analyte lines, K or L <strong>and</strong> M series.<br />
Samnle nrenaration for K series lines<br />
Use <strong>of</strong> Ka lines <strong>of</strong> very short wavelength (0.20-0.37 A) results in long path lengths within <strong>the</strong><br />
specimen <strong>and</strong> large infiite thickness requirements. However, it also reduces considerably<br />
problems <strong>of</strong> particle size <strong>and</strong> mineralogical effects. 20 g 30 mm diameter or 40 g 40 mm<br />
diameter powder briquettes will be infinitely thick for K series lines.<br />
Samnle nreoaration for L <strong>and</strong> M series lines<br />
Relatively long wavelengths (1.7-4.1 A) will result in severe particle size <strong>and</strong> mineralogical<br />
effects in 2 g 30 mm diameter powder briquettes (infinitely thick for L series lines). This<br />
essentially forces <strong>the</strong> use <strong>of</strong> fusions.<br />
Fusions<br />
Consistent preparation <strong>of</strong> homogeneous <strong>REE</strong> fusion disks can be difficult. Commonly<br />
observed problems are undissolved material remaining at <strong>the</strong> end <strong>of</strong> fusing, bubbles remaining<br />
in <strong>the</strong> crucible after cooling, <strong>and</strong> crystallization <strong>of</strong> <strong>the</strong> molten mixture during annealing.
Copyright (C) JCPDS-International Centre for Diffraction Data 1999<br />
831<br />
Insufficient annealing time causes frequent shattering <strong>of</strong> disks. It has also been observed that<br />
airborne dusts contacting <strong>the</strong> sample at <strong>the</strong> pouring stage can lead to an increase in <strong>the</strong><br />
frequency <strong>of</strong> crystallization. A clean, dust-free environment is essential.<br />
Mixtures <strong>of</strong> lithium tetraborate <strong>and</strong> lithium metaborate (90: 10 or 100:0) have been used very<br />
successfully. Higher proportions <strong>of</strong> lithium metaborate have caused more frequent<br />
crystallization problems. A sample to flux weight ratio <strong>of</strong> 0.5:9.5 in log fusion disks, with<br />
a few drops <strong>of</strong> LiBr (25 g/l00 ml) as releasing agent, is a reasonable compromise between<br />
sample dilution <strong>and</strong> melt viscosity. Greater sample loading causes <strong>the</strong> melt viscosity to<br />
increase <strong>and</strong> residual melt to remain in <strong>the</strong> crucible after pouring. Samples containing<br />
carbonates or sulphides must be fused for sufficient time to end gas evolution, <strong>and</strong> bubbles<br />
must be removed before casting, o<strong>the</strong>rwise <strong>the</strong> disks tend to crack.<br />
Instrumental conditions for K Series Lines<br />
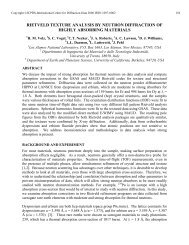
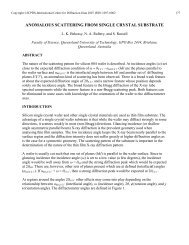
K excitation potentials for <strong>the</strong> BEES are 63-39 kV. Different excitation efficiencies between<br />
Au <strong>and</strong> Rh side-window tubes at different kV settings are shown in Figure 2. A Rh tube at<br />
60 kV gives poor excitation <strong>and</strong> will be virtually useless at low concentrations (Figure 2). The<br />
maximum kV on end-window tubes is 60-70 kV. The best excitation conditions are achieved<br />
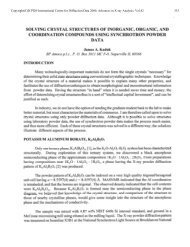
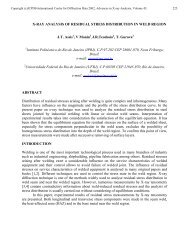
with a 1OOkV generator <strong>and</strong> Au side-window X-ray tube (Figures 2 <strong>and</strong> 3). The K excitation<br />
potential for W is 70 kV <strong>and</strong> for Au 81 kV. 100 kV on a Au or W tube will, <strong>the</strong>refore,<br />
generate some Au <strong>and</strong> W K line intensity. Au K lines are well-placed to excite <strong>the</strong> BEE K<br />
lines (Figure 3). However, most <strong>of</strong> <strong>the</strong> excitation will be by tube continuum, <strong>and</strong> <strong>the</strong> highest<br />
atomic number target material gives <strong>the</strong> maximum continuum intensity <strong>and</strong> <strong>the</strong> maximum<br />
excitation efficiency. Therefore, a Au tube will be best, followed by a W tube. Even at 60kV<br />
a Au tube gives sufficient excitation to allow <strong>the</strong> determination <strong>of</strong> La, Ce, Pr, Nd, Sm <strong>and</strong><br />
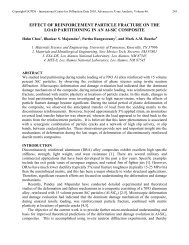
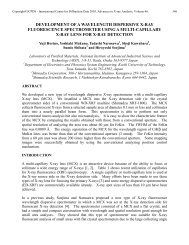
Gd(?) using <strong>the</strong>ir Ka lines (Figure 2). <strong>An</strong>alyte lines <strong>and</strong> problems <strong>of</strong> spectral overlap are<br />
clearly demonstrated in Figure 4.<br />
100<br />
- Autube,lOOkV<br />
80 ---a Rhtube,lOOkV<br />
- Autube,GOkV<br />
iz. -- Rhtube,GOkV<br />
-!i 60<br />
s<br />
.=<br />
g 40<br />
E<br />
0<br />
12 13 14 15<br />
‘20 LiF(220)<br />
6<br />
Figure 2.<br />
Wavelength scans <strong>of</strong> a monazite specimen at 100 kV <strong>and</strong> 60 kV with Au <strong>and</strong><br />
Rh side window tubes.
Copyright (C) JCPDS-International Centre for Diffraction Data 1999<br />
832<br />
AuKa<br />
RhKa MoKa<br />
RhKP<br />
I I<br />
8 8<br />
I I<br />
b..,, :. . . . . . . . . . ,““““‘,.“....‘.,..‘.‘....r ..,...*.. ..,....*. . I-<br />
MoKP 1<br />
I<br />
I I<br />
i -I<br />
0.1 0.2 0.3 0.4 0.5 0.6 0.7 0.8<br />
Wavelength,<br />
A<br />
Figure 3. Relative positions <strong>of</strong> <strong>REE</strong> K absorption edges <strong>and</strong> Au, Rh <strong>and</strong> MO tube lines,<br />
100 -<br />
80 -<br />
- Au tube, 100kV<br />
CeKa<br />
.<br />
x<br />
2 60-<br />
>;<br />
C<br />
2<br />
CD 40-<br />
E<br />
LaKa<br />
20 -<br />
0-r<br />
12 13 14<br />
‘20 LiF(220)<br />
16<br />
Figure 4.<br />
Wavelength scan <strong>of</strong> a monazite specimen with a Au tube at 1OOkV. The<br />
analyte lines used for <strong>the</strong> L<strong>REE</strong> La through Sm (<strong>and</strong> Gd?)] are<br />
underlined.
Copyright (C) JCPDS-International Centre for Diffraction Data 1999<br />
833<br />
Summary for K Series lines<br />
K series lines <strong>of</strong> <strong>the</strong> <strong>REE</strong>s are usable for La, Ce, Pr, Nd, Sm, <strong>and</strong> possibly Gd, with Au, W<br />
or Rh tubes at 100 kV. The use <strong>of</strong> K series lines is probably not viable with a Rh tube at<br />
60 kV. A fine primary collimator is essential <strong>and</strong> a secondary collimator is a big advantage<br />
(it clips peak “wings”). A LiF(220) analysing crystal gives insufficient spectral resolution,<br />
<strong>and</strong> a LiF(420) should be better, despite a loss <strong>of</strong> -50% intensity. There is some doubt as to<br />
whe<strong>the</strong>r <strong>the</strong> NaI crystals in conventional scintillation detectors are infinitely thick for <strong>the</strong> high<br />
energy <strong>REE</strong> K lines. Even if <strong>the</strong>y are not infinitely thick, <strong>the</strong> problems would be <strong>the</strong> same<br />
for specimens <strong>and</strong> st<strong>and</strong>ards <strong>and</strong> should not provide serious difficulties. The very high<br />
background from <strong>the</strong> continuum <strong>and</strong> poor excitation efficiency, combined with low<br />
concentrations, make <strong>the</strong> K lines unsuitable for <strong>the</strong> H<strong>REE</strong>.<br />
L <strong>and</strong> M Series Lines<br />
A Au tube is also <strong>the</strong> best choice for all <strong>REE</strong> L series lines (Figure 5), providing good<br />
excitation <strong>and</strong> minimal tube line spectral overlap. Ideally, for both Au <strong>and</strong> Rh tubes, it would<br />
be best to use La, lines for Ba <strong>and</strong> for all <strong>the</strong> <strong>REE</strong>s except Ce, Pr, Nd, Sm, for which <strong>the</strong> L/3,<br />
lines should be used. However, with a Au tube it is necessary to use <strong>the</strong> NdLa, line, despite<br />
line overlap from CeLcl, , because <strong>the</strong> AuLq(2) overlaps NdLP, (o<strong>the</strong>rwise free <strong>of</strong> spectral<br />
interference). Ma lines can be used for U <strong>and</strong> Th (in fusions), <strong>and</strong> Lcq for Nb <strong>and</strong> Y.<br />
AuLa, ,WLq<br />
WLYl I I<br />
i Lu~a,<br />
LaLa,<br />
RhKa<br />
I<br />
I<br />
I I I<br />
I<br />
iA Ul q 1<br />
L-L-L-L<br />
1 _<br />
I<br />
I<br />
I<br />
II I,<br />
I<br />
I<br />
.<br />
0.5 1tr.s 2<br />
GeKa<br />
Wavelength, A<br />
WI<br />
RhLa,<br />
RhLP, ;<br />
. I<br />
I I<br />
I I<br />
I<br />
I I<br />
I I<br />
I<br />
I<br />
I<br />
i i<br />
Figure 5.<br />
Relative positions <strong>of</strong> <strong>the</strong> <strong>REE</strong> Lcl, lines <strong>and</strong> corresponding L,,, absorption<br />
edges <strong>and</strong> Au, W <strong>and</strong> Rh tube lines.
Copyright (C) JCPDS-International Centre for Diffraction Data 1999<br />
834<br />
One possible solution to <strong>the</strong> poor excitation <strong>of</strong> <strong>the</strong> <strong>REE</strong> L series lines by Rh tubes (used in <strong>the</strong><br />
vast majority <strong>of</strong> modern XRF spectrometers) is shown in Figure 6. Essentially it involves<br />
placing in <strong>the</strong> tube filter holder a thin foil <strong>of</strong> a metal to be used as a secondary transmission<br />
target. The best choice for <strong>the</strong> <strong>REE</strong> L series lines would be germanium. The GeK lines are<br />
situated ideally just short <strong>of</strong> <strong>the</strong> H<strong>REE</strong> L series absorption edges (Figure 5).<br />
Secondary k~<br />
transmissiontarget<br />
2?<br />
SPECIMEN<br />
I<br />
eKa$<br />
radiation<br />
Thin foil mounted in<br />
tube filter carousel<br />
/<br />
End-window<br />
X-ray<br />
tube<br />
/<br />
(or Au, W, Cu, Ni, Co)<br />
Figure 6.<br />
A proposed secondary transmission target (located on <strong>the</strong> filter disk holder<br />
<strong>and</strong> very closely coupled with <strong>the</strong> specimen) to provide better excitation <strong>of</strong><br />
<strong>the</strong> <strong>REE</strong> (Ge target) <strong>and</strong> transition elements when using a Rh tube.<br />
Spectral line overlaps are a nightmare for <strong>the</strong> L series lines, as are absorption edges<br />
(Figure 7). It is also necessary to correct for spectral overlap from K series lines <strong>of</strong> <strong>the</strong><br />
transition elements (Cu, Ni, Co, Fe, Mn <strong>and</strong> Cr) on <strong>REE</strong> lines (Figure 8).<br />
Keith Norrish @ers. comm., 1996) uses a LiF(2OO) crystal for <strong>the</strong> <strong>REE</strong> L series lines .<br />
(Table 1). A LiF(220) crystal gives much better spectral resolution but less intensity. It may<br />
be <strong>the</strong> preferred analyzing crystal but figure <strong>of</strong> merit tests need to be conducted.<br />
For adequate matrix corrections it is necessary also to measure o<strong>the</strong>r major elements (Fe, Ca,<br />
S, P, Si, Al <strong>and</strong> Mg) (Table 2). Thirty-two element peaks in all have to be measured.<br />
Norrish uses a “no background” procedure which considerably reduces counting time. He<br />
determines backgrounds at peak positions using factors measured from single element<br />
interference st<strong>and</strong>ards, <strong>and</strong> simultaneously corrects for background <strong>and</strong> spectral overlap. The<br />
method still needs to be thoroughly tested. If background positions must be counted in<br />
addition to peaks, it will increase considerably <strong>the</strong> number <strong>of</strong> counting positions <strong>and</strong> <strong>the</strong> total<br />
counting time.<br />
Thirty-two single element spectral interference st<strong>and</strong>ards are required to determine accurately<br />
<strong>the</strong> required correction factors. The chemicals used need to be spectrally pure but not<br />
necessarily stoichiometric, since <strong>the</strong>y are not used as st<strong>and</strong>ards.
Copyright (C) JCPDS-International Centre for Diffraction Data 1999<br />
835<br />
Zn Cu Ni Fe Mn Cr v Ti<br />
I I I I I I I I<br />
I I I I I I I I<br />
I<br />
I<br />
I<br />
I I LuibTm Er Ho Dy’ Tb Gd Lu Sm<br />
I<br />
I : I:IIIll:lI~ I : I Ii)<br />
I<br />
Nd Pr I Ce La ;a<br />
LuYbTm Er Ho Dy Tb Gd Eu Sm Nd Pr Ce La Ba<br />
I: I I: I I I11 II II I II: I I I 1 I I I : II 1 : 1<br />
Nd Pr Ce La Ba<br />
1.1 1.2 1.3 1.4 1.5 1.6 1.7 1.8 1.9 2 2.1 2.2 2.3 2.4 2.5 2.6 2.7 2.8<br />
Wavelength, A<br />
I<br />
I<br />
I<br />
I<br />
I<br />
I<br />
I<br />
I<br />
I<br />
I<br />
I<br />
I<br />
I<br />
I<br />
I<br />
I<br />
I<br />
I<br />
I<br />
Figure 7.<br />
A wavelength plot <strong>of</strong> <strong>REE</strong> L series absorption edges <strong>and</strong> La, <strong>and</strong> Lb, lines<br />
tog<strong>the</strong>r with <strong>the</strong> Ka <strong>and</strong> KP lines <strong>of</strong> some <strong>of</strong> <strong>the</strong> transition elements <strong>and</strong> Ba<br />
<strong>and</strong> Ti.<br />
Ka Zn Cu Ni Co Fe Mn Cr V Ti<br />
I I I I I I I I I<br />
La, :<br />
I I I I I I I I I<br />
I Lu’;bTmE:&Qy’lq@j J& : lid : (Au) k i3E<br />
I<br />
I<br />
I<br />
I<br />
I<br />
I<br />
I<br />
I<br />
I<br />
I<br />
I<br />
I<br />
~<br />
I !; I<br />
I; i<br />
i: i<br />
,I iii i<br />
11 I I:’ ,I1 I<br />
II<br />
: I<br />
!, I<br />
II<br />
I’ I<br />
::<br />
T-k<br />
1.3 1.4 1.5 1.6 1.7 1.8 1.9 2 2.1 2.2 2.3 2.4 2.5 2.6 2.7 2.8<br />
:; II<br />
Wavelength, A - - Au L series (2)<br />
I<br />
I<br />
I<br />
I<br />
I<br />
I<br />
I<br />
I<br />
I<br />
I<br />
I<br />
Figure 8.<br />
A wavelength plot <strong>of</strong> <strong>REE</strong> L series analyte lines with some Ka <strong>and</strong> KP lines<br />
<strong>of</strong> transition elements which could cause spectral interference problems.
Copyright (C) JCPDS-International Centre for Diffraction Data 1999<br />
836<br />
Table 1.<br />
Instrumental conditions <strong>and</strong> counting times for <strong>REE</strong> analysis at <strong>the</strong><br />
CSIRO, Australia (K. Norrish, pen. comm.). Rh tube 80 kV, 35 mA,<br />
flowcounter.<br />
Element<br />
Line<br />
Collimator<br />
Crystal<br />
Time (s)<br />
Lu<br />
La1<br />
F<br />
LiF(200) 80<br />
Yb<br />
La1<br />
F<br />
LiF(200) 60<br />
Tm<br />
La1<br />
F<br />
LiF(200) 80<br />
Er<br />
La1<br />
F<br />
LiF(200) 60<br />
Ho<br />
La1<br />
F<br />
LiF(200) 80<br />
DY<br />
La1<br />
F<br />
LiF(200) 30<br />
Tb<br />
La1<br />
F<br />
LiF(200) 80<br />
Gd<br />
La1<br />
F<br />
LiF(200) 30<br />
EU<br />
La1<br />
F<br />
LiF(200) 50<br />
Sm<br />
w<br />
F<br />
LiF(200) 50<br />
Nd<br />
La1<br />
F<br />
LiF(200) 20<br />
Pr<br />
LP1<br />
F<br />
LiF(200) 30<br />
Ce<br />
W<br />
F<br />
LiF(200) 16<br />
La<br />
La1<br />
F<br />
LiF(200) 20<br />
<strong>An</strong>alytical program for L series lines<br />
The analytical program (element lines, collimators, crystals <strong>and</strong> counting times) used for<br />
monazite <strong>and</strong> <strong>REE</strong> mineral analysis by Keith Norrish at <strong>the</strong> CSIRO in Australia is given in<br />
Tables 1 <strong>and</strong> 2. O<strong>the</strong>r instrumental conditions are: Rh tube; 80 kV 35 mA; 40 kV 70 mA<br />
for Nb, Y, Th, U, Fe, Ca, S, P, Si, Al, Mg; flowcounter; 32 peak positions. Total counting<br />
time: 1026 seconds or 18 minutes. Selection <strong>of</strong> a coarse collimator for Y La, <strong>and</strong> <strong>the</strong> Ka<br />
lines <strong>of</strong> S, P, Si, Al <strong>and</strong> Mg increases intensities but still provides adequate spectral resolution<br />
with <strong>the</strong> particular analysing crystals used for <strong>the</strong>se lines.<br />
A wavelength scan <strong>of</strong> a typical monazite specimen is given in Figure 9. The two parts <strong>of</strong> <strong>the</strong><br />
scan separated by <strong>the</strong> dashed line are shown separately in Figures 10 <strong>and</strong> 11.
Copyright (C) JCPDS-International Centre for Diffraction Data 1999<br />
837<br />
8<br />
22<br />
.=<br />
s<br />
2<br />
a<br />
- E<br />
40<br />
30<br />
20<br />
10<br />
- Au tube, 60kV<br />
BaLP,<br />
, FeKa<br />
CeLa,<br />
0<br />
‘28 LiF(220)<br />
Figure 9.<br />
A wavelength scan <strong>of</strong> <strong>the</strong> <strong>REE</strong> L series lines from a monazite specimen. A<br />
Au tube was used at 60 kV 45 mA with a LiF(220) analysing crystal, fine<br />
collimator <strong>and</strong> flowcounter.<br />
20<br />
15<br />
10<br />
5<br />
0<br />
100 110 120 130 140<br />
‘243 LiF(220)<br />
Figure 10.<br />
<strong>An</strong> exp<strong>and</strong>ed view <strong>of</strong> part <strong>of</strong> Figure 9, showing details <strong>of</strong> <strong>the</strong> wavelength<br />
scan <strong>of</strong> <strong>the</strong> L<strong>REE</strong> L series analyte lines from a monazite specimen.
Copyright (C) JCPDS-International Centre for Diffraction Data 1999<br />
838<br />
u)<br />
a<br />
6<br />
x 4<br />
s<br />
C<br />
E<br />
a<br />
- E 2<br />
- Au tube, 60kV<br />
2<br />
9<br />
IF<br />
0<br />
0<br />
70 75 80 85<br />
‘20 LiF(220)<br />
Figure 11.<br />
<strong>An</strong> exp<strong>and</strong>ed view <strong>of</strong> part <strong>of</strong> Figure 9, showing details <strong>of</strong> <strong>the</strong> wavelength<br />
scan <strong>of</strong> <strong>the</strong> H<strong>REE</strong> L series analyte lines from a monazite specimen.<br />
St<strong>and</strong>ards<br />
Very few CRMs are available for high <strong>REE</strong> mineral specimens <strong>and</strong> none for high purity <strong>REE</strong><br />
compounds, a major problem in developing <strong>and</strong> testing accurate analytical methods. Using<br />
fusions for L <strong>and</strong> M series lines should allow preparation <strong>of</strong> st<strong>and</strong>ards from pure chemicals.<br />
The problem is to get pure a stoichiometric elemental oxides. Chemical suppliers guarantee<br />
spectral purity. However, due to moisture or CO, absorption <strong>and</strong> variations in redox state,<br />
<strong>the</strong>y do not guarantee to a sufficient accuracy <strong>the</strong> stoichiometric purity <strong>of</strong> <strong>REE</strong> compounds.<br />
Spectrally pure <strong>REE</strong> oxides can be fired at 1000°C for 30 minutes <strong>and</strong> <strong>the</strong> <strong>the</strong>oretical oxide<br />
to element conversion factors used. This may lead to systematic errors that are difficult to<br />
overcome. The analyst is forced to rely on o<strong>the</strong>r chemical methods to determine <strong>the</strong> actual<br />
stoichiometry <strong>of</strong> purchased pure oxides. The analytical uncertainty (l-2%) <strong>of</strong> ICP-AES <strong>and</strong><br />
ICP-MS is much greater than that required for obtaining element to oxide conversion factors<br />
adequate for accurate preparation <strong>of</strong> artificial st<strong>and</strong>ards. Therefore, <strong>the</strong> analyst must use<br />
considerable judgement when preparing syn<strong>the</strong>tic st<strong>and</strong>ards for <strong>REE</strong> analysis.<br />
A round-robin program for establishing a number <strong>of</strong> suitable st<strong>and</strong>ard minerals or oxides for<br />
<strong>REE</strong> analysis is required urgently. Sufficiently large quantities <strong>of</strong> <strong>REE</strong> concentrates <strong>and</strong> ores<br />
are available for this purpose.
Copyright (C) JCPDS-International Centre for Diffraction Data 1999<br />
839<br />
Table 2.<br />
Instrumental conditions <strong>and</strong> counting times for elements o<strong>the</strong>r than <strong>the</strong><br />
<strong>REE</strong>s in monazite samples at <strong>the</strong> CSIRO, Australia (K. Norrish, pen.<br />
comm.). Rh tube, see text for kV-mA settings, flowcounter.<br />
CU Ku F LiF(200) 20<br />
Ni Ku F LiF(200) 20<br />
co Ku F LiF(200) 30<br />
Fe Ku F LiF(200) 20<br />
Mn Ku F LiF(200) 10<br />
Ca Ku F LiF(200) 10<br />
S Ku C Ge 20<br />
P Ku C Ge 20<br />
Si Ku C PE 20<br />
Al Ku C PE 20<br />
m Ku C TlAP 20<br />
S<strong>of</strong>tware for data reduction<br />
It is essential to make corrections for inter-element matrix effects. Most, if not all, influence<br />
coefficient s<strong>of</strong>tware packages cannot process up to 32 elements in a single run (20-2 1 elements<br />
is <strong>the</strong> current maximum). One solution is to dilute specimens sufficiently that algorithms such<br />
as Lachance-Traill, using single, constant influence coefficients for each inter-element effect,<br />
would be appropriate. It would certainly simplify <strong>the</strong> calculations. The problem in using high<br />
dilutions is <strong>the</strong> loss <strong>of</strong> sensitivity for HPEE elements, which usually occur at low<br />
concentrations in <strong>REE</strong> minerals.
Copyright (C) JCPDS-International Centre for Diffraction Data 1999<br />
840<br />
Crossing major or minor element absorption edges<br />
For <strong>the</strong> determination <strong>of</strong> only Nb <strong>and</strong> Y (Kcr lines) <strong>and</strong> Th <strong>and</strong> U (La, lines) in powder<br />
briquettes, mass absorption coefficients (MACs) obtained using <strong>the</strong> Rh or MO Compton peak<br />
intensities can be used to correct for matrix effects due to absorption. Great care must be<br />
exercised in crossing major or minor element absorption edges. Ignoring <strong>the</strong> presence <strong>of</strong><br />
major or minor element absorption edges between tube Compton peaks <strong>and</strong> analyte<br />
wavelengths (Figure 12) can ‘result in large systematic errors (Table 3), when using mass<br />
absorption coefficients determined from tube Compton peak intensities. Ignoring absorption<br />
edges <strong>of</strong> minor elements at concentrations greater than -2000 mg/kg can lead to significant<br />
errors. The use <strong>of</strong> <strong>the</strong> Nesbitt ef al. (1976) method for crossing major element absorption<br />
edges easily solves <strong>the</strong> problem (Figure 13).<br />
RhKaC(T)<br />
MoKaC(T)<br />
ThLa,<br />
Figure 12.<br />
0.5 0.6 0.7 018<br />
Wavelength, A<br />
Problems (crossing major element absorption edges) in using tube Compton<br />
peaks to determine MACs for Th <strong>and</strong> Y analyses, when Th is present at<br />
minor to major concentrations.<br />
1<br />
-2 - 0.5109 + 5.3353.10-"(Th kcps) Y<br />
20 40 60<br />
intensity ThLa,<br />
(kcps)<br />
60<br />
Figure 13.<br />
Plot <strong>of</strong> ThLcl, intensity versus <strong>the</strong> ratio <strong>of</strong> c(M,,Kcrcl~~Kcr for estimating from<br />
MoKaC <strong>the</strong> vahte <strong>of</strong> ,.&r&KS across <strong>the</strong> ThL, absorption edge. Data points<br />
are blank specimens <strong>of</strong> known composition to which different, known<br />
amounts <strong>of</strong> ThOl have been added.
Copyright (C) JCPDS-International Centre for Diffraction Data 1999<br />
841<br />
Table 3.<br />
Errors in Th data in monazite-rich s<strong>and</strong>s when using mass absorption<br />
coefficients obtained by measuring <strong>the</strong> MO tube Ka Compton peak intensity<br />
while ignoring major element absorption edges. The MAC at RbKa was<br />
estimated from <strong>the</strong> MAC at. MoKaC using <strong>the</strong> Nesbitt et al. (1976) method<br />
(Figure 13).<br />
Sample<br />
Th @w/kg)<br />
using MAC at MoKaC<br />
Th (mg/kg)*<br />
using MAC at RbKcl<br />
% difference<br />
ll2A 31380 27780 13.0<br />
1/3A 27650 24670 12.1<br />
1/4A 9460 8870 10.8<br />
l/5 4900 4710 4.0<br />
l/12 943 942 0.1<br />
l/6 497 500 0.6<br />
l/l 311 314 1.0<br />
l/14 105 106 1.0<br />
l/13 23 23 0.0<br />
* correct value<br />
Conclusions<br />
Rare earth element compounds are becoming an important industrial product <strong>and</strong> good quality<br />
control in <strong>the</strong>ir manufacture is essential. WDXRFS is a rapid <strong>and</strong> reliable technique for<br />
routine analysis <strong>of</strong> “normal” minerals <strong>and</strong> oxides. However, WDXRFS analysis <strong>of</strong> <strong>REE</strong>s in<br />
minerals <strong>and</strong> high purity <strong>REE</strong> oxides is a daunting <strong>and</strong> complicated task.<br />
Particle size <strong>and</strong> mineralogical effects for all <strong>REE</strong>s can be eliminated by use <strong>of</strong> fusion disks.<br />
L <strong>and</strong> M (Th <strong>and</strong> U) series lines m be used with fusion disks, because <strong>of</strong> infinite thickness<br />
limitations. Using powder briquettes, K series lines can be measured for La, Ce, Pr, Nd, Sm,<br />
Gd(?), Nb, <strong>and</strong> Y, <strong>and</strong> L series lines for Th <strong>and</strong> U. Particle size <strong>and</strong> mineralogical effects will<br />
be minimal due to relatively large penetration depths.<br />
The possibility needs to be investigated <strong>of</strong> using L lines <strong>of</strong> La, Ce, Pr, Nd or Sm (whose<br />
concentration data were obtained from K series lines) as variable internal st<strong>and</strong>ards for H<strong>REE</strong><br />
(Eu, <strong>and</strong> Gd through Lu) L series lines on powder briquettes. The use <strong>of</strong> powder briquettes<br />
for rapid, routine <strong>and</strong> reasonably accurate analyses <strong>of</strong> all <strong>REE</strong>s would eliminate <strong>the</strong> need for<br />
a fusion process, with considerable savings in time <strong>and</strong> costs.
Copyright (C) JCPDS-International Centre for Diffraction Data 1999<br />
842<br />
New or modified s<strong>of</strong>tware programs are needed to process <strong>the</strong> large number <strong>of</strong> spectral lines<br />
(30-40) required for <strong>the</strong> accurate analysis <strong>of</strong> <strong>REE</strong>s in minerals.<br />
Since suppliers <strong>of</strong> spectrally pure <strong>REE</strong> oxides do not guarantee <strong>the</strong> stoichiometry <strong>of</strong> <strong>the</strong><br />
oxides, it is difficult <strong>and</strong> a potential source <strong>of</strong> systematic error to use <strong>the</strong>se compounds in<br />
making up artificial st<strong>and</strong>ards. It is necessary to analyse <strong>the</strong>m accurately by some o<strong>the</strong>r<br />
analytical technique to determine <strong>the</strong>ir stoichiometry. ICP-MS is a useful analytical technique<br />
for <strong>REE</strong> determination, but it is not always easy to get ALL <strong>the</strong> <strong>REE</strong>s into solution <strong>and</strong><br />
generally one should fuse before dissolution. Very high concentrations (20-30%) <strong>of</strong> some <strong>of</strong><br />
<strong>the</strong> L<strong>REE</strong>s make accurate determination <strong>of</strong> some <strong>of</strong> <strong>the</strong> H<strong>REE</strong>s at very low concentrations<br />
(0.001% or 10 ppm) difficult by ICP-MS. A round-robin program for establishing a number<br />
<strong>of</strong> suitable st<strong>and</strong>ard minerals or oxides for <strong>REE</strong> analysis is urgently required.<br />
A simple <strong>and</strong> reliable WDXRPS method for <strong>the</strong> routine determination <strong>of</strong> <strong>REE</strong>s at high <strong>and</strong> low<br />
concentrations in minerals <strong>and</strong> chemicals would be a valuable addition to any geological<br />
laboratory.<br />
References<br />
Gleisberg, B., Ly, B.M. <strong>and</strong> Gorski, B. (1991) Investigations <strong>of</strong> <strong>the</strong> separation <strong>of</strong> neptunium,<br />
protactinium, uranium, thorium <strong>and</strong> <strong>REE</strong> [rare-earth elements] in geological samples.<br />
J. Radioanal. Nucl. Chem., 147, 95-107.<br />
Kim, Y .M., Kim, Y .S., Park, Y .C. <strong>and</strong> Lee, C. W. (1986) Study on <strong>the</strong> correction <strong>of</strong> spectral<br />
line overlaps for <strong>the</strong> determination <strong>of</strong> rare-earth elements by X-ray fluorescence<br />
spectrometry. Taehan Hwakakhoe Chi, 30, 538-547.<br />
Kim, Y .M., Choi, B.S., Kim, S.T. <strong>and</strong> Lee, C.W. (1987) Determination <strong>of</strong> rare-earth oxides<br />
by X-ray fluorescence spectrometry using empirical coefficient method. Taehan<br />
Hwakukhoe Chi, 31, 64-70.<br />
Lal, M., Choudhury, R.K., Joseph, D., Bajpal, H.N. <strong>and</strong> Iyer, C.S.P. (1989) Elemental<br />
analysis <strong>of</strong> selected Indian monazite ores by energy-dispersive X-ray fluorescence<br />
(EDXRF) spectroscopy. J. Radioanal. Nucl. Chem., 137, 127-133.<br />
Moriyasu, K., Mizuta, H. <strong>and</strong> Nishikawa, Y. (1991) Determination <strong>of</strong> rareearth-metal ions<br />
by XRF with hydroxyiminodiacetic acid chelating resin. Bunseki Kaguku, 40,<br />
175-179.<br />
Nesbitt, R.W., Mastins, H., Stolz, G.W. <strong>and</strong> Bruce, D.R. (1976) Matrix corrections in trace<br />
element analysis by X-ray fluorescence: an extension <strong>of</strong> <strong>the</strong> Compton-scattering<br />
technique to long wavelengths. Chem. Geol., 18, 203.<br />
Norrish, K. (1976). Personal communication. CSIRO, Division <strong>of</strong> Soils, Private Bag No.<br />
2, Glen Osmond, South Australia, 5064, Australia.