high resolution x-ray measurements of strain-mediated ... - ICDD
high resolution x-ray measurements of strain-mediated ... - ICDD
high resolution x-ray measurements of strain-mediated ... - ICDD

Create successful ePaper yourself
Turn your PDF publications into a flip-book with our unique Google optimized e-Paper software.
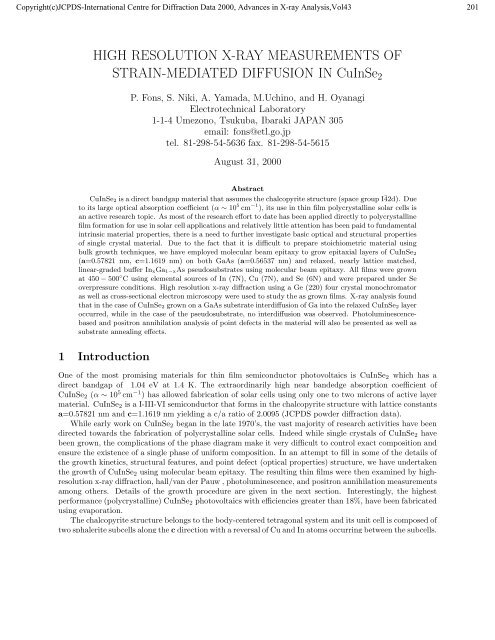
Copyright(c)JCPDS-International Centre for Diffraction Data 2000, Advances in X-<strong>ray</strong> Analysis,Vol43 201<br />
HIGH RESOLUTION X-RAY MEASUREMENTS OF<br />
STRAIN-MEDIATED DIFFUSION IN CuInSe 2<br />
P. Fons, S. Niki, A. Yamada, M.Uchino, and H. Oyanagi<br />
Electrotechnical Laboratory<br />
1-1-4 Umezono, Tsukuba, Ibaraki JAPAN 305<br />
email: fons@etl.go.jp<br />
tel. 81-298-54-5636 fax. 81-298-54-5615<br />
August 31, 2000<br />
Abstract<br />
CuInSe 2 is a direct bandgap material that assumes the chalcopyrite structure (space group I¯42d). Due<br />
to its large optical absorption coefficient (α ∼ 10 5 cm −1 ),its use in thin film polycrystalline solar cells is<br />
an active research topic. As most <strong>of</strong> the research effort to date has been applied directly to polycrystalline<br />
film formation for use in solar cell applications and relatively little attention has been paid to fundamental<br />
intrinsic material properties,there is a need to further investigate basic optical and structural properties<br />
<strong>of</strong> single crystal material. Due to the fact that it is difficult to prepare stoichiometric material using<br />
bulk growth techniques,we have employed molecular beam epitaxy to grow epitaxial layers <strong>of</strong> CuInSe 2<br />
(a=0.57821 nm, c=1.1619 nm) on both GaAs (a=0.56537 nm) and relaxed,nearly lattice matched,<br />
linear-graded buffer In xGa 1−xAs pseudosubstrates using molecular beam epitaxy. All films were grown<br />
at 450 − 500 ◦ C using elemental sources <strong>of</strong> In (7N),Cu (7N),and Se (6N) and were prepared under Se<br />
overpressure conditions. High <strong>resolution</strong> x-<strong>ray</strong> diffraction using a Ge (220) four crystal monochromator<br />
as well as cross-sectional electron microscopy were used to study the as grown films. X-<strong>ray</strong> analysis found<br />
that in the case <strong>of</strong> CuInSe 2 grown on a GaAs substrate interdiffusion <strong>of</strong> Ga into the relaxed CuInSe 2 layer<br />
occurred,while in the case <strong>of</strong> the pseudosubstrate,no interdiffusion was observed. Photoluminescencebased<br />
and positron annihilation analysis <strong>of</strong> point defects in the material will also be presented as well as<br />
substrate annealing effects.<br />
1 Introduction<br />
One <strong>of</strong> the most promising materials for thin film semiconductor photovoltaics is CuInSe 2 which has a<br />
direct bandgap <strong>of</strong> 1.04 eV at 1.4 K. The extraordinarily <strong>high</strong> near bandedge absorption coefficient <strong>of</strong><br />
CuInSe 2 (α ∼ 10 5 cm −1 ) has allowed fabrication <strong>of</strong> solar cells using only one to two microns <strong>of</strong> active layer<br />
material. CuInSe 2 is a I-III-VI semiconductor that forms in the chalcopyrite structure with lattice constants<br />
a=0.57821 nm and c=1.1619 nm yielding a c/a ratio <strong>of</strong> 2.0095 (JCPDS powder diffraction data).<br />
While early work on CuInSe 2 began in the late 1970’s, the vast majority <strong>of</strong> research activities have been<br />
directed towards the fabrication <strong>of</strong> polycrystalline solar cells. Indeed while single crystals <strong>of</strong> CuInSe 2 have<br />
been grown, the complications <strong>of</strong> the phase diagram make it very difficult to control exact composition and<br />
ensure the existence <strong>of</strong> a single phase <strong>of</strong> uniform composition. In an attempt to fill in some <strong>of</strong> the details <strong>of</strong><br />
the growth kinetics, structural features, and point defect (optical properties) structure, we have undertaken<br />
the growth <strong>of</strong> CuInSe 2 using molecular beam epitaxy. The resulting thin films were then examined by <strong>high</strong><strong>resolution</strong><br />
x-<strong>ray</strong> diffraction, hall/van der Pauw , photoluminescence, and positron annihilation <strong>measurements</strong><br />
among others. Details <strong>of</strong> the growth procedure are given in the next section. Interestingly, the <strong>high</strong>est<br />
performance (polycrystalline) CuInSe 2 photovoltaics with efficiencies greater than 18%, have been fabricated<br />
using evaporation.<br />
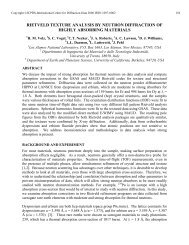
The chalcopyrite structure belongs to the body-centered tetragonal system and its unit cell is composed <strong>of</strong><br />
two sphalerite subcells along the c direction with a reversal <strong>of</strong> Cu and In atoms occurring between the subcells.<br />
1
Copyright(c)JCPDS-International Centre for Diffraction Data 2000, Advances in X-<strong>ray</strong> Analysis,Vol43 202<br />
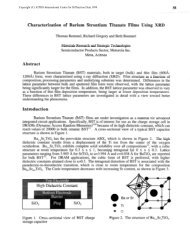
A schematic picture <strong>of</strong> the chalcopyrite structure is shown in Fig. 1 on the left. The c axis is slightly larger<br />
than twice that <strong>of</strong> the a axis. The chalcopyrite structure can be fully described by the lengths <strong>of</strong> the a and<br />
c axes and a u parameter which specifies the remaining degree <strong>of</strong> freedom <strong>of</strong> the Se in the I¯42d space group.<br />
The atom positions are as follows. The Cu atoms sit on sites with Wyk<strong>of</strong>f 4a symmetry, namely at (0,0,0)<br />
and (0,1/2,1/4) while the In atoms sit on 4b sites at the positions (1/2,1/2,0) and (1/2,0,1/4). The Se atoms<br />
reside on 8d sites at the positions (u, 1/4, 1/8), (−u, 3/4, 1/8), (3/4, 1/2−u, 3/8), and (1/4, 1/2+u, 3/8). The<br />
special case <strong>of</strong> u =1/4 corresponds to Se sitting equidistant from Cu and In. In the case <strong>of</strong> CIS, u =0.224,<br />
therefore the Se atom sits closer to the Cu atom than the In atom. At <strong>high</strong> temperatures (T ≥ 800 ◦ )the<br />
cations disorder and CuInSe 2 changes to a sphalerite structure δ (space group F¯43m, No. 216).<br />
_<br />
I42d<br />
: 2a Cu<br />
: 2b In<br />
: 8d Se<br />
Chalcopyrite<br />
_<br />
I42m<br />
: 2a Cu (0.8)<br />
: 2b In (0.4)<br />
: 4d In<br />
: 8i Se<br />
Stannite<br />
Figure 1: The chalcopyrite and stannite structures<br />
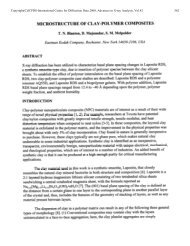
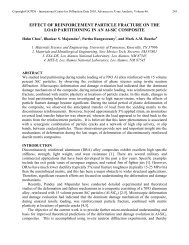
Unlike ZnSe, the II-VI binary analogue <strong>of</strong> CuInSe 2 , a variety <strong>of</strong> compounds have been found to exist in<br />
the CuInSe 2 phase diagram which is usually expressed as a pseudobinary with endpoints Cu 2 Se and In 2 Se 3 .<br />
The significance <strong>of</strong> this pseudobinary tieline is that represents constant valence stoichiometry. On the Cu<br />
rich side <strong>of</strong> the phase diagram, CuInSe 2 coexists with the Cu-rich phase Cu 2−x Se. As Cu 2−x Se is metallic in<br />
nature, Cu-rich compositions are avoided in solar cell fabrication due to the formation <strong>of</strong> Cu 2−x Se shunt paths<br />
along CuInSe 2 grain boundaries which reduce cell performance. Indeed, the <strong>high</strong> temperature (> 180 ◦ C)<br />
phase <strong>of</strong> Cu 2−x Se is well known for being a superionic conductor. A schematic representation <strong>of</strong> the current<br />
understanding <strong>of</strong> the phase diagram is down in Fig. 2 in which CuInSe 2 is represented as a pseudobinary<br />
with endpoints Cu 2 Se and In 2 Se 3 . On the In-rich side <strong>of</strong> the phase diagram, there is no clear phase boundary<br />
observed implying a variety <strong>of</strong> vacancy stabilized chalcopyrites may exist. The structure <strong>of</strong> CuIn 3 Se 5 has<br />
recently been investigated by convergent beam TEM and Rietveld fitting and has been determined to have<br />
the stannite structure (space group I¯42m as can be seen in Fig. 1. The unit cell <strong>of</strong> CuIn 3 Se 5 has lattice<br />
constants c=1.1518 nm and a=0.5554 nm with the extinction rule h+k+l=2n. As the stannite space group<br />
I¯42m is not a subgroup <strong>of</strong> the chalcopyrite point group I¯42d, this implies that vacancy stabilized In-rich<br />
composition CuIn x Se y are not formed by partial order or local cation substitution <strong>of</strong> CuInSe 2 .<br />
2 Growth<br />
The film growths described in this manuscript can be divided into two parts. The first set <strong>of</strong> experiments was<br />
dedicated to investigating the effects <strong>of</strong> heteroepitaxial <strong>strain</strong> on CuInSe 2 and used both LEC GaAs(001) and<br />
and nearly lattice matched In 0.29 Ga 0.71 As (001) pseudo-substrates. For these early experiments, substrates<br />
were mounted to the Mo sample holders using In-solder. After these early experiments were complete, due<br />
to the sensitivity <strong>of</strong> CuInSe 2 films to low temperature annealing effects, it was decided to avoid the heating<br />
<strong>of</strong> samples to melt the In. In lieu <strong>of</strong> In a Ga-In eutectic was used that is liquid at room temperature. Thus<br />
for the second set <strong>of</strong> experiments presented here relating to annealing effects, a Ga-In eutectic was used to<br />
mount the samples. Sample temperatures were calibrated using infrared pyrometry.<br />
For the first set <strong>of</strong> experiments relating to heteroepitaxial <strong>strain</strong>, all CuInSe 2 samples were grown by<br />
molecular beam epitaxy from solid sources <strong>of</strong> Cu (7N), In (7N) and Se (6N) at a growth temperature<br />
2
Copyright(c)JCPDS-International Centre for Diffraction Data 2000, Advances in X-<strong>ray</strong> Analysis,Vol43 203<br />
Cu 2 Se-In 2 Se 3 Pseudobinary System<br />
CuInSe 2 CuIn3 Se 5<br />
CuIn 5 Se 8<br />
1000<br />
δ + L<br />
Temperature (¡C)<br />
900<br />
800<br />
700<br />
α<br />
δ<br />
α<br />
+<br />
δ<br />
δ+β<br />
δ+β<br />
β<br />
β<br />
+<br />
γ<br />
γ γ + In 2 Se 3<br />
Cu 2 Se<br />
50 60 70 80 90 In 2 Se 3<br />
Figure 2: The CuInSe 2 pseudobinary phase diagram<br />
<strong>of</strong> 500 ◦ C as explained above. In these experiments, both sulfur-passivated GaAs (001) substrates and As 2 -<br />
capped, nearly lattice matched In 0.29 Ga 0.71 As (001) pseudo-substrates were affixed to the same Mo substrate<br />
block using In solder. For the second set <strong>of</strong> experiments relating to annealing effects, sulfur-passivated GaAs<br />
(001) wafers were mounted to the Mo substrate block using a Ga-In eutectic and were grown at 450 ◦ C. In<br />
both experiments, all wafers were (001) oriented and had no intentional miscut.<br />
In both sets <strong>of</strong> experiments, the growth <strong>of</strong> flat, uniquely oriented, epitaxial thin films <strong>of</strong> CuInSe 2 as<br />
well as the presence <strong>of</strong> the chalcopyrite structure was confirmed in-situ by RHEED. For the first set <strong>of</strong><br />
experiments, all samples were grown under Cu-rich (as measured by electron microprobe <strong>measurements</strong><br />
(EPMA)) conditions whereas for the second set both In-rich and Cu-rich samples were grown. All samples<br />
were grown under Se overpressure conditions. Further details <strong>of</strong> the sample preparation procedure and<br />
growth process have been described elsewhere[3].<br />
The pseudo-substrates consisted <strong>of</strong> a linearly-graded In x Ga 1−x As buffer layer with x varying from x=0<br />
to 0.29 using a concentration gradient <strong>of</strong> 1% In/40 nm. On top <strong>of</strong> the linearly-graded buffer a ∼ 800 nm<br />
thick layer <strong>of</strong> In x Ga 1−x As <strong>of</strong> constant x=0.29 composition was grown. The pseudo-substrates were grown in<br />
a separate chamber and an As 2 cap was used to protect the surface during transport to the growth system.<br />
Triple-axis X-<strong>ray</strong> diffraction (XRD) <strong>measurements</strong> <strong>of</strong> these substrates indicated that the final layer was<br />
about 90% relaxed. Use <strong>of</strong> a linearly graded buffer to provide <strong>strain</strong> relaxation and a reduction in threading<br />
dislocation densities below 10 6 cm −2 has been demonstrated for large mismatch systems such as SiGe/Si[4]<br />
and InGaP/GaAs[5]. The room temperature in-plane lattice mismatch was δa/a ∼ 2.2% and δa/a ∼ 0.2% for<br />
the CuInSe 2 /GaAs and CuInSe 2 /In 0.29 Ga 0.71 As layers, respectively. In addition to the room temperature<br />
<strong>strain</strong>, an additional complication arises due to the differences in thermal expansion coefficients between<br />
CuInSe 2 and the GaAs substrate. This gives rise to an additional tensile <strong>strain</strong> (<strong>of</strong> the relaxed CuInSe 2 layer<br />
upon cooling) on the order <strong>of</strong> δd/d ∼ 10 −3 for the temperatures used here. It should be mentioned here<br />
that a slight compressive <strong>strain</strong> is necessary to ensure unique orientation <strong>of</strong> the tetragonal unit cell (e.g. the<br />
CuInSe 2 c axis aligned to the growth direction).<br />
During the initial states <strong>of</strong> growth, a sharp change in surface reconstruction from a streaky (1 x 2)<br />
reconstruction with respect to the [1¯10] and [110] directions to a (1 x 3) reconstruction occurred. The<br />
presence <strong>of</strong> a slight waviness along the [110] direction <strong>of</strong> the (1 x 3) surface was noted as well. This change<br />
occurred after approximately 30 nm <strong>of</strong> CuInSe 2 . was deposited. In part, to understand the origin <strong>of</strong> this<br />
change in surface reconstruction, a series <strong>of</strong> CuInSe 2 films <strong>of</strong> various thicknesses were grown on GaAs and<br />
In 0.29 Ga 0.71 As pseudo-substrates. CuInSe 2 films <strong>of</strong> thicknesses 4.2, 12.6, 40, 63, 126, and 270 nm were<br />
grown. These films were then investigated by <strong>high</strong>-<strong>resolution</strong> x-<strong>ray</strong> diffraction (HRXRD) and transmission<br />
electron microscopy (TEM). The surface topology <strong>of</strong> several films was examined by atomic force microscopy<br />
(AFM) as well.<br />
3
Copyright(c)JCPDS-International Centre for Diffraction Data 2000, Advances in X-<strong>ray</strong> Analysis,Vol43 204<br />
HRXRD <strong>measurements</strong> were performed using a MAC Science 18,000 watt rotating anode Cu target. A<br />
Phillips MRD diffractometer with a 4-bounce, symmetric Ge(220) monochrometer was used to select Cu<br />
Kα 1 radiation (λ =0.15405981nm). A 1.2 mm receiving slit was used in front <strong>of</strong> the detector. In later<br />
experiments a parabolic x-<strong>ray</strong> mirror and a 15 degree asymmetric (220) Ge four crystal monochromator were<br />
used in conjunction with a triple bounce Ge (220) analyzer resulting in an increase in intensity <strong>of</strong> about<br />
a factor <strong>of</strong> twenty. Transmission electron microscopy <strong>measurements</strong> were performed on a 400keV JEOL<br />
4000FX microscope. The cross sections were prepared in a standard way using a tripod polisher and Ar ion<br />
milling.<br />
Film composition was measured by EPMA using a bulk CuInSe 2 crystal as a standard. Composition<br />
is reported here in terms <strong>of</strong> as-measured Cu/In ratio. It is important to note that EPMA measures a<br />
weighted composition with a strong near-surface weighting. If the film being measured is not uniform in<br />
composition with depth, this results in a composition value representing the electron beam depth distribution.<br />
In particular, for Cu-rich films as will be explained later, a second phase <strong>of</strong> Cu 2−x Se in the near-surface<br />
region. Cross-sectional electron microscopy <strong>of</strong> Cu-rich composition films in conjunction with EPMA voltage<br />
dependent <strong>measurements</strong> has yielded further information about the composition and shape <strong>of</strong> these Cu 2−x Se<br />
regions as will be explained below [6]. In contrast, all In-rich samples were uniform in composition with<br />
depth and no other phases were observed. Composition values as determined by EPMA <strong>measurements</strong> are<br />
presented here in terms <strong>of</strong> molecularity, m which is defined as the Cu/In ratio. Within the experimental<br />
error, EPMA results indicate that the (Cu+In)/Se ratio is always unity.<br />
3 Surface Morphology<br />
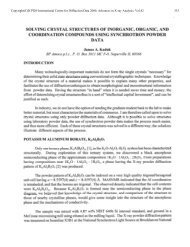
The typical surface morphology <strong>of</strong> films with molecularities less than unity (m ∼ 0.82) and greater than<br />
unity (m ∼ 1.3) are show in Fig. 3 a and b, respectively. The surface morphology <strong>of</strong> films with m1 exhibit long undulations aligned along the [1¯10]<br />
directions. Spacing between these undulations was typically 1-2 microns. The m=1.32 film show in Fig. 3b<br />
had a RMS roughness <strong>of</strong> 6.8 nm while the m=0.82 film had a RMS roughness <strong>of</strong> 18.0 nm.<br />
These surface undulations are associated with elastic <strong>strain</strong> relaxation heteroepitaxial <strong>strain</strong> and have<br />
been seen in other compressively <strong>strain</strong>ed heteroepitaxial systems [7]. It is speculated here that the unique<br />
directional orientation <strong>of</strong> the undulations is related to the 3 x 1 surface reconstruction <strong>of</strong> CuInSe 2 . T hese<br />
surface undulations may also act as stress centers for the selective nucleation <strong>of</strong> dislocations and twins as is<br />
discussed later.<br />
For the film with m>1 (Fig. 3b), there are also what appear to be irregularly shaped inclusions present<br />
on the surface. Cross sectional transmission electron microscopy (XTEM) and voltage dependent EPMA<br />
modeling indicate that these are actually wedge shaped inclusions <strong>of</strong> Cu 2−x Se with x=0.5 that taper to<br />
several tens <strong>of</strong> nanometers into the bulk <strong>of</strong> the layer. Rough estimates indicate that the volume fraction <strong>of</strong><br />
Cu 2−x Se is on the order <strong>of</strong> an atomic percent. EPMA analysis typically assumes that sample composition is<br />
uniform with depth and that characteristic x-<strong>ray</strong> absorption effects can be removed using a standard sample.<br />
Due to the presence <strong>of</strong> the Cu 2−x Se surface phase in Cu-rich films, the composition values for Cu-rich samples<br />
reported here do not reflect the true composition <strong>of</strong> the films and are quoted only to indicate the extent <strong>of</strong><br />
Cu 2−x Se surface phase present, whereas for the In-rich films EPMA values do represent true composition.<br />
4 Relaxation Dynamics<br />
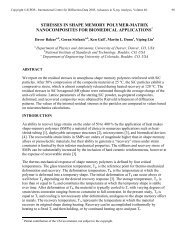
Fig. 4 shows TwoTheta/Omega scans around the CuInSe 2 (008) reflection for a series <strong>of</strong> CuInSe 2 films <strong>of</strong><br />
differing thickness (m >1) grown on a GaAs substrate. A vertical line also indicates the bulk JCPDS powder<br />
data file two theta value corresponding to the relaxed CuInSe 2 (008) position.<br />
Calculations <strong>of</strong> equilibrium critical thickness yield a value on the order <strong>of</strong> 8 nm, but from the figure it<br />
is clear that relaxation has not occurred for films as thick as 40 nm and is only partially complete for films<br />
63 nm thick. Two possible <strong>strain</strong> relief mechanisms are introduced. As mentioned in Sec. 3, the presence <strong>of</strong><br />
undulations implies the elastic relaxation <strong>of</strong> the interfacial misfit by diffusion <strong>of</strong> the larger atoms to areas <strong>of</strong><br />
lower <strong>strain</strong> as has been observed in SiGe alloys.<br />
4
Copyright(c)JCPDS-International Centre for Diffraction Data 2000,Advances in X-<strong>ray</strong> Analysis,Vol.43 205<br />
50nm<br />
40<br />
30<br />
20<br />
10<br />
0<br />
a. In-rich film CdIn4.8 b. Cu-rich film Cu/In-1.3<br />
Figure 3: Atomic Force Microscopy Images <strong>of</strong> as-grown In-rich and Cu-rich CuInSes films.<br />
For the case <strong>of</strong> CuInSes, there is an additional complication <strong>of</strong> the Cu2-xSe surface phase which is tensile<br />
<strong>strain</strong>ed on the surface. We have grown epitaxial Cuz-,Se on GaAs(OO1) and performed <strong>high</strong> <strong>resolution</strong><br />
x-<strong>ray</strong> mapping <strong>measurements</strong> as well as XTEM observations. As the lattice constants <strong>of</strong> the Cuz-,Se phase<br />
almost certainly change with composition, the Cu2-xSe epitaxial layer was grown under the same growth<br />
conditions as the CuInSez layer with the exception that the In cell shutter was closed. EPMA <strong>measurements</strong><br />
indicate a composition <strong>of</strong> Cui.sSe for both the Cuz-,Se/GaAs epitaxial layer and for the Cus-$e surface<br />
layer on CuInSez. The lattice constants <strong>of</strong> the film were nominally a= 0.576 and c=O.574 nm although<br />
there is a monoclinic supercell present as well [S]. While cross sectional TEM observations confirmed the<br />
presence <strong>of</strong> the monoclinic supercell for Cus-,Se/GaAs, similar observations <strong>of</strong> the Cuz-,Se on top <strong>of</strong> the<br />
CuInSes epilayer did not exhibit any supercell spots in selective area diffraction. It is speculated here<br />
that small amounts <strong>of</strong> In from the CuInSez epilayer may inhibit the phase transition to the low temperature<br />
monoclinic phase, causing the crystal structure to remain in the <strong>high</strong>er temperature (T > 125% cubic phase.<br />
This difference in crystal structure along with the slight variation in composition is sufficient to explain the<br />
differences in observed lattice constants.<br />
To further elucidate the details <strong>of</strong> the <strong>strain</strong> relief mechanism, an area map was taken using a 1.2 mm<br />
receiving slit in the vicinity <strong>of</strong> the CuInSez asymmetric (1 . 1 . 10) reflection for a 300 nm CuInSez film grown<br />
on a GaAs substrate. The area map can be seen in Fig. 5. The presence <strong>of</strong> Cus+$Se phase can be clearly<br />
seen in the figure as well as the fact that the Cuz-$Se phase is <strong>strain</strong>ed to the CuInSez in-plane lattice<br />
constant. The lattice constants <strong>of</strong> the Cuz-$Se phase as seen in the figure are a=0.5800 and c=5.704 nm,<br />
consistent with the lattice constants measured for the Cus-$Se film grown epitaxially on a GaAs substrate.<br />
It should be noted here that the Cu2-$e second phase was visible in thinner films <strong>of</strong> the series as well and<br />
always occurred at approximately the same location.<br />
In addition to elastic <strong>strain</strong> relief related to the surface undulations, there is intermixing <strong>of</strong> Ga from<br />
the substrate into the CuInSe2 layer giving rise to elongation <strong>of</strong> the CuInSez (1 + 1 . 10) reflection. This<br />
is a consequence <strong>of</strong> interdiffusion <strong>of</strong> Ga from the substrate into the CuInSes film while Cu diffuses into<br />
the substrate. The interdiffusion has been confirmed by TEM-based EDX observations as well as SIMS<br />
<strong>measurements</strong> <strong>of</strong> the sample. Dynamical simulation <strong>of</strong> the interdiffusion were attempted but the large<br />
mosaic <strong>of</strong> the sample made simulations difficult. Lattice constant changes lead to an estimate <strong>of</strong> a maximum<br />
Ga concentration on the order <strong>of</strong> one percent. From SIMS results the extent <strong>of</strong> the interdiffusion is estimated<br />
to be several hundred angstroms as can be seen in Fig. 6.<br />
Photoluminescence data on the CuInSes/GaAs films indicated only weak free exciton emission at the<br />
5
Copyright(c)JCPDS-International Centre for Diffraction Data 2000, Advances in X-<strong>ray</strong> Analysis,Vol43 206<br />
Log Intensity<br />
5<br />
4<br />
3<br />
2<br />
1<br />
Strained<br />
CuInSe 2<br />
CuInSe 2<br />
(008)<br />
42 126<br />
400 630<br />
2700<br />
1260<br />
Relaxed<br />
CuInSe 2<br />
GaAs<br />
(004)<br />
0<br />
60 61 62 63 64 65 66<br />
Two Theta/Omega<br />
Figure 4: A series <strong>of</strong> 008 TwoTheta/Omega Scans for CuInSe 2 films <strong>of</strong> differing thickness<br />
bandedge and in which a conduction band to donor transition was dominant. To eliminate the possibility<br />
that threading dislocations were the cause <strong>of</strong> the weak near-bandedge photoluminescence emissions, CuInSe 2<br />
was grown on a In 0.29 Ga 0.71 As linear grade buffer with a room temperature lattice mismatch <strong>of</strong> 0.2%.<br />
Photoluminescence on these films showed sharp bandedge emission in which the free exciton and its excited<br />
states were dominant and the conduction band to acceptor transition was dramatically reduced[9].<br />
Triple axis <strong>measurements</strong> <strong>of</strong> the a and c lattice constants <strong>of</strong> CuInSe 2 grown on GaAs and the pseudosubstrate<br />
were performed. The a differences in the a lattice constants along the two orthogonal < 110 ><br />
directions were ∆a/a avg ≤ 0.1% for CuInSe 2 on GaAs while a difference <strong>of</strong> ∆a/a avg ≤ 0.2% was observed for<br />
the case <strong>of</strong> a CuInSe 2 grown on the pseudosubstrate. The average <strong>of</strong> the lattice constants along the two orthogonal<br />
directions were a=0.57920 and c=1.16149 nm for CuInSe 2 /GaAs and a=5.7835 and c=1.16175 nm<br />
for the case <strong>of</strong> CuInSe 2 grown on the pseudosubstrate. This indicates that the CuInSe 2 film grown on the<br />
pseudosubstrate is nearly perfectly relaxed while that grown on GaAs direction is under slight tensile <strong>strain</strong>.<br />
This is attributed to the factor <strong>of</strong> two difference in the thermal expansion coefficient <strong>of</strong> CuInSe 2 over GaAs<br />
in conjunction with the poorer activation <strong>of</strong> slip during the cooling <strong>of</strong> the substrate from growth to room<br />
temperature for the CuInSe 2 grown on GaAs as opposed to the layer grown on a pseudosubstrate. This is<br />
in turn a consequence <strong>of</strong> the <strong>high</strong>er density <strong>of</strong> misfit dislocations in the CuInSe 2 grown directly on GaAs.<br />
The complex <strong>strain</strong> interactions among these dislocations limit slip in the CuInSe 2 /GaAs case relative to<br />
the lower dislocation density <strong>of</strong> the CuInSe 2 film grown on the pseudosubstrate.<br />
The FWHM <strong>of</strong> the CIS (008) rocking curves were nearly identical with values 0.117 and 0.106 degrees<br />
for CuInSe 2 on GaAs and the pseudosubstrate, respectively. This is not surprising in light <strong>of</strong> the reduction<br />
in threading dislocation density as confirmed by cross sectional TEM. This is consistent with recent microdiffraction<br />
<strong>measurements</strong> <strong>of</strong> SiGe alloys grown on Si and linearly graded buffers in which it was found that<br />
domains <strong>of</strong> dislocation free blocks present in the SiGe film grown on the graded buffer were significantly<br />
larger than those <strong>of</strong> the SiGe film grown directly on the Si substrate regardless <strong>of</strong> the fact that both films<br />
had similar mosaic structures as measured by conventional x-<strong>ray</strong> diffraction [10].<br />
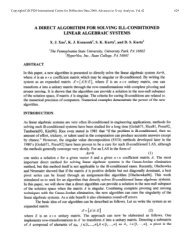
Fig. 7 shows two-dimensional x-<strong>ray</strong> reciprocal maps <strong>of</strong> the asymmetric chalcopyrite (309) reflection for<br />
CuInSe 2 grown on GaAs and a pseudosubstrate. The maps were taken using a 1.2 mm receiving slit. As the<br />
chalcopyrite peak arises from the difference in scattering between the two cations, it is absent in the GaAs<br />
layer allowing a more detailed examination <strong>of</strong> interdiffusion in the pseudosubstrate grown film. As can be<br />
seen in the figure, there is a clear asymmetry in the (309) reflection from the CuInSe 2 grown on the GaAs<br />
substrate, whereas in for the layer grown on the pseudosubstrate no asymmetry can be seen.<br />
The presence <strong>of</strong> interdiffusion for the more <strong>high</strong>ly <strong>strain</strong>ed case may be related to differences in threading<br />
6
Copyright(c)JCPDS-International Centre for Diffraction Data 2000, Advances in X-<strong>ray</strong> Analysis,Vol43 207<br />
GaAs<br />
5.55<br />
Q[001] ( -1 )<br />
5.5<br />
5.45<br />
5.4<br />
Cu 2-x<br />
Se<br />
CuInSe 2<br />
z<br />
> 50.<br />
< 50.<br />
< 45.<br />
< 40.<br />
< 35.<br />
< 30.<br />
< 25.<br />
< 20.<br />
< 15.<br />
< 10.<br />
< 5.<br />
5.35<br />
-1.65 -1.6 -1.55 -1.5 -1.45<br />
Q[110] ( -1 )<br />
Figure 5: X-Ray reciprocal space map near the (1 · 1 · 10) CuInSe 2 reflection<br />
Number<br />
2.0<br />
1.5<br />
1.0<br />
speculated<br />
interface<br />
location<br />
Se<br />
In<br />
Cu<br />
Ga<br />
As<br />
0.5<br />
0.0<br />
0<br />
200<br />
400 600 800<br />
Depth (channels)<br />
1000<br />
1200<br />
Figure 6: Normalized SIMS results for a 800 nm CuInSe 2 film grown on GaAs at 500 ◦ C<br />
Q[001] (Å -1 )<br />
5.1<br />
5.05<br />
5<br />
4.95<br />
4.9<br />
4.85<br />
4.8<br />
4.75<br />
Intensity<br />
> 64.<br />
< 64.<br />
< 32.<br />
< 16.<br />
< 8.<br />
< 4.<br />
< 2.<br />
< 1.<br />
A)<br />
Ga<br />
Interdiffusion<br />
5<br />
4.95<br />
4.9<br />
4.85<br />
4.8<br />
4.75<br />
4.7<br />
Intensity<br />
> 9.75<br />
< 9.75<br />
< 9.08<br />
< 8.41<br />
< 7.74<br />
< 7.08<br />
< 6.41<br />
< 5.74<br />
< 5.08<br />
< 4.41<br />
< 3.74<br />
< 3.08<br />
< 2.41<br />
< 1.74<br />
< 1.07<br />
< 0.41<br />
3.1 3.15 3.2 3.25 3.3 3.35 3.4 3.45<br />
3.1 3.2 3.3 3.4<br />
Q[100] (Å -1 ) Q[100] (Å -1 )<br />
B)<br />
Figure 7: X-<strong>ray</strong> reciprocal space maps <strong>of</strong> the chalcopyrite (309) reflection for a) CuInSe 2 /GaAs and<br />
b)CuInSe 2 /In 0.29 Ga 0.71 As pseudosubstrates<br />
7
Copyright(c)JCPDS-International Centre for Diffraction Data 2000, Advances in X-<strong>ray</strong> Analysis,Vol43 208<br />
dislocation densities between the two systems, but more work must be done to elucidate the mechanism for<br />
the interdiffusion.<br />
5 Annealing Experiments<br />
Typical (hole) resistivity for Cu-rich CuInSe 2 is typically on the order <strong>of</strong> 2x10 −2 Ω − cm due to the presence<br />
<strong>of</strong> the conductive Cu 2−x Se phase. Upon annealing <strong>of</strong> a Cu-rich, 800 nm thick sample (m=1.32) for 30<br />
minutes at 540 ◦ C in an Ar ambient, it was found that the resistivity <strong>of</strong> the sample had increased over three<br />
orders <strong>of</strong> magnitude to 300 Ω − cm. AFM observations also indicated that the inclusions on the surface <strong>of</strong><br />
the CuInSe 2 had vanished leaving holes in their place. This resulted in an increase in RMS surface roughness<br />
from 6.85 to 8.34 nm for the as-grown and 540 ◦ C annealed samples, respectively. The (hall) mobility also<br />
showed a dramatic increase from a value in the low teens to over 100cm 2 /V − s, a value significantly <strong>high</strong>er<br />
than bulk stoichiometric CuInSe 2 . This implied that the Cu-rich surface layer had diffused into the GaAs<br />
substrate. As one <strong>of</strong> the levels <strong>of</strong> Cu in GaAs is a low activation energy acceptor, a likely explanation is that<br />
the Cu-component diffused through the CuInSe 2 matrix into the substrate.<br />
Q[001] ( -1 ) Q[001] ( -1 )<br />
3.4<br />
3.35<br />
3.3<br />
3.25<br />
3.2<br />
3.4<br />
3.35<br />
3.3<br />
3.25<br />
3.2<br />
3.4<br />
A) 3.35 B)<br />
3.3<br />
3.25<br />
3.2<br />
1.5 1.525 1.55 1.575 1.6 1.625 1.5 1.525 1.55 1.575 1.6 1.625<br />
3.375<br />
C) 3.35 D)<br />
3.325<br />
3.3<br />
3.275<br />
3.25<br />
3.225<br />
3.2<br />
1.5 1.525 1.55 1.575 1.6 1.625<br />
Q[110] ( -1 )<br />
1.5 1.52 1.54 1.56 1.58 1.6 1.62<br />
Q[110] ( -1 )<br />
Figure 8: (113) (low incidence) x-<strong>ray</strong> reciprocal space maps for a) In-rich as-grown, b) In-rich 540C Ar<br />
annealed, c) Cu-rich as-grown, and d) Cu-rich 540C Ar annealed CuInSe 2 samples<br />
From photoluminescence as well as positron annihilation experiments, it was was found that the dominant<br />
residual point defect in Cu-rich CuInSe 2 is Cu-vacancies V Cu [11]. This implies that there is a large<br />
concentration <strong>of</strong> V Cu available to assist mass diffusion. It should be noted here that the Cu 2−x Se surface<br />
phase is a well know superionic conductor whose conduction mechanism lies principally with the very <strong>high</strong><br />
mobility <strong>of</strong> Cu atoms which move through a cubic symmetry shell provided by the Se atoms. It is surmised<br />
here that the Cu atoms migrate through the V Cu rich CuInSe 2 layer into the substrate to form a p-doped,<br />
but still <strong>high</strong> resistive layer on the GaAs side <strong>of</strong> the interface. As Se evaporates readily in the 540 ◦ Cambient<br />
used, the effect <strong>of</strong> annealing on Cu-rich CuInSe 2 films is to induce a dramatic increase in resistivity with the<br />
vanishing <strong>of</strong> the metallic Cu 2−x Se surface phase. At the same time Hall <strong>measurements</strong> indicate a dramatic<br />
8
Copyright(c)JCPDS-International Centre for Diffraction Data 2000, Advances in X-<strong>ray</strong> Analysis,Vol43 209<br />
rise in mobility. The change in mobility is a reflection <strong>of</strong> the doping <strong>of</strong> the <strong>high</strong>er mobility undoped GaAs<br />
substrate. It is well known that the diffusion lengths at the annealing temperature <strong>of</strong> 540 ◦ Caresuchthat<br />
Cu will diffuse throughout the substrate.<br />
Glancing incidence asymmetric diffraction experiments were performed on the Cu-rich (m=1.32) sample<br />
described above as well as an In-rich (m=0.82) sample using a triple axis configuration and are shown in<br />
Fig. 8. This glancing incidence geometry has the advantage that the penetration depth <strong>of</strong> the sample due to<br />
absorption and extinction effects is on the order <strong>of</strong> a micron, resulting in an increase in surface and interface<br />
sensitivity. It is clear from the figure that while there is no apparent interdiffusion for the as grown samples<br />
(A In-rich and B Cu-rich), after annealing for 30 minutes at 540 ◦ C in an Ar ambient, there is significant<br />
interdiffusion only for sample D, the Cu-rich sample. In contrast, there is no apparent change for the In rich<br />
sample post annealing (Fig.8D). Annealing was also performed at the intermediate temperature (not shown)<br />
<strong>of</strong> 410 ◦ C (30 minutes, Ar ambient) for both In-rich and Cu-rich samples. No change in the {113} reciprocal<br />
maps nor in sample conductivity or mobility was observed.<br />
Figure 9: High <strong>resolution</strong> TEM cross sections <strong>of</strong> the CuInSe 2 /GaAs interface for a) Cu-rich and b) In-rich<br />
films<br />
Lateral correlation lengths were calculated from asymmetric {113} reflections by trigonometrically deconvolving<br />
the effects <strong>of</strong> mosaic tilt as has been described by Fewster [12]. For In-rich and Cu-rich films,<br />
the correlation lengths were on the order <strong>of</strong> 80 and 60 nm, respectively. After annealing, the lateral correlation<br />
was observed to decrease slightly to 70 and 50 nm for the Cu-rich and In-rich films, respectively.<br />
While the decrease in correlation length for the Cu-rich film may be related to interdiffusion, the decrease<br />
in correlation for the In-rich film is more likely associated with the emergence <strong>of</strong> the stannite phase. This is<br />
further corroborated by the fact that [001] lattice normal scans showed a factor <strong>of</strong> two increase in {00 · 2n}<br />
reflections before and after annealing.<br />
A possible explanations for the difference in annealing behavior lies in the point defect composition <strong>of</strong><br />
the Cu-rich phase and its resulting effects on interdiffusion. Typical phase image XTEM cross sections <strong>of</strong><br />
both Cu-rich and In-rich CuInSe 2 are shown in Fig.9. It is clear from the figure that there is significantly<br />
more contrast at the GaAs/CuInSe 2 interface for the Cu-rich film. The areas <strong>of</strong> lighter contrast evident in<br />
Fig.9a, did not change with tilt implying that they were probably voids. The In-rich interface seen in Fig.9b,<br />
in contrast, has no such void-like regions and the interface is relatively abrupt.<br />
6 Twinning<br />
Concomitant with a change from Cu-rich to In-rich morphology is a dramatic increase in twin concentration.<br />
The existence <strong>of</strong> these growth twins is undesirable from a device point <strong>of</strong> view and thus it is <strong>of</strong> interest<br />
to study the conditions under which they form. To examine the dependence on twinning more closely, a<br />
series <strong>of</strong> four CuInSe 2 layers <strong>of</strong> differing Cu/In ratio were grown on GaAs(001) substrates and were then<br />
examined using pole figure analysis. The chalcopyrite (103) poles was chosen for study as they eliminate the<br />
possibility <strong>of</strong> interference from the substrate and also provide information about unit cell orientation (e.g.<br />
the tetragonal c axis). In the kinematic approximation the chalcopyrite reflections arise from the difference<br />
9
Copyright(c)JCPDS-International Centre for Diffraction Data 2000, Advances in X-<strong>ray</strong> Analysis,Vol43 210<br />
in scattering from the two different cations or (f Cu − f In ) 2 . As in the sphalerite case there is only one type<br />
<strong>of</strong> cation this reflection is not allowed.<br />
Growth twins in CuInSe 2 are 180 ◦ rotation twins about {112} poles. In total, (in the upper half plane)<br />
there are 24 different crystallographic directions into which the original four {103} poles can transform. By<br />
the action <strong>of</strong> a single rotational twinning operation the original four {103} reflections are transformed from<br />
a position which makes approximately a 33 ◦ angle with the (001) surface normal to eight different positions<br />
making approximately a 50 ◦ angle with respect to the surface normal.<br />
A<br />
_<br />
(1 1 2)<br />
B<br />
_<br />
(1 1 2)<br />
(1 0 3) T<br />
(0 1 3)<br />
(0 1 3) T<br />
(1 0 3)<br />
_<br />
(0 1 3)<br />
_<br />
(1 0 3)<br />
_<br />
(0 1 3) T<br />
_<br />
(1 0 3)<br />
_ _<br />
(1 1 2)<br />
(1 1 2)<br />
(1 0 3) _ _<br />
T (1 0 3) (0 1 3) (0 1 3) T<br />
_<br />
(1 1 2)<br />
(1 __<br />
1 2)<br />
_<br />
_<br />
_<br />
(1 1 2) T<br />
(1 1 2) T<br />
_<br />
(0 1 3) (1 0 3) _<br />
(0 13) T (1 0 3) T<br />
_<br />
(1 1 2)<br />
_<br />
(1 1 2)<br />
Figure 10: {103} pole figures for a) Cu-rich (m=1.19) and b) In-rich (m=0.85) CuInSe 2 grown on GaAs<br />
Pole figures for two <strong>of</strong> the samples (Cu-rich m=1.19 and In-rich m=0.85) are shown in Fig.10. It is<br />
clear that there is a sharp drop in twin concentration in going from In-rich to Cu-rich compositions. Taking<br />
the ratio <strong>of</strong> the integrated intensity <strong>of</strong> the original {103} poles to that <strong>of</strong> those in twinning positions (after<br />
correcting for geometrical effects) gives a rough estimate <strong>of</strong> the twinned volume. For the Cu-rich film shown<br />
in Fig.10a, the volume <strong>of</strong> twins is ≤ 1 ± 0.3 volume percent. In addition, the twins were to exclusively form<br />
around the (112) poles. On the other hand, for the In-rich films, an example <strong>of</strong> which is shown in Fig.10b,<br />
twins form about all four {112} poles with a twinned volume <strong>of</strong> ∼ 3 ± 0.3 volume percent. This anisotropy<br />
<strong>of</strong> twinning is observed for all samples.<br />
High <strong>resolution</strong> TEM confirms that the twinning occurs predominantly in the form <strong>of</strong> microtwinning with<br />
characteristic lengths <strong>of</strong> about 20 nm. TEM observations also showed that for Cu-rich material, twins are<br />
mostly confined to near the interface with a decreasing concentration towards the surface, presumably due to<br />
recombination <strong>of</strong> bounding partial dislocations on alternative {112} glide planes. For In-rich films, however,<br />
twins were found to extend throughout the sample volume. As weak stannite reflections (h+k+l=2n) are<br />
observed for In-rich films, the low stacking fault energy <strong>of</strong> In-rich films may be a consequence <strong>of</strong> the coexistence<br />
<strong>of</strong> the vacancy stabilized stannite structure along with the chalcopyrite structure. Indeed, local density<br />
functional calculations have predicted in GaAs that dislocation energies can be influenced by impurities[13].<br />
It should also be noted that for the {112} planes (as opposed to the {1¯12} planes) are terminated with a<br />
cation surface, further suggesting the link between point defects (divacancies) and the anisotropy in twinning.<br />
Recent experiments have also indicated that the introduction <strong>of</strong> oxygen during growth <strong>of</strong> In-rich films<br />
dramatically reduces the number <strong>of</strong> growth twins about all {1¯12} poles.<br />
Photoluminescence and positron annihilation experiments indicate that for In-rich films the predominant<br />
(optically active) point defect is a divacancy which consistent <strong>of</strong> a copper vacancy and a selenium vacancy on<br />
adjacent sites. By the introduction <strong>of</strong> a small amount <strong>of</strong> oxygen during growth, it is possible to significant<br />
reduce the number <strong>of</strong> Se vacancies. With the introduction <strong>of</strong> oxygen, the dominant defect observed by<br />
10
Copyright(c)JCPDS-International Centre for Diffraction Data 2000, Advances in X-<strong>ray</strong> Analysis,Vol43 211<br />
photoluminescence is the conduction band copper vacancy transition, the same as for the case <strong>of</strong> Cu-rich<br />
material. It is likely that this change in point defect type is direction related to the reduction in twin<br />
concentration upon the introduction <strong>of</strong> oxygen during growth. Currently, further studies are under way to<br />
clarify this interrelationship.<br />
7 Conclusion<br />
Several crystallographic features <strong>of</strong> Cu-rich and In-rich CuInSe 2 have been summarized. There is apparently<br />
extremely fast diffusion in Cu-rich CuInSe 2 , but comparatively little interdiffusion in In-rich CuInSe 2 .This<br />
fact is reflected in that optimal (large) grain growth in polycrystalline CuInSe 2 films used for photovoltaics<br />
are typically grown in at least two stages, the earlier <strong>of</strong> which is inevitably Cu-rich while the final composition<br />
is adjusted to become slightly In-rich so as to eliminate the possibility <strong>of</strong> Cu 2−x Se induced shunt paths which<br />
act to reduce the open circuit voltage <strong>of</strong> photovoltaics made from the layers. This larger grain growth is a<br />
direct consequence <strong>of</strong> the <strong>high</strong>er diffusion lengths in Cu-rich CuInSe 2 over In-rich CuInSe 2 .<br />
That points defects in CuInSe 2 as a function <strong>of</strong> stoichiometry play an important role in determining<br />
optical and electrical properties is well established, but still only partially understood due to the complex<br />
dynamics <strong>of</strong> the system. The apparent importance <strong>of</strong> point defects and hence composition in diffusion is yet<br />
another reflection <strong>of</strong> this.<br />
References<br />
[1] Takeshi Hanada, Ph.D dissertation, Tokyo Institute <strong>of</strong> Technology (1996)<br />
[2] M.A.L. Johnson, Shizuo Fujita, W.H. Rowland Jr., W.C. Hughes, J.W. Cook Jr., and J.F. Schetzina,<br />
Journal <strong>of</strong> Electronic Materials 25, 855 (1996).<br />
[3] Niki, S., Makita, Y., Yamada, A., Obara, A. Misawa , S., Igarashi, O., Aoki, K., and Kutsuwada, N.,<br />
JpnJ.Appl.Phys.33, L500 (1994).<br />
[4] Fitzgerald, E.A., Xie, Y.-H. Greene, M. L., Brasen, D., Kortan, A. R., Michel, J., Mii, Y. -J., and Weir,<br />
B. E., Appl. Phys. Lett. 59, 811 (1991).<br />
[5] Chang,J.P.,Chin,T.P.,Tu,C.W.,Kavanagh,K.L,Appl.Phys.Lett.63, 500 (1993).<br />
[6] A. Yamada, P. Fons, S. Niki and H. Oyanagi. , Jpn. J. Appl. Phys. 2, Lett., 38, L96 (1999).<br />
[7] A.G. Cullis, Mat. Res. Soc. Symp. Proc., 399 (1996).<br />
[8] P. Fons, S. Niki, A. Yamada, and H. Oyanagi, J. Appl. Phys., 12, 6926 (1998).<br />
[9] S.Niki, P.J. Fons, A. yamada, T. Kurafuji, S. Chichibu, H. Nakanishi, W.G. Bi, and C.W. Tu, Appl.<br />
Phys. Lett., 69, 647 (1996).<br />
[10] P.M. Mooney, J.L. Jordan-Sweet, I.C. Noyan, S.K. Kaldor, and P.-C. Wang, Appl. Phys. Lett. 74, 726<br />
(1999).<br />
[11] S.Niki, R. Suzuki, S. Ishibashi, P. Fons, A. Yamada, H. Oyanagi, N. Sakai, and H. Yokokawa, Proc. <strong>of</strong><br />
2nd World Conf. on Photovoltaic Solar Energy Conversion, Vienna Austria (1998).<br />
[12] P.F. Fewster in: X-<strong>ray</strong> and Neutron Dynamical Diffraction, Eds. André Authier, Stefano Lagomarsion<br />
and Brian K. Tanner (Plenum Press, N.Y., 1996) p.283.<br />
[13] P. Stich, R. Jones, S. Öberg, and M.I. Heggie, Phys. Rev. B, 50, 17717 (1994).<br />
11