Thermodynamics of High Temperature Materials Systems
Thermodynamics of High Temperature Materials Systems
Thermodynamics of High Temperature Materials Systems

You also want an ePaper? Increase the reach of your titles
YUMPU automatically turns print PDFs into web optimized ePapers that Google loves.
Freiberg University <strong>of</strong> Mining and<br />
Technology, Germany<br />
<strong>Thermodynamics</strong> <strong>of</strong> <strong>High</strong> <strong>Temperature</strong><br />
<strong>Materials</strong> <strong>Systems</strong><br />
Hans Jürgen Seifert<br />
Summer School<br />
Advanced Thermostructural <strong>Materials</strong><br />
Santa Barbara, August 9, 2006
<strong>Thermodynamics</strong> <strong>of</strong> <strong>High</strong> <strong>Temperature</strong> <strong>Materials</strong> <strong>Systems</strong><br />
Outline<br />
Hans Jürgen Seifert<br />
1. Introduction and motivation for thermodynamic calculations<br />
- Computational thermodynamics<br />
- CALPHAD approach (CALculation <strong>of</strong> PHAse Diagrams)<br />
- Thermodynamic databases and s<strong>of</strong>tware<br />
2. Thermodynamic optimization <strong>of</strong> the Ce-O system<br />
- Thermodynamic modeling <strong>of</strong> solution phases<br />
3. Precursor-derived Si-(B-)C-N ceramics<br />
- <strong>High</strong> temperature reactions <strong>of</strong> silicon carbide and silicon<br />
nitride ceramics<br />
- Crystallization and high temperature stability <strong>of</strong><br />
Si-(B-)C-N ceramics
<strong>Thermodynamics</strong> <strong>of</strong> <strong>High</strong> <strong>Temperature</strong> <strong>Materials</strong> <strong>Systems</strong><br />
Outline<br />
Hans Jürgen Seifert<br />
4. Computational thermodynamics in heat shield<br />
engineering<br />
- The Y-Si-C-O system database<br />
- Active / passive oxidation <strong>of</strong> SiC<br />
- Phase reactions <strong>of</strong> Yttrium silicates and C/C-SiC<br />
composites<br />
- <strong>High</strong> temperature stability issues in the<br />
engineering <strong>of</strong> heat shields<br />
5. Conclusions
Combined Approach<br />
Computational<br />
<strong>Thermodynamics</strong> and<br />
Modeling<br />
+<br />
Experiments, Analysis<br />
Fundamental Research<br />
<strong>Materials</strong> Engineering,<br />
Processing
Computational <strong>Thermodynamics</strong><br />
Theory<br />
Quantum Mechanics,<br />
Statistical<br />
<strong>Thermodynamics</strong><br />
Estimates<br />
Experiments<br />
DTA, Calorimetry,<br />
EMF, Knudsen Effusion,<br />
Metallography,<br />
X-ray Diffractometry, ...<br />
CALPHAD<br />
Optimization<br />
Ab-initio<br />
Calculation<br />
Models<br />
with adjustable<br />
Parameters<br />
Adjustment <strong>of</strong><br />
Parameters<br />
CALculation<br />
<strong>of</strong> PHAse Diagrams<br />
Thermodyn. Functions<br />
G, H, S, C p<br />
Storage in<br />
Databases<br />
Equilibrium<br />
Calculations<br />
Application<br />
Equilibria<br />
Phase Diagrams<br />
Kinetics<br />
Graphical<br />
Representation
CALPHAD (CALculation <strong>of</strong> PHAse Diagrams)<br />
• Development <strong>of</strong> Optimized Thermodynamic Datasets<br />
stored in Computer Databases<br />
• Calculation <strong>of</strong> :<br />
- Thermodynamic Functions<br />
- Liquidus Surface<br />
- Isothermal Sections<br />
- Isopleths<br />
- Potential Phase Diagrams<br />
- Phase Fraction Diagrams<br />
- Phase Compositions<br />
- Scheil Solidification<br />
…<br />
Requires Modeling <strong>of</strong> Stoichiometric and Solution Phases<br />
Taking into Account the (Crystal-) Structures and Site<br />
Occupancies
CALPHAD (CALculation <strong>of</strong> PHAse Diagrams)<br />
S<strong>of</strong>tware<br />
• LUKAS (BINGSS, BINFKT, TERGSS, TERFKT)<br />
• THERMO-CALC<br />
• FACTSAGE<br />
• PANDAT<br />
• MALT, MALT2<br />
• MTDATA<br />
• JMATPRO<br />
• GEMINI<br />
• ...
CALPHAD (CALculation <strong>of</strong> PHAse Diagrams)<br />
Databases<br />
• SGTE, Scientific Group Thermodata Europe<br />
- SSOL2, SSOL4<br />
- SSUB3<br />
- Noble Metals<br />
• Thermo-Calc: Steels, Ni-base, slags, ...<br />
• ThermoTech: Ni-base, Al-, Mg-, ...<br />
• PML: Al-, Ceramics<br />
• ...
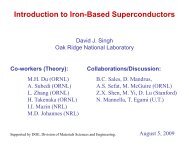
Calculated Ce–O System in Solid State from 60 to 67 mol. % O<br />
in comparison with experimental data.
Phases in the Partial Ce – O System<br />
Related Crystal Structures:<br />
CeO 2-x (ss) CaF 2 - type (Strukturbericht C1)<br />
Compound Energy Formalism:<br />
(Ce +3 , Ce +4 ) 1 (O -2 ,Va) 2<br />
C-Ce 2 O 3 (ss) Mn 2 O 3 - type (Strukturbericht D5 3 , Ordered State <strong>of</strong> C1)<br />
Unit Cell: composed <strong>of</strong> 8 CaF 2 -type cells. ¼ <strong>of</strong> O-ions removed,<br />
remaining atoms re-arrange towards these vacancies.<br />
Compound Energy Formalism:<br />
(Ce +3 , Ce +4 ) 2 (O -2 ) 3 (O -2 ,Va) 1<br />
Contains more O atoms than the ideal formula <strong>of</strong> the Mn 2 O 3 .<br />
Ce 2 O 3 Stoichiometric phase description (Strukturbericht D5 2 )
“Compound Energy” Formalisms –<br />
Reference Compounds<br />
(A,B) k (D,E) l<br />
Solution phase with<br />
two sublattices and 4 species<br />
Four compounds defined:<br />
A : D<br />
A : E<br />
B : D<br />
B : E<br />
Gibbs free energy for every compound to be determined<br />
Here:<br />
(Ce +3 , Ce +4 ) 1 (O -2 ,Va) 2
“Compound Energy” Formalism –<br />
Surface <strong>of</strong> Reference<br />
(A,B) k (D,E) l<br />
Solution phase with<br />
two sublattices and 4 species
Modeling <strong>of</strong> solution phases; sublattice model described in<br />
the Compound Energy Formalism<br />
(A,B) k (D,E) l<br />
Solution phase with<br />
two sublattices and 4 species<br />
Stochiometric coefficient (s: sublattice)<br />
Site fraction <strong>of</strong> spezies A on<br />
sublattice s
Compound Energy Formalism –<br />
Excess term <strong>of</strong> Gibbs free energy<br />
(A,B) k (D,E) l<br />
Solution phase with<br />
two sublattices and 4 species
Compound Energy Formalisms –<br />
Gibbs free energy <strong>of</strong> solution phases<br />
Mixing Gibbs Energy
Phases in the Partial Ce – O System<br />
CeO 2-x (ss) CaF 2 - type (Strukturbericht C1)<br />
Compound Energy Formalism:<br />
(Ce +3 , Ce +4 ) 1 (O -2 ,Va) 2<br />
Cubic close pack <strong>of</strong> Ce ions, where all the tetrahedral voids form the<br />
sublattice on which the 2-x O-ions are statistically distributed.<br />
Electroneutrality condition determines that site fractions on the two<br />
sublattices are not independent: Single variable y is equal 2·x.<br />
'<br />
y Ce<br />
+ 3 =<br />
'<br />
y Ce<br />
+<br />
y<br />
4 = (1 − y)<br />
''<br />
y Va<br />
=<br />
''<br />
y O<br />
−2<br />
y<br />
4<br />
1−<br />
y<br />
=<br />
4
No.<br />
Paper<br />
Experimental<br />
Technique<br />
Measured<br />
Quantity<br />
Composition<br />
<strong>Temperature</strong><br />
(K)<br />
Remark<br />
1.<br />
Bevan &<br />
Kordis<br />
(1964)<br />
Experiment<br />
with CO 2<br />
/CO<br />
& H 2<br />
O/H 2<br />
Partial<br />
pressures<br />
O 2<br />
CeO 1.5-<br />
CeO 2<br />
909 - 1442<br />
+<br />
2.<br />
Ackerman &<br />
Rauh<br />
(1971)<br />
Mass<br />
Spectroscopy<br />
& Mass<br />
Effusion<br />
Partial<br />
pressures<br />
CeO, CeO 2,<br />
Ce(g), CeO<br />
CeO 1.51 -<br />
-<br />
CeO 1.53<br />
CeO 1.5<br />
-<br />
CeO 1.34<br />
2000 - 3000<br />
1600 - 2000<br />
1825 - 2320<br />
1550 – 2040<br />
+<br />
3.<br />
Iwasaki &<br />
Katsura<br />
(1971)<br />
Experiment<br />
with CO 2<br />
&<br />
CO 2<br />
/H 2<br />
mixture<br />
Partial<br />
pressures<br />
O 2<br />
CeO 2.00<br />
900, 1000,<br />
1100, 1227,<br />
1300<br />
+<br />
4.<br />
Campserveux<br />
& Gerdanian<br />
(1978)<br />
Micro-<br />
Calorimetry<br />
Partial<br />
pressures<br />
O 2<br />
CeO 2<br />
1353, 1296,<br />
1244<br />
+<br />
5.<br />
Kitayama<br />
et al.<br />
(1985)<br />
Thermogravimetry<br />
Partial<br />
pressures<br />
O 2<br />
CeO 2<br />
,<br />
Ce 2<br />
O 3<br />
Ce 3<br />
O 5<br />
1000 – 1330<br />
+
6.<br />
Marushkin<br />
et al. (2000)<br />
Knudsen cell,<br />
Mass<br />
spectrometry<br />
Partial<br />
pressures,<br />
CeO 2<br />
, Ce 2<br />
O 3<br />
CeO 1.99,<br />
Ce 2<br />
O 2.96<br />
1900-2150<br />
1850-2050<br />
-<br />
7.<br />
Kuznetzov&<br />
Rezukhina<br />
(1960)<br />
Calorimetry<br />
Heat capacity,<br />
CeO 2<br />
608-1172<br />
-<br />
8.<br />
Westrum &<br />
Beale Jr.<br />
(1961)<br />
Adiabatic<br />
Calorimetry<br />
Heat capacity,<br />
CeO 2<br />
5-300<br />
+<br />
9.<br />
Justice &<br />
Westrum<br />
(1969)<br />
Cryogenic<br />
Calorimetry<br />
Heat capacity<br />
Ce 2<br />
O 3.02<br />
5-350<br />
+<br />
10.<br />
Basily & El-<br />
Sharkawy<br />
(1979)<br />
Plane<br />
temperature<br />
wave method<br />
Heat capacity<br />
Ce 2<br />
O 3<br />
400-1000<br />
+<br />
11.<br />
Ricken et al.<br />
(1984)<br />
Calorimetry<br />
Specific heat,<br />
∆H trans.<br />
CeO 1.72<br />
–<br />
CeO 2<br />
320-1200<br />
-<br />
12.<br />
Kuznetzov, et<br />
al. (1960)<br />
Bomb<br />
calorimetry<br />
∆H for Ce 2<br />
O 3<br />
Ce 2<br />
O 3.00<br />
298<br />
+
13.<br />
Baker &<br />
Holley<br />
(1968)<br />
Oxygen<br />
Bomb<br />
Calorimetry<br />
Heat <strong>of</strong><br />
combustion<br />
Ce 2<br />
O 3<br />
Ce 2<br />
O 3<br />
298.15<br />
-<br />
14.<br />
Baker, Huber,<br />
Holley &<br />
Krikorian<br />
(1971)<br />
Bomb<br />
calorimetry<br />
Heat <strong>of</strong><br />
formation<br />
CeO 2<br />
, CeC 1.5<br />
,<br />
CeC 2<br />
CeO 2<br />
298.15<br />
-<br />
15.<br />
Campserveux<br />
& Gerdanian<br />
(1974)<br />
Micro<br />
Calorimetry<br />
Partial molal<br />
enthalpy<br />
∆H soln.<br />
(O 2<br />
)<br />
CeO 1.5<br />
–<br />
CeO 2<br />
1353<br />
+<br />
16.<br />
Panlener,<br />
Blementhal &<br />
Garnier(1975)<br />
Thermogravimetry<br />
∆W/W<br />
CeO 2-x<br />
1023-1773<br />
+<br />
17<br />
Riess,<br />
Koerner &<br />
Noelting<br />
Dilatometry<br />
Thermal<br />
expansion<br />
coefficient<br />
CeO 1.79<br />
–<br />
CeO 2<br />
320-1200<br />
+<br />
(1988)
Calculated Ce–O System in Solid State from 60 to 67 mol. % O<br />
in comparison with experimental data.
Heat capacities <strong>of</strong> Ce 2<br />
O 3<br />
and CeO 2<br />
.<br />
Enthalpy increment (heat contents) <strong>of</strong><br />
CeO 2<br />
.<br />
H.J. Seifert, P. Nerikar, H.L. Lukas, Int. J. Mater. Res. 97 [6] (2006) 744-752.
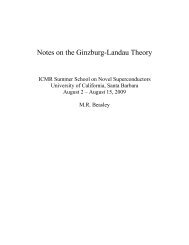
Chemical potentials <strong>of</strong> oxygen for ceria as a function <strong>of</strong> composition<br />
and temperature.
Chemical potentials <strong>of</strong> oxygen for ceria as a function <strong>of</strong> composition<br />
and temperature.
Chemical potentials <strong>of</strong> oxygen for ceria as a function <strong>of</strong> composition<br />
and temperature.
Chemical potentials <strong>of</strong> oxygen for ceria as a function <strong>of</strong> composition<br />
and temperature.
Chemical potentials <strong>of</strong> oxygen for ceria as a function <strong>of</strong> composition<br />
and temperature.
Chemical potentials <strong>of</strong> oxygen in the two-phase areas.
Partial Enthalpies <strong>of</strong> Oxygen in CeO 2<br />
kJ/mol<br />
HH CeO 2 CeO2<br />
O O<br />
Mole fraction O
<strong>Thermodynamics</strong> <strong>of</strong> <strong>High</strong> <strong>Temperature</strong> <strong>Materials</strong> <strong>Systems</strong><br />
Outline<br />
Hans Jürgen Seifert<br />
1. Introduction and motivation for thermodynamic calculations<br />
- Computational thermodynamics<br />
- CALPHAD approach (CALculation <strong>of</strong> PHAse Diagrams)<br />
- Thermodynamic databases and s<strong>of</strong>tware<br />
2. Thermodynamic optimization <strong>of</strong> the Ce-O system<br />
- Thermodynamic modeling <strong>of</strong> solution phases<br />
3. Precursor-derived Si-(B-)C-N ceramics<br />
- <strong>High</strong> temperature reactions <strong>of</strong> silicon carbide and silicon<br />
nitride ceramics<br />
- Crystallization and high temperature stability <strong>of</strong><br />
Si-(B-)C-N ceramics
Precursor-derived Si-B-C-N Ceramics<br />
• Produced by thermolysis (1323 K, Ar) <strong>of</strong><br />
polymer precursors<br />
• Amorphous, purely homogeneous inorganic materials<br />
• NCP200: 40.1Si 23C 36.9N (at.%)<br />
- Starts to crystallize at 1700 K (N 2 )<br />
- Thermal stability up to 1800 K (N 2 )<br />
• T2-1: 29.1Si 41.7C 19.4N 9.8B (at.%)<br />
- X-ray amorphous, nanocrystalline<br />
- Thermal stability up to 2300 K
Process for Precursor-derived Si-(B-)C-N Ceramics<br />
Monomer<br />
Polymer<br />
Synthesis<br />
Monomer Unit<br />
Precursor Polymer<br />
Preceramic Network<br />
Crosslinking (200-400°C)<br />
Thermolysis (1000-1400°C)<br />
Amorphous Solid<br />
Amorphous Ceramic<br />
Polycrystalline Ceramic<br />
Crystallization ( > 1400°C)<br />
Crystalline Ceramic<br />
Novel ceramics with high<br />
temperature stability and with<br />
good resistance to oxidation<br />
can be obtained from<br />
molecular units without<br />
sintering aid.
J. Gröbner, PhD thesis, 1994<br />
Si-C binary subsystem
Si-N binary subsystem<br />
Gas<br />
Si(l) + Gas<br />
Si 3<br />
N 4<br />
2114 K<br />
Gas + Si 3 N 4<br />
Si 3 N 4 + Si(l)<br />
1687 K<br />
Si 3 N 4 + Si(s)<br />
Si(l)<br />
Si(s)
Isopleth from Carbon to Si 3 N 4 in the Si-C-N System
Isothermal Section <strong>of</strong> the Ternary System Si-C-N<br />
T = 3000 K<br />
(2727 °C)
Isothermal Sections <strong>of</strong> the Ternary System Si-C-N<br />
Si 1 N 1.6 C 1.33 (VT50, Polyvinysilazane, Hoechst AG, Frankfurt, Germany)<br />
Si 1 N 0.6 C 1.02 (NCP200, Polyhydridomethylsilazane, Nichimen Corp., Tokyo, Japan)<br />
N<br />
Si 3 N 4 + 3C = 3SiC +2N 2<br />
(1)<br />
N<br />
Si 3 N 4 = 3Si + 2N 2<br />
(2)<br />
N<br />
Si 3 N 4<br />
Si 3 N 4<br />
C<br />
SiC<br />
Si<br />
C<br />
SiC<br />
Si<br />
C<br />
SiC<br />
Si<br />
T < 1484°C<br />
(1757 K)<br />
1484°C < T < 1841°C T > 1841°C<br />
(2114 K)<br />
P = 1 bar
Calculated Phase Fraction Diagrams <strong>of</strong> Precursor Derived Ceramics<br />
Si 3 N 4 + 3C = 3SiC +2N 2<br />
Si 1 N 1.6 C 1.33<br />
(VT50)<br />
1484°C
Thermogravimetrical (TG) analysis <strong>of</strong> precursor-derived Si-C-N ceramics<br />
Mass Loss (%)<br />
5<br />
0<br />
-5<br />
-10<br />
-15<br />
-20<br />
-25<br />
-30<br />
-35<br />
NCP200<br />
VT50<br />
1000 1200 1400 1600 1800 2000<br />
<strong>Temperature</strong> (°C)
Calculated Phase Fraction Diagram <strong>of</strong> Precursor Derived Ceramics<br />
NCP200, Polyhydridomethylsilazane (Nichimen Corp., Tokyo, Japan)<br />
Ceramics:<br />
Si 1 N 0.6 C 1.02<br />
Phase Fraction Diagram<br />
Reaction Path<br />
N<br />
1484°C<br />
Si 3 N 4<br />
1841°C<br />
C<br />
SiC<br />
Si
Thermogravimetrical (TG) analysis <strong>of</strong> precursor-derived Si-C-N ceramics<br />
Mass Loss (%)<br />
5<br />
0<br />
-5<br />
-10<br />
-15<br />
-20<br />
-25<br />
-30<br />
-35<br />
NCP200<br />
VT50<br />
1000 1200 1400 1600 1800 2000<br />
<strong>Temperature</strong> (°C)
Thermogravimetrical (TG) analysis <strong>of</strong> precursor-derived Si-B-C-N ceramics<br />
Mass Loss (%)<br />
5<br />
0<br />
-5<br />
-10<br />
-15<br />
-20<br />
-25<br />
-30<br />
-35<br />
T2-1<br />
Si 3 N 4 + 3C = 3SiC + 2N 2 MW36 MW33<br />
(Si-B-C-N)<br />
NCP200<br />
VT50<br />
Si 3 N 4 = 3Si + 2N 2<br />
(Si-C-N)<br />
-40<br />
1200 1400 1600 1800 2000 2200<br />
<strong>Temperature</strong> (°C)
Calculated Phase Fraction Diagram <strong>of</strong><br />
T2-1- Derived Ceramic Si 3.0 B 1.0 C 4.3 N 2.0<br />
Si 3.0 B 1.0 C 4.3 N 2.0<br />
1484°C<br />
( T2-1 precursor, PML,<br />
Max-Planck-Institut,<br />
Stuttgart, Germany )
B<br />
SiB n SiB 6<br />
B 4+ δ C<br />
BN<br />
SiB 3<br />
B 2 CN 2<br />
mol-% B<br />
mol-% B<br />
BC 3 N<br />
BC 4 N<br />
BC 2 N<br />
mol-% C<br />
SiC<br />
N<br />
“C 3 N 4 “ SiC 2 N 4 Si 2 CN 4<br />
Si 3 N 4<br />
mol-% B<br />
mol-% N<br />
C<br />
mol-% Si<br />
Si
Isothermal Section at 1500 K in the Ternary System Si-B-C<br />
T = 1500 K<br />
(1227 °C)
B<br />
SiB n<br />
B 4+δ C<br />
SiB 6<br />
SiB 3<br />
BN<br />
N<br />
Si 3 N 4<br />
C<br />
SiC<br />
Si
Calculated Potential Phase Diagram<br />
10 bar<br />
1 bar<br />
Si 3<br />
N 4
Calculated Potential Phase Diagram<br />
1484°C<br />
1700°C<br />
1841°C<br />
2034°C<br />
10 bar<br />
1 bar
Carbon activity - temperature diagram<br />
(2034°C)<br />
I0 bar pressure:<br />
ac. = 1 1973 K (1700°C)<br />
ac. = 0.17 2307 K (2034°)<br />
(1700°C)<br />
Estimating a pressure <strong>of</strong> 10<br />
bar and a carbon activity <strong>of</strong><br />
0.17, it can be concluded<br />
that the thermal stability <strong>of</strong><br />
precursor-derived Si-B-C-N<br />
ceramics remains up to<br />
2000°C.
B<br />
N<br />
C<br />
Si
Isopleth from B to Si 1 C 1.6 N 1.33 (VT50) in the Si-B-C-N System<br />
B<br />
N<br />
C<br />
Si
Isopleth from B 0.1 C 0.65 Si 0.25 to B 0.1 N 0.65 Si 0.25 in the Si-B-C-N System<br />
(at 10 mol-% B and 25 mol-% Si)<br />
X (N)<br />
B 0.1 C 0.65 Si 0.25 B 0.1 N 0.65 Si 0.25<br />
X (Si)
B - C - N B - C - Si B - C - N - Si C - N - Si B - N -Si<br />
2722 u1<br />
G + L = BN + B4C<br />
2657 u2<br />
G + L = C + B4C<br />
2597 u3<br />
G + B4C = C + BN<br />
2372 u5<br />
L + B4C = B + BN<br />
2568 u4<br />
L + C = B4C + SiC<br />
2278 u6<br />
L + B = B4C + SiBn<br />
L + C + BN + B4C<br />
2597 G + B4C = L + C + BN U1<br />
G + L +<br />
C + BN<br />
G, L,<br />
SiC, BN<br />
2586 G + L = BN + SiC + C U2<br />
L, SiC, G, SiC,<br />
C, BN<br />
C, BN<br />
2568 L + C = SiC + B4C, BN U3<br />
SiC, C, BN, B4C<br />
2311 L + B = B4C + SiBn, BN D1<br />
BN, B4C, SiBn, B<br />
L, BN,<br />
B4C, SiBn<br />
2590 M<br />
G = L + SiC + BN<br />
3095 d1<br />
L + C = SiC, G<br />
L, SiC, BN,<br />
B4C<br />
G, L, SiC, BN<br />
2310 d2<br />
L + B = SiBn, BN<br />
2273 K<br />
2123 u7<br />
L + SiBn=B4C + SiB6<br />
2123 L + SiBn=SiB6 + B4C, BN D2<br />
2123 d3<br />
L + SiBn = SiB6, BN<br />
L, BN, B4C, SiB6<br />
BN, B4C, SiB6, SiBn<br />
2114 G + L = Si3N4 + SiC, BN D3<br />
G, Si3N4,<br />
SiC, BN<br />
L, Si3N4,<br />
SiC, BN<br />
2114 u8<br />
G + L = Si3N4 + SiC<br />
2114 d4<br />
G + L = Si3N4, BN<br />
1873 K<br />
1669 u10<br />
L + SiC = B4C + Si<br />
1757 G + SiC = C + Si3N4, BN D4<br />
G, Si3N4, C, BN<br />
Si3N4, SiC, C, BN<br />
1687 L = Si, Si3N4, BN, SiC D5<br />
Si3N4, SiC, BN, Si<br />
L, SiC,<br />
BN, Si<br />
1669 L + SiC = B4C + Si, BN D6<br />
1757 u9<br />
G + SiC = C + Si3N4<br />
1687 d5<br />
L = Si, SiC, Si3N4<br />
1687 d6<br />
L = Si, Si3N4, BN<br />
1673 K<br />
SiC, BN, Si, B4C<br />
L, BN,<br />
Si, B4C<br />
1657 d7<br />
L = Si + SiB6, B4C<br />
1657 L = Si + SiB6,, BN, B4C D7<br />
1657 d8<br />
L = Si + SiB6, BN<br />
BN, Si,<br />
B4C, SiB6<br />
1471 d9<br />
Si + SiB6=SiB3, B4C<br />
1471 Si + SiB6 = SiB3, B4C, BN D8<br />
1471 d10<br />
Si + SiB6 = SiB3, BN<br />
BN, B4C, SiB3, SiB6<br />
BN, Si, B4C, SiB3<br />
298 K
Si-B-C-N phase diagram at 1673 K with 4 <strong>of</strong> 9 4-phase equilibria<br />
B<br />
SiB n<br />
SiB 6<br />
B 4<br />
C<br />
BN<br />
N<br />
Si 3 N 4<br />
L<br />
C<br />
SiC<br />
Si
Si-B-C-N concentration tetrahedron with indicated<br />
plane at a constant B content <strong>of</strong> 25 at.%<br />
T = 1400°C (1673 K)<br />
B 4+δ<br />
C<br />
B<br />
SiB n<br />
SiB 6<br />
SiB 3<br />
BN<br />
N<br />
Si 3<br />
N 4<br />
C<br />
SiC<br />
Si
Si-B-C-N concentration tetrahedron with indicated<br />
plane at a constant B content <strong>of</strong> 10 at.%<br />
Si 3.0 B 1.0 C 4.3 N 2.0<br />
( T2-1 precursor, PML,<br />
Max-Planck-Institut,<br />
Stuttgart, Germany )<br />
B<br />
SiB n<br />
SiB<br />
B 4+δ<br />
C<br />
6 SiB 3<br />
Si<br />
BN<br />
N<br />
T2-1<br />
Si 3 N 4<br />
C<br />
SiC
Isothermal Section at 10 mol-% B in the Si-B-C-N System<br />
B 4+δ C<br />
B<br />
SiB n<br />
SiB 6<br />
N<br />
BN<br />
T2-1<br />
Si 3 N 4<br />
C<br />
SiC<br />
Si<br />
T = 1400°C<br />
(1673 K)
Isothermal Sections at 10 mol-% B in the Si-B-C-N System<br />
T = 1673 K<br />
(1400°C)<br />
T = 1873 K<br />
(1600 °C)
System Si-B-C-N<br />
- Metastable phase separation -<br />
B<br />
SiB n<br />
a - Si-B-C-N<br />
B 4+δ C<br />
BN<br />
SiB 6<br />
SiB 3<br />
a - BNC y +<br />
a-Si 3+ x C x N 4-x<br />
t - BNC y Si 3 N 4 SiC<br />
1<br />
4<br />
N<br />
a-BNC y Si 3<br />
N 4<br />
a-Si 3+ x C x N 4-x<br />
C<br />
1<br />
4<br />
Si
a - Si-B-C-N<br />
B<br />
SiB n<br />
stable<br />
a - C y (BN) +<br />
a-Si 1 3+ x C x N 4 4-x<br />
B 4+δ<br />
C<br />
SiB 6<br />
SiB 3<br />
not stable<br />
t - BNC y Si 3 N 4 SiC<br />
BN<br />
N<br />
Si 3<br />
N 4<br />
C<br />
a-BNC y<br />
a-Si 3+ x C x N 4-x<br />
T2-1<br />
SiC<br />
1<br />
4<br />
Si