Socio-Economic development in the Danube corridor - ICPDR
Socio-Economic development in the Danube corridor - ICPDR
Socio-Economic development in the Danube corridor - ICPDR

You also want an ePaper? Increase the reach of your titles
YUMPU automatically turns print PDFs into web optimized ePapers that Google loves.
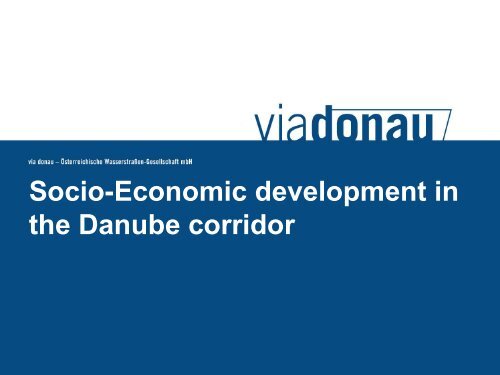
<strong>Socio</strong>-<strong>Economic</strong> <strong>development</strong> <strong>in</strong><br />
<strong>the</strong> <strong>Danube</strong> <strong>corridor</strong>
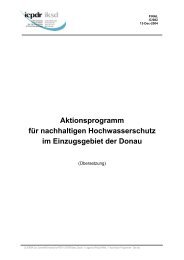
„The <strong>Danube</strong> Belt“ –<br />
An economic <strong>development</strong> axis<br />
Annual growth rates<br />
GDP/capita at PPP 2000-2015<br />
Average growth<br />
rates<br />
2000-2015<br />
% p. a.<br />
Germany 2,0<br />
Poland 3,8<br />
Czech Rep. 3,3<br />
Austria 2,0<br />
Slovenia 2,8<br />
Slovakia 3,9<br />
Hungary 3,3<br />
Croatia 4,2<br />
Bulgaria 2,8<br />
Romania 3,5<br />
Ukra<strong>in</strong>a 3,3<br />
Turkey 2,6<br />
Source: Asumption of OIR<br />
based on forecasts of BMVIT, EC, WIIW<br />
© via donau I 2
Cumulated direct foreign <strong>in</strong>vestment (FDI)<br />
[<strong>in</strong> billion €]<br />
50,0<br />
45,0<br />
40,0<br />
35,0<br />
30,0<br />
Slowakei<br />
Ungarn<br />
Kroatien<br />
Serbien u. M.<br />
Bulgarien<br />
Rumänien<br />
Ukra<strong>in</strong>e<br />
25,0<br />
20,0<br />
15,0<br />
10,0<br />
5,0<br />
0,0<br />
1995 1996 1997 1998 1999 2000 2001 2002 2003 2004<br />
Source: Austrian Institute for Regional Studies and Spatial Plann<strong>in</strong>g<br />
© via donau I 3
Development of transport volume<br />
between Austria and CEECs [<strong>in</strong> 1,000 t]<br />
8.000<br />
7.000<br />
6.000<br />
5.000<br />
4.000<br />
3.000<br />
Slowakei<br />
Ungarn<br />
Kroatien<br />
Serbien und Montenegro<br />
Rumänien<br />
Bulgarien<br />
Ukra<strong>in</strong>e<br />
2.000<br />
1.000<br />
0<br />
1990 1991 1992 1993 1994 1995 1996 1997 1998 1999 2000 2001 2002 2003 2004 2005<br />
Source: Austrian Institute for Regional Studies and Spatial Plann<strong>in</strong>g<br />
© via donau I 4
Development of <strong>the</strong> Conta<strong>in</strong>er transshipment<br />
<strong>in</strong> Constantza<br />
1.200.000<br />
1.000.000<br />
800.000<br />
768.099<br />
1.037.077<br />
TEU<br />
600.000<br />
400.000<br />
200.000<br />
118.645<br />
136.272<br />
206.449<br />
386.282<br />
0<br />
2001 2002 2003 2004 2005 2006<br />
Jahr<br />
Source: Port of Constantza<br />
© via donau I 5
Increas<strong>in</strong>g Conta<strong>in</strong>er transport…<br />
Asien-Europa<br />
+ 10-15 % p.a. !<br />
Source: Hulocon 2005<br />
© via donau I 6
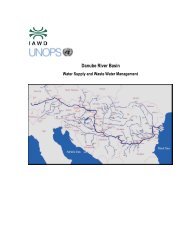
Example: Automotive production sites <strong>in</strong><br />
<strong>the</strong> <strong>Danube</strong> region<br />
Source: via donau<br />
© via donau I 7
Development of transport and<br />
transport forecasts for <strong>the</strong><br />
<strong>Danube</strong> region
Volumes 2004<br />
Source: NEA<br />
© via donau I 9
Forecast: Volumes 2020<br />
Source: NEA<br />
© via donau I 10
Forecast: Relative <strong>development</strong> of<br />
volumes 2004-2020<br />
Source: NEA<br />
© via donau I 11
Forecast: Development of rail and road<br />
transport 2004-2020<br />
Source: NEA<br />
© via donau I 12
Forecast: Development of <strong>in</strong>land waterways<br />
transport on <strong>the</strong> <strong>Danube</strong> 2004-2020<br />
Source: NEA<br />
© via donau I 13
Forecast: Development of <strong>in</strong>land waterways<br />
transport on <strong>the</strong> <strong>Danube</strong> 2004-2020<br />
Source: NEA<br />
© via donau I 14
A national example:<br />
Development of transport and<br />
transport forecasts <strong>in</strong> <strong>the</strong><br />
Austrian <strong>Danube</strong> <strong>corridor</strong>
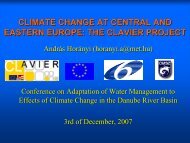
Traffic Increase Austrian <strong>Danube</strong> Corridor<br />
Export, Import and Transit 1994-2005<br />
40<br />
35<br />
+230%<br />
1994<br />
2005<br />
Transport volumes [Mio. Tonnen]<br />
30<br />
25<br />
20<br />
15<br />
10<br />
+57%<br />
+62%<br />
5<br />
0<br />
Road Rail <strong>Danube</strong><br />
Source: Austrian Institute for Regional Studies and Spatial Plann<strong>in</strong>g<br />
© via donau I 16
Traffic Increase Austrian <strong>Danube</strong> Corridor<br />
Transit relation 1994-2005<br />
9<br />
8<br />
+500%<br />
1994<br />
2005<br />
Transport Volumes [Mio. Tonnen]<br />
7<br />
6<br />
5<br />
4<br />
3<br />
2<br />
1<br />
+98%<br />
+86%<br />
0<br />
Road Rail <strong>Danube</strong><br />
Source: Austrian Institute for Regional Studies and Spatial Plann<strong>in</strong>g<br />
© via donau I 17
Transport forecast for <strong>the</strong><br />
Austrian <strong>Danube</strong> 2015 (<strong>in</strong> million tons)<br />
Source: Austrian Institute for Regional Studies and Spatial Plann<strong>in</strong>g<br />
© via donau I 18
Conclusions for <strong>the</strong><br />
<strong>development</strong> of <strong>in</strong>land waterway<br />
transport on <strong>the</strong> <strong>Danube</strong>
Current Transport volumes and transport<br />
forecasts for <strong>the</strong> <strong>Danube</strong> navigation<br />
• The current annual transport volume on <strong>the</strong> <strong>Danube</strong><br />
amounts about 30 mln. tons<br />
• A doubl<strong>in</strong>g of <strong>the</strong> transport volume on <strong>the</strong> <strong>Danube</strong> until<br />
2015-2020 up to 60 mln. tons seems to be a realistic<br />
scenario and would correspond with <strong>the</strong> overall<br />
economic <strong>development</strong> of <strong>the</strong> <strong>Danube</strong> area<br />
• Reality check: In <strong>the</strong> year 1980 already 60 mln. tons<br />
have been transported on <strong>the</strong> <strong>Danube</strong> – under o<strong>the</strong>r<br />
political and socio-economic framework conditions<br />
© via donau I 20
Development of transport volume and<br />
performance on <strong>the</strong> Rh<strong>in</strong>e and on <strong>the</strong> <strong>Danube</strong><br />
Transport volume<br />
[mln tons]<br />
Transport performance<br />
[bn tkm]<br />
<strong>Danube</strong> Rh<strong>in</strong>e <strong>Danube</strong> Rh<strong>in</strong>e<br />
2005 30 300 17 90<br />
2015-2020 60 350 34 105<br />
© via donau I 21
Need for active IWT policy of<br />
<strong>Danube</strong> countries<br />
To cope with <strong>the</strong> grow<strong>in</strong>g traffic volume <strong>in</strong> <strong>the</strong> <strong>Danube</strong><br />
<strong>corridor</strong> <strong>in</strong> a social and environmental sound way:<br />
• Free capacities of <strong>the</strong> <strong>Danube</strong> river should be better<br />
employed<br />
• Waterway transport should be <strong>in</strong>tegrated <strong>in</strong>to high-quality<br />
logistics cha<strong>in</strong>s<br />
• Waterway transport should be modernised and made more<br />
attractive, follow<strong>in</strong>g <strong>the</strong> objectives of <strong>the</strong> European action<br />
programme for <strong>in</strong>land waterway transport NAIADES<br />
© via donau I 22