DANUBE WATER QUALITY MODEL SIMULATIONS ... - ICPDR
DANUBE WATER QUALITY MODEL SIMULATIONS ... - ICPDR
DANUBE WATER QUALITY MODEL SIMULATIONS ... - ICPDR

Create successful ePaper yourself
Turn your PDF publications into a flip-book with our unique Google optimized e-Paper software.
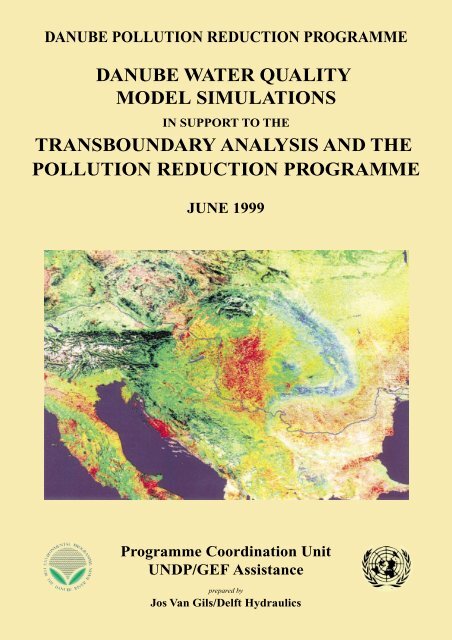
<strong>DANUBE</strong> POLLUTION REDUCTION PROGRAMME<br />
<strong>DANUBE</strong> <strong>WATER</strong> <strong>QUALITY</strong><br />
<strong>MODEL</strong> <strong>SIMULATIONS</strong><br />
IN SUPPORT TO THE<br />
TRANSBOUNDARY ANALYSIS AND THE<br />
POLLUTION REDUCTION PROGRAMME<br />
JUNE 1999<br />
Programme Coordination Unit<br />
UNDP/GEF Assistance<br />
prepared by<br />
Jos Van Gils/Delft Hydraulics
Preface<br />
The Danube Water Quality Model (DWQM) Report was prepared in the frame of the Danube<br />
Pollution Reduction Programme (PRP). The simulations have been conducted to support the<br />
Transboundary Analysis as well as to support the definition of priority measures (investment<br />
portfolio) of the Pollution Reduction Programme.<br />
The present report addresses firstly transbundary issues related to the transport of nutrients<br />
(phosphorus and nitrogen) from the Danube River Basin to the Black Sea. The analysis presented<br />
herein has originally been p0roduced in January 1999, in support to the Transboundary Analysis.<br />
At that point, it was concluded that the input data taken from the Mass Balance Model (MBM)<br />
from the Technical University of Vienna, were based on data from the National Reviews. These<br />
updated input data have been used to support the definition of priority measures (investment<br />
portfolio) to the Pollution Reduction Programme, The simulations with the DWQM to this end are<br />
presented in the second part of the present report.<br />
It should be noticed that water quality data input from the various Danubian countries (National<br />
Review reports) and from reports of the <strong>ICPDR</strong> working groups need further verification. Certain<br />
parameters of the EWQM should only be considered as ont of the possible indicators to determine<br />
transport of nutrients from the different Danubian countries to the Black Sea.<br />
The actual report was prepared by Jos van Gils, Delft Hydraulics, Delft, The Netherlands, under the<br />
guidance of the UNDP/GEF team of experts and consultants of the Danube Programme<br />
Coordination Unit (DPCU) in Vienna, Austria. Conceptual preparation and organisation of<br />
activities were carried out by Joachim Bendow, UNDP/GEF Project Manager and Andy Garner,<br />
Environmental Specialist, who participated also in the Technical Working Group. The report was<br />
edited by Michael Sokolnikov.<br />
To assure scientific support and guidance for the operation of the Model, a Technical Working<br />
Group was created with members from participating countries, defining the appropriate<br />
methodological approach, the choice of relevant data and developing pertinent simulations. The<br />
members of the Technical Working Group were invited from the following Institutions:<br />
UNDP/GEF Don Graybill, Water Quality Expert, Chairman of the Group<br />
TU Vienna Helmut Kroiss, Matthias Zessner (MBM project)<br />
<strong>ICPDR</strong> Hellmut Fleckseder, Technical and Scientific Issues (<strong>ICPDR</strong>)<br />
EMIS Group Bernd Mehlhorn (Umweltbundesamt Berlin)<br />
MLIM Group Liviu Popescu (Research and Engineering Institute, Romania)<br />
VITUKI Geza Jolankai (Water Research Center, Hungary)<br />
Delft Hydraulics Jos van Gils, Modelling Expert<br />
Landesamt f. Wasser Steffen Mueller, Modelling Expert (Munich, Germany)<br />
PCU/Phare/Tacis Ilya Natchkov, Deputy team Leader Phare/Tacis<br />
The Technical Working Group shall continue to assist in the further development of the DWQM<br />
and will assure integration of results with the MBM. The DWQM shall become in the future a<br />
management tool for the <strong>ICPDR</strong> for monitoring , planning and decision making.<br />
The findings, interpretation and conclusions expressed in this publication are entirely those of the<br />
authors and should not be attributed to any manner to the UNDP/GEF and its affiliated<br />
organizations.
5.3. Distributed Emissions ..............................................................................30<br />
5.3.1. Diffuse Sources from Countries Analysed in the<br />
Nutrient Balances Project.............................................................30<br />
5.3.2. Diffuse Sources from the Remaining Countries ..........................32<br />
5.3.3. Introduction in the Model.............................................................32<br />
5.4. In-Stream Loads.......................................................................................33<br />
6. Model Results ...............................................................................................37<br />
6.1. River Discharges.......................................................................................37<br />
6.2. Nutrient Concentrations ..........................................................................37<br />
6.3. Nutrient Loads..........................................................................................43<br />
7. Simulations in Support to the Transboundary Diagnostic<br />
Analysis .........................................................................................................47<br />
7.1. General ......................................................................................................47<br />
7.1.1. Computational Procedure.............................................................47<br />
7.1.2. Emissions .....................................................................................47<br />
7.1.3. In-stream Denitrification..............................................................47<br />
7.2. The Water Volume along the Danube ....................................................48<br />
7.3. The Nutrient Loads along the Danube ...................................................48<br />
8. Simulations in Support to the Pollution Reduction<br />
Programme ...................................................................................................53<br />
8.1. General ......................................................................................................53<br />
8.1.1. Definition of the Projects in the PRP ...........................................53<br />
8.1.2. Consequences of the Projects in the PRP for the<br />
Pollution Sources in the DWQM .................................................53<br />
8.1.3. Consequences of Wetlands Restoration Projects<br />
in the PRP for the DWQM...........................................................53<br />
8.1.4. Emissions Data.............................................................................54<br />
8.1.5. Computational Procedure.............................................................54<br />
8.2. Overview of Total Emissions in the Baseline Simulation .....................55<br />
8.3. Computed Longitudinal In-Stream Load Profiles,<br />
Subdivided per Country ..........................................................................57<br />
8.4. Comparative Effect of Emissions Reductions and Wetlands<br />
Restoration................................................................................................65<br />
8.5. Computed Longitudinal In-Stream Load Profiles, Subdivided<br />
per Sector ..................................................................................................69<br />
vi
Annexes<br />
1. River Network Schematization<br />
2. Schematization Data Germany<br />
3. Basic Catchment Data<br />
4. Correlation between Nitrates and Temperature for Selected Stations in<br />
1994-1997<br />
5. Correlation between Total Phosphorus and Discharge for Selected<br />
Stations in 1994-1997<br />
6. Overview of Important Point Sources<br />
7. Overview of Data Derived from Nutrient Balances Project<br />
8. Overview of Data Supporting Diffuse Pollution Loads Estimates,<br />
Derived from National Reviews<br />
9. Computed River Flows<br />
10. Data about Floodplains, Wetlands and Reservoirs<br />
11. First Working Paper on the Development of the DWQM<br />
12. Summary of Additional Pollution Sources Data, Developed for 1996-<br />
1997 during the Current Project by the University of Vienna.<br />
13. List of Emissions Directly to the River, Developed for the PRP Simulations<br />
vii
List of Tables<br />
Table 4.1.<br />
Table 4.2.<br />
Table 4.3.<br />
Table 4.4.<br />
Table 4.5.<br />
Table 5.1.<br />
Table 5.2.<br />
Table 5.3.<br />
Table 5.4.<br />
Table 5.5.<br />
Table 5.6.<br />
Table 8.1.<br />
Mathematical description of the methodology to introduce distributed sources into<br />
the model.<br />
Classification in modelling terms of the pollution sources described in the Nutrient<br />
Balances project.<br />
Overview of updating of pollution source data.<br />
Overview of methods for estimating pollution source data for Yugoslavia, Bosnia<br />
and Croatia.<br />
Immission/emission ratios for phosphorus and nitrogen in the Danube countries,<br />
based on research presented in (Behrendt, in press).<br />
Overview of monthly averaged flow data<br />
Estimates of emissions from point sources.<br />
Diffuse emissions from countries analysed in the Nutrient Balances project.<br />
Estimated emissions from Croatia, Yugoslavia and Bosnia-Herzegovina.<br />
Overview of processed concentration and flow data<br />
Overview of in-stream loads for selected stations.<br />
Distribution of the "base flow" emissions over the sectors.<br />
ix
List of Figures<br />
Figure 2.1.<br />
Figure 2.2.<br />
Figure 3.1.<br />
Figure 4.1.<br />
Figure 5.1a.<br />
Figure 5.1b.<br />
Figure 5.2a.<br />
Figure 5.2b.<br />
Figure 5.3a.<br />
Figure 5.3b.<br />
Figure 5.4a.<br />
Figure 5.4b.<br />
Figure 5.5a.<br />
Figure 5.5b.<br />
Figure 5.6a.<br />
Figure 5.6b.<br />
Figure 6.1.<br />
Figure 6.2.<br />
Figure 6.3a.<br />
Figure 6.3b.<br />
Figure 6.4.<br />
Figure 7.1.<br />
Figure 7.2.<br />
Map of the Danube area with the river network schematization.<br />
Model segments and main water quality stations in the Upper (a), Middle (b)<br />
and Lower (c) Danube basin.<br />
Longitudinal profile of the catchment area along the Danube, subdivided<br />
over the Danube countries.<br />
Overview of the overall methodology.<br />
Some time series for the flows used in the water balance model: Jochenstein<br />
(border Germany and Austria), Bezdan (border Hungary and Yugoslavia)<br />
and the delta.<br />
Some time series for the flows used in the water balance model: the Drava,<br />
Tisa and Sava tributaries.<br />
Overview of information about nitrogen loads from municipal point sources.<br />
Overview of information about phosphorus loads from municipal point<br />
sources.<br />
Overview of information about nitrogen loads from industrial point sources.<br />
Overview of information about phosphorus loads from industrial point<br />
sources.<br />
Overview of information about nitrogen loads from agricultural point<br />
sources.<br />
Overview of information about phosphorus loads from agricultural point<br />
sources.<br />
Historic overview of Danube nutrient loads: Nitrogen.<br />
Historic overview of Danube nutrient loads: Phosphorus.<br />
Historic overview of yearly average Danube river discharges.<br />
Historic overview of yearly averaged total inorganic nitrogen concentrations<br />
near the Danube mouth.<br />
Computed and observed concentrations of total nitrogen.<br />
Computed and observed concentrations of total phosphorus.<br />
Observed and computed nutrient loads (nitrogen).<br />
Observed and computed nutrient loads (phosphorus).<br />
Observed and computed in-stream loads of nitrogen (left) and phosphorus<br />
(right) in the main tributaries Drava (top), Tisa (middle) and Sava (bottom).<br />
Longitudinal profile of the annual water volume in the Danube (in km 3 /a),<br />
subdivided over the countries of origin.<br />
Longitudinal profile of the annual phosphorus load in the Danube (in kt/a),<br />
subdivided over the countries of origin.<br />
xi
Figure 7.3a.<br />
Figure 7.3b.<br />
Figure 8.1a.<br />
Figure 8.1b.<br />
Figure 8.2a.<br />
Figure 8.2b.<br />
Figure 8.3.<br />
Figure 8.4.<br />
Figure 8.5.<br />
Figure 8.6.<br />
Figure 8.7.<br />
Figure 8.8.<br />
Figure 8.9.<br />
Figure 8.10.<br />
Figure 8.11.<br />
Figure 8.12.<br />
Figure 8.13.<br />
Figure 8.14.<br />
Figure 8.15.<br />
Longitudinal profile of the annual nitrogen load in the Danube (in kt/a),<br />
subdivided over the countries of origin, with a low estimate for the in-stream<br />
denitrification (= removal) rate.<br />
Longitudinal profile of the annual nitrogen load in the Danube (in kt/a),<br />
subdivided over the countries of origin, with a high estimate for the instream<br />
denitrification (= removal) rate.<br />
Total nitrogen emissions, subdivided over the sectors.<br />
Total phosphorus emissions, subdivided over the sectors.<br />
Total nitrogen emissions, subdivided over point sources and diffuse sources.<br />
Total phosphorus emissions, subdivided over point sources and diffuse<br />
sources.<br />
In-stream nitrogen load profiles per country for the Danube River, before<br />
(left side) and after (right side) implementation of the PRP.<br />
In-stream phosphorus load profiles per country for the Danube River, before<br />
(left side) and after (right side) implementation of the PRP.<br />
In-stream nitrogen load profiles per country for the Drava River, before (left<br />
side) and after (right side) implementation of the PRP.<br />
In-stream phosphorus load profiles per country for the Drava River, before<br />
(left side) and after (right side) implementation of the PRP.<br />
In-stream nitrogen load profiles per country for the Tisa River, before (left<br />
side) and after (right side) implementation of the PRP.<br />
In-stream phosphorus load profiles per country for the Tisa River, before<br />
(left side) and after (right side) implementation of the PRP.<br />
In-stream nitrogen load profiles per country for the Sava River, before (left<br />
side) and after (right side) implementation of the PRP.<br />
In-stream phosphorus load profiles per country for the Sava River, before<br />
(left side) and after (right side) implementation of the PRP.<br />
In-stream nitrogen load profile for the Danube River, before and after<br />
implementation of the PRP, with the additional effect of the restoration of<br />
wetlands.<br />
In-stream phosphorus load profile for the Danube River, before and after<br />
implementation of the PRP, with the additional effect of the restoration of<br />
wetlands.<br />
In-stream nitrogen load profile for the Drava River, before and after<br />
implementation of the PRP, with the additional effect of the restoration of<br />
wetlands.<br />
In-stream phosphorus load profile for the Drava River, before and after<br />
implementation of the PRP, with the additional effect of the restoration of<br />
wetlands.<br />
In-stream nitrogen load profile for the Tisa River, before and after<br />
implementation of the PRP, with the additional effect of the restoration of<br />
wetlands.<br />
xii
Figure 8.16.<br />
Figure 8.17.<br />
Figure 8.18.<br />
Figure 8.19.<br />
Figure 8.20.<br />
Figure 8.21.<br />
Figure 8.22.<br />
Figure A6.1.<br />
In-stream phosphorus load profile for the Tisa River, before and after<br />
implementation of the PRP, with the additional effect of the restoration of<br />
wetlands.<br />
In-stream nitrogen load profile for the Sava River, before and after<br />
implementation of the PRP, with the additional effect of the restoration of<br />
wetlands.<br />
In-stream phosphorus load profile for the Sava River, before and after<br />
implementation of the PRP, with the additional effect of the restoration of<br />
wetlands.<br />
In-stream nitrogen load profile for the Danube River, before (left side) and<br />
after (right side) implementation of the PRP, subdivided over the sectors<br />
population, industry, agriculture and others.<br />
In-stream phosphorus load profile for the Danube River, before (left side)<br />
and after (right side) implementation of the PRP, subdivided over the sectors<br />
population, industry, agriculture and others.<br />
In-stream nitrogen load profiles for the Danube River, before and after<br />
implementation of the PRP, for the sectors population, industry and<br />
agriculture.<br />
In-stream phosphorus load profiles for the Danube River, before and after<br />
implementation of the PRP, for the sectors population, industry and<br />
agriculture.<br />
River network and major point sources<br />
xiii
1. Introduction<br />
The present working paper discusses the following aspects related to the Danube Water Quality<br />
Model (DWQM) and its application:<br />
1. A further elaboration of the methodology, as a continuation of the first Working Paper<br />
(Annex 11) in chapters 2, 3 and 4.<br />
2. A discussion of the available data and their use in and around the DWQM in chapter 5.<br />
3. The results of the DWQM validation in chapter 6.<br />
4. The application of the DWQM in support to the Transboundary Diagnostic Analysis in<br />
chapter 7.<br />
5. The application of the DWQM in support to the Pollution Reduction Programme in<br />
chapter 8.
2. Schematization of the Danube Basin<br />
The schematization of the Danube basin has two aspects: the schematization of the river network,<br />
and the schematization of the catchment.<br />
The river network is divided into segments. The subdivision should not be too coarse to avoid an<br />
insufficient accuracy. On the other hand, it should not be too fine to avoid long computation times.<br />
As a starting point, the network schematization of the Danube Basin Alarm Model (DBAM) was<br />
used (Vituki, 1996). The following modifications have been made:<br />
<br />
<br />
segments smaller than 10 km were joined into larger units (especially the Slovak rivers);<br />
parallel stretches were joined to singular stretches with a comparable cross section and<br />
length (Gabcikovó Channel, two Drava stretches, Borcea and Macin).<br />
The DBAM does not contain the German part of the Danube. Therefore, the schematization of DBAM<br />
was extended based on data supplied related to the National Review of Germany. The result was a<br />
schematization of 189 segments (see Figure 2.1 and Figure 2.2). Annex 1 provides an overview of<br />
all segments. Annex 2 summarises the data used for the German part of the Danube. Note that the<br />
Austrian part of the Mura and Drava rivers is not included in the schematization.<br />
The schematization of the catchment is very simple: the catchment is divided over the Danube<br />
countries. This is done since the assessment of the diffuse sources is done at the country level.
Figure 2.1. Map of the Danube area with the river network schematization.
Figure 2.2a: Model segments and main water quality stations in the Upper Danube basin.
Figure 2.2b: Model segments and main water quality stations in the Middle Danube basin.
Figure 2.2c: Model segments and main water quality stations in the Lower Danube basin.
3. Set-up of the Water Balance Model<br />
3.1. Introduction<br />
The water balance model forms the necessary basis for the water quality model. Its purpose is to<br />
compute the water balances for all computational segments. In particular, the following quantities<br />
should be computed for the segments, as a function of time:<br />
<br />
the inflows and outflows (m 3 /s);<br />
the water volume (m 3 );<br />
the streamflow velocity (m/s);<br />
the water depth (m).<br />
<br />
The set up of the water balance model is done in three steps:<br />
1. the mapping of the catchment of the Danube;<br />
2. the computation of the flows;<br />
3. the computation of the remaining segment characteristics.<br />
The composition of the water balances is based on measured flow data for a number of specific<br />
stations. In between those stations, the diffuse inflows are back-computed. In this procedure, the<br />
unknown diffuse inflows are assumed proportional to the increase of the catchment area along the<br />
river. For this purpose, a mapping of the catchment to the river network is made.<br />
3.2. Mapping of the Catchment<br />
The mapping of the catchment is based on information about the total catchment area along the<br />
river and the division of the total catchment over the Danube countries, from different information<br />
sources:<br />
<br />
the National Reviews;<br />
the Danube Hydrology review by Stancik ea. (1988).<br />
The data used for the model are listed in Annex 3.<br />
Based on this information an interpolation was made to find the total catchment and the division<br />
over the Danube countries for all river network segments. The interpolation was made proportional<br />
to the length of the river segments. The result is shown in Figure 3.1 for the segments along the<br />
Danube. From this information also the increase of the catchment per river segment could be<br />
computed, divided over the Danube countries.
900<br />
800<br />
700<br />
600<br />
500<br />
400<br />
300<br />
200<br />
100<br />
0<br />
source<br />
Inn<br />
D-A border<br />
Morava/A-SK-H border<br />
H to CR/YU<br />
Drava<br />
Tisa<br />
Sava<br />
YU-RO border<br />
Iron Gates<br />
YU-BG border<br />
BG-RO border<br />
outflow<br />
Germany Austria Czech_Repu<br />
Slovakia Hungary Slovenia<br />
Croatia Yugoslavia Bosnia_Her<br />
Bulgaria Romania Moldova<br />
Ukraine<br />
Figure 3.1: Longitudinal profile of the catchment area (in 1000 km 2 ) along the Danube, subdivided over the Danube countries.
Danube Water Quality Model Simulations 11<br />
3.3. Methodology for the Computation of the River Flows<br />
For a number of locations the river flows are measured. For the segments between two measured<br />
locations, the flows are interpolated. The interpolation is made proportional to the catchment area,<br />
which was computed earlier. Meanwhile, the diffuse inflows per river segment are computed from<br />
the steady state water balance equation per segment:<br />
∂Q<br />
= q (0.1)<br />
∂x<br />
or, for one discrete segment:<br />
Qout<br />
− Qin<br />
= q (0.2)<br />
L<br />
with Q discharge (m 3 /s)<br />
q lateral inflow (m 3 /s/m)<br />
x longitudinal co-ordinate (m)<br />
L segment length (m)<br />
The lateral inflow for every segment is divided over the Danube countries, proportional to the<br />
division over the countries of the catchment increase of the segment in question. This division is<br />
relevant for the computation of the diffuse pollution loads later on. The procedure described above<br />
is done for subsequent hydrological periods. So far, we work with monthly averaged hydrological<br />
conditions: so we work with periods of one month.<br />
The methodology described above has some advantages. The method works even with only one<br />
measured time series for the river flow: if the flow at the delta is given, all other flows can be<br />
computed. A simple longitudinal interpolation is made, proportional to the longitudinal distribution<br />
of the catchment area. Of course, this approach would not be accurate. The accuracy can be<br />
increased freely by adding more time series for the flow at other locations in the Danube basin. In<br />
other words: the method offers an optimal flexibility. As a result of this flexibility, the method<br />
allows for local refinements whenever that is necessary to analyse specific projects or clusters of<br />
projects.<br />
The method also has a disadvantage. The method can not deal with bifurcations. For this reason,<br />
some parallel stretches were artificially joined in the schematization (see paragraph 2).<br />
3.4. Methodology for the Computation of the Remaining Segment<br />
Characteristics<br />
The computation of the remaining segment characteristics is based on:<br />
<br />
<br />
<br />
the steady-state river flow patterns which are computed for every hydrological period (see<br />
paragraph 3.3);<br />
river cross section data;<br />
river slope data.<br />
Again, the data within the Danube Basin Alarm Model are used as a starting point. The DBAM<br />
contains tabulated cross section data, which can be one of the following types:<br />
a. table of water level, wet cross section and river width;<br />
b. table of river flow, wet cross section and river width;<br />
c. table of river flow, streamflow velocity and river width.
12 Danube Pollution Reduction Programme<br />
For the tables of type c), the wet cross section A is computed by dividing the flow Q by the<br />
velocity V. Also, the water depth H is computed for all tables by dividing the wet cross section A<br />
by the width W. For the tables of type a) the river flow is computed by means of the Manning<br />
formula. This is a simplified momentum equation, valid for free flowing river stretches:<br />
Q = 1 23 /<br />
AR S n<br />
(0.3)<br />
with<br />
Q discharge (m 3 /s)<br />
n Manning coefficient (s/m 1/3 ), value used: 0.03<br />
A wet cross section (m 2 )<br />
R hydraulic radius (m), approximated by the water depth<br />
S slope (m/m)<br />
Data for the river slope were again initially used from the DBAM. For quite a number of segments<br />
the DBAM does not provide river slope data. Missing information was completed from the<br />
National Reviews and Stancik ea. (1988). From the resulting tables, the following analytical<br />
functions are derived:<br />
with<br />
b<br />
d<br />
V = aQ H = cQ<br />
(0.4)<br />
V streamflow velocity (m/s)<br />
H water depth (m)<br />
Annex 1 shows the result of this analysis.<br />
For every hydrological period and for every computational segment, the following procedure is<br />
followed:<br />
the steady state flow Q is used to compute the velocity V and depth H by formula (0.4);<br />
the wet cross section A is computed as Q/V;<br />
the segment volume is computed by multiplying the cross section A and the segment<br />
length L.<br />
The final step is a correction of the river flows Q, to account for the variation of the wet crosssections<br />
A. This is done to satisfy the water balance equation for all segments:<br />
∂Q<br />
∂A<br />
+ = q (0.5)<br />
∂x<br />
∂t<br />
or, for one discrete segment:<br />
t+∆t t<br />
Qout<br />
−Qin<br />
A − A<br />
+ = q (0.6)<br />
L ∆t<br />
with Q discharge (m3/s)<br />
A wet cross section (m2)<br />
q lateral inflow (m3/s/m)<br />
x longitudinal co-ordinate (m)<br />
t time (s)<br />
L segment length (m)
4. Set-up of the Water Quality Model<br />
4.1. Pollution Sources<br />
During the development and the validation of the DWQM a methodology has evolved to look at<br />
pollution sources and their effects, which can be briefly summarised by figure 4.1.<br />
Danube catchment<br />
Human activities<br />
(+natural processes)<br />
Danube River and<br />
main tributaries<br />
emissions directly<br />
to the river<br />
remaining emissions<br />
effective emissions<br />
to the river<br />
Retention in<br />
the catchment<br />
Retention in the river<br />
In-stream (trans-bound.)<br />
transport of pollution<br />
Figure 4.1.<br />
Overview of the overall methodology<br />
Figure 4.1 is split in two parts: on the right side the Danube and its main tributaries ("the river<br />
network", see paragraph 2), on the left side the remaining catchment. The main element of the<br />
methodology is that what we usually call "emissions", does not directly reach the river where it<br />
contributes to the "in-stream (transboundary) transport of pollution". A substantial part of the<br />
emissions is subject to "retention in the catchment", which reduces the resulting "effective<br />
emissions to the river", and therefore the "in-stream (transboundary) transport of pollution". The<br />
remainder of this paragraph will further elaborate the methodology.<br />
The pollution sources can be introduced in the model in four ways:<br />
<br />
<br />
<br />
<br />
as a point emission;<br />
as a distributed emission, causing a constant load in the river;<br />
as a distributed emission, causing a constant concentration in the river;<br />
as a distributed emission, causing a concentration proportional to the river flow.<br />
If point sources are located on or very close to those river stretches which are explicitly included in<br />
the model (see paragraph 2), they are introduced in the model as a point emission at the correct<br />
location in the network. ("emissions directly to the river", figure 4.1). The remaining point sources<br />
("remaining emissions", figure 4.1) are treated as a distributed emission causing a constant load in<br />
the river. The difference between these two options is very significant. The latter are subject to a<br />
substantial "retention in the catchment" (figure 4.1), whereas the former will not be subject to this<br />
retention (see paragraphs 4.3 and 4.4).Diffuse sources are always treated as "remaining emissions"<br />
and introduced in the model as a distributed emission, of one of the three types mentioned above.
14 Danube Pollution Reduction Programme<br />
In order to describe the introduction in the model of the distributed emissions, we start with the<br />
following formula. It describes the concentration in the river as a result of the three types of<br />
distributed sources mentioned above (Jolankai, 1992):<br />
with:<br />
a<br />
Ct () = + b+<br />
cQ()<br />
t<br />
Qt ()<br />
C concentration (g/m 3 )<br />
Q flow (m 3 /s)<br />
a constant (g/s), constant load part of distributed pollution sources<br />
b constant (g/m 3 ), constant concentration part of distributed pollution sources<br />
c constant (gs/m 6 ), increasing concentration part of distributed sources<br />
The introduction in the model is explained in table 4.1 below. We suppose that the average load of<br />
each of the three types is known: W a , W b and W c (g/s). Table 4.2 below describes the division into<br />
the classes described above of the pollution sources which have been distinguished in the ARP<br />
Project EU/AR/102A/91 “Nutrient balances for Danube countries” study.<br />
Table 4.1.<br />
Mathematical description of the methodology to introduce<br />
distributed sources into the model<br />
constant load constant concentration concentration ~ flow<br />
momentaneous load (g/s) a bQ cQ 2<br />
length of hydrological<br />
period (s)<br />
mass per hydrological<br />
period (g)<br />
total simulation period (s)<br />
∆t ∆t ∆t<br />
a ∆t<br />
∑<br />
total mass in simulation (g) a∑∆t<br />
b Q∆t<br />
average load in simulation<br />
(g/s)<br />
value of constant a = W a<br />
momentaneous<br />
concentration (g/m 3 )<br />
bQ∆t<br />
cQ 2 ∆t<br />
∑<br />
∑ ∆t<br />
∑<br />
2 ∆<br />
2 ∆ ∑∑ =<br />
∆t<br />
∆t<br />
∑ c Q t<br />
∑∆t<br />
∑<br />
a a W a<br />
∑ ∆t<br />
= = b Q∆t<br />
W b<br />
∑ ∆t<br />
= c Q t<br />
∆t<br />
Wa<br />
Q<br />
b<br />
W<br />
Q∆t<br />
∆t<br />
=<br />
∑<br />
∑<br />
b<br />
Wb<br />
Q∆t<br />
∆t<br />
∑<br />
∑<br />
c<br />
=<br />
∑<br />
∑<br />
c<br />
WQ<br />
c<br />
Q<br />
2 ∆t<br />
∆t<br />
∑<br />
∑<br />
W<br />
Q<br />
2 ∆t<br />
∆t<br />
W c
Danube Water Quality Model Simulations 15<br />
Table 4.2.<br />
Classification in modelling terms of the pollution sources<br />
described in the Nutrient Balances project<br />
Point Sources Classification Code<br />
discharges from sewer systems (treated and point source, or distributed with constant load<br />
(a)<br />
untreated)<br />
discharges of industry (treated and untreated) point source, or distributed with constant load (a)<br />
effluents from manure treatment plants point source, or distributed with constant load (a)<br />
Diffuse Sources Classification Code<br />
direct discharges of private households distributed with constant load a<br />
storm water overflow distributed with constant load a<br />
direct discharge of manure distributed with constant load a<br />
base flow distributed with constant concentration b<br />
erosion, runoff (from agriculture land) distributed with concentration proportional to flow c<br />
erosion, run-off from forests and others distributed with concentration proportional to flow c<br />
4.2. Updating and Completing the Pollution Sources Estimates<br />
The baseline values for the pollution sources estimates have been derived from the ARP Project<br />
EU/AR/102A/91 “Nutrient balances for Danube countries” for 1992. Table 4.3 below summarises a<br />
methodology which could be used to apply corrections to these numbers to account for the time<br />
difference between 1992 and the target years 1994-1997 for the present analysis. Note that the<br />
uncertainty in the Nutrient Balances emissions estimates is “in the order of magnitude of 50% or<br />
so” (quote from the final report). This uncertainty is not equal for all emissions however: the<br />
discharges from WWTP’s for example are computed with a much smaller uncertainty.<br />
Table 4.3<br />
Overview of Updating of Pollution Source Data<br />
Point Sources Correction Code<br />
discharges from sewer systems updated based on EMIS inventory and Hot Spots list from National (a)<br />
(treated and untreated)<br />
Reviews<br />
discharges of industry (treated and<br />
untreated)<br />
effluents from manure treatment<br />
plants<br />
updated based on EMIS inventory and Hot Spots list from National<br />
Reviews<br />
updated based on Hot Spots list from National Reviews<br />
Diffuse Sources Correction Code<br />
direct discharges of private correction proportional to the change of the population number not a<br />
households<br />
connected to sewers<br />
storm water overflow<br />
correction proportional to the change of the population number<br />
connected to sewers (not applicable to Austria and Germany)<br />
a<br />
direct discharge of manure correction based on change in number of cattle a<br />
base flow<br />
no correction applied for calibration run (time scale for reactions b<br />
is long), for mid-term predictions correction proportional to change<br />
of percolation, percolation of human waste corrected proportional<br />
to change of population, percolation of agriculture areas corrected<br />
proportional to change of area of agricultural land and change in<br />
fertiliser application; percolation of other areas corrected<br />
proportional to change of area.<br />
erosion, runoff (from agriculture correction proportional to change of area of agricultural land and c<br />
land)<br />
change in fertiliser application<br />
erosion, run-off from forests and correction proportional to change in area<br />
c<br />
others<br />
Note: The corrections described in this table will NOT be applied in the remainder of this report, because of a lack of<br />
coherent data.<br />
(a)<br />
(a)
16 Danube Pollution Reduction Programme<br />
In some cases it was necessary to estimate data rather than update them, e.g. for Yugoslavia,<br />
Bosnia and Croatia. These countries were not a part of the Nutrient Balances project. We tried to<br />
derive “average emission factors” from the countries that were included in the Nutrient Balances<br />
project and applied those to the countries for which data were missing. Table 4.4 below provides an<br />
overview. Note that the emission factors are derived after the corrections listed in table 4.3 have<br />
been applied.<br />
Table 4.4.<br />
Overview of methods for estimating pollution source data for<br />
Yugoslavia, Bosnia and Croatia.<br />
Point Sources Method for estimate Code<br />
discharges from sewer systems<br />
(treated and untreated)<br />
data used from EMIS inventory and Hot Spots lists in<br />
National Reviews, if necessary estimated from average<br />
emission per inhabitant connected to sewer systems<br />
(a)<br />
discharges of industry (treated<br />
and untreated)<br />
effluents from manure treatment<br />
plants<br />
data used from EMIS inventory and Hot Spots lists in<br />
National Reviews, if necessary estimated from average<br />
emission per inhabitant<br />
data used from Hot Spots lists in National Reviews<br />
Diffuse Sources Method for estimate Code<br />
direct discharges of private based on average emission per inhabitant not connected to a<br />
households<br />
sewers<br />
storm water overflow<br />
based on average emission per inhabitant connected to a<br />
sewers<br />
direct discharge of manure based on average discharge per unit cattle a<br />
base flow<br />
based on average ratio between percolation and base flow, b<br />
estimate percolation from agriculture areas based on<br />
average percolation per unit area of agricultural surface,<br />
estimate percolation of human waste based on average<br />
percolation per inhabitant, estimate percolation of other<br />
areas based on average percolation per unit surface area<br />
erosion, runoff (from agriculture based on average per unit area of agricultural surface c<br />
land)<br />
erosion, run-off from forests and<br />
others<br />
based on average per unit surface area<br />
c<br />
(a)<br />
(a)<br />
4.3. Modelling the Behavior of Phosphorus<br />
4.3.1. Synthesis of Phosphorus Retention Model<br />
Different authors have demonstrated that the observed in-stream loads of phosphorus are much<br />
smaller than the emissions estimates (Behrendt ea., in press, Behrendt ea., 1997, Behrendt, 1996,<br />
University of Vienna ea., 1997, Zessner ea. 1998). This difference, called "retention in the<br />
catchment", is not yet fully understood. Zessner and other references argue that the retention in the<br />
catchment is a function of the area specific run-off. The natural system is apparently more effective<br />
in "flushing" phosphorus into the river under high area specific run-off conditions. Phosphorus<br />
retention is believed to be related to sedimentation and (temporal) storage in the sediments of the<br />
phosphorus absorbed to suspended solids. Under high flow conditions, this material may be eroded,<br />
carried away by the flood and deposited elsewhere. Since we almost never measure under high<br />
flow conditions, the associated in-stream load is almost never observed. It is possible that a more or<br />
less lasting retention is obtained in the floodplains of the river.
Danube Water Quality Model Simulations 17<br />
The retention of phosphorus can not be explicitly modelled, for different reasons:<br />
1. The associated phenomena are not yet completely understood.<br />
2. The transport of phosphorus is governed by peak flows, which are not modelled<br />
explicitly.<br />
With the modelling objectives in the present project in mind, it is very well possible to parametrize<br />
the retention phenomenon. The phosphorus emissions can be reduced by an empirically derived<br />
"immission/emission-ratio". A range for this factor was derived from Behrendt ea. (in press). The<br />
values reported by Behrendt are intended to be applied to the estimated emission to the surface<br />
water. Therefore, in the present exercise these values can be applied directly to the emission data<br />
from the ARP Project EU/AR/102A/91 “Nutrient balances for Danube countries” (University of<br />
Vienna ea., 1997). Table 4.5a provides an overview of the immission/emission-ratios.<br />
Table 4.5a<br />
Immission/emission ratios for phosphorus, based on research<br />
presented in (Behrendt, in press).<br />
Country<br />
Area specific runoff<br />
(l/km2/s)<br />
high estimate for<br />
immission/emission factor P<br />
low estimate for immission/emission<br />
factor P<br />
D 13.1 90 66<br />
A 19.3 100 72<br />
CZ 5.1 53 30<br />
SK 5.1 53 30<br />
H 2.3 36 5<br />
SL 17.5 100 70<br />
CR 6.4 61 41<br />
YU 7.7 67 50<br />
BiH 17.5 100 70<br />
BG 4.6 50 25<br />
RO 4.6 50 25<br />
MD 6.4 61 41<br />
UA 12.0 86 64<br />
The area specific runoff data are derived from Stancik ea., and afterwards proportionally reduced in order to match the<br />
average Danube flow in 1994-1997 (6491 m3/s).<br />
Paragraph 4.3.2 tries to estimate whether the yearly accumulation of phosphorus in the Danube<br />
catchment floodplains can be responsible or not for a more or less lasting retention of phosphorus.<br />
Paragraph 4.3.3 quantifies another retention process inside the river system, which is believed to be<br />
important for the Danube: the retention in the Iron Gates lakes.<br />
4.3.2. Retention of P in Floodplains<br />
A typical net sedimentation rate in floodplains in the Rhine catchment, measured as a long term<br />
average, is between 0.2 to 10 mm/a (Middelkoop, 1997). Typical total concentrations of<br />
phosphorus in non-flood conditions are around 100-200 µg/l, half of which is adsorbed to around<br />
50-100 mg/l of suspended matter. Thus, the average phosphorus content of suspended matter is<br />
between 500 and 2000 mg/kg. The surface of the floodplains in the Danube basin can be estimated<br />
from National Review data. The total of all floodplains reported per country can be estimated at<br />
around 25,000 km 2 (Appendix 10). The most detailed National Review in this respect is that from<br />
Romania, which reports 7,452 km 2 of floodplains. If we scale that up to the whole basin we get<br />
about 26,000 km 2 of floodplains. So, a number in this order of magnitude can be expected.
18 Danube Pollution Reduction Programme<br />
We estimate the yearly net sedimentation of phosphorus based on a long term average<br />
sedimentation rate of 1 mm/a. To convert this to dry weight we use a density of 2000 kg/m3.<br />
Together with an estimated floodplain area of 26,000 km2 and an estimated phosphorus content of<br />
1000 mg/kg, we compute an indicative number for the corresponding long term averaged<br />
phosphorus storage of 52 kt/a. Although the uncertainty in this number is very high, it indicates that<br />
the floodplains in the Danube catchment are capable of retaining on average an amount of<br />
phosphorus which is of the same order of magnitude as the current yearly emissions.<br />
4.3.3. Retention of P in Large Reservoirs<br />
Iron Gates reservoirs<br />
Perišic ea. investigated the changes of the water quality in the Iron Gates lakes (Perisic ea., 1990).<br />
Between kilometres 1116 (Smederovo) and 943 (Kladovo) the suspended solids concentration was<br />
found to decrease with 100% for low flows to around 40% for high flows. In particular they found<br />
the following correlation between the flow Q and the suspended solids concentration SS in mg/l:<br />
SS =− 12918 . + 0. 0057603 Q SS =− 11044 . + 0.<br />
0043396 Q<br />
smederovo<br />
kladovo<br />
The authors did not report on which flow these correlations are based: the entrance flow or the<br />
local flow.<br />
A flow-duration-curve for the station Orsova (km 958), obtained from the Romanian National<br />
Review, was used to analyse the overall trapping efficiency for suspended sediments. The resulting<br />
number is 53% of the annual suspended sediments load. This number can be converted to a<br />
"removal coefficient" using estimates for the total residence time which have been provided by<br />
Perišic ea. as well. The result is a value of 0.18 per day, which is more or less constant for the<br />
whole range of discharges. The average velocity varies between 0.15 and 0.80 m/s. The effective<br />
sedimentation velocity is computed for a typical water depth of 15 m: the result is 2.7 m/day.<br />
Perisic ea. provide not enough information to estimate the retention of total N and total P. Also, the<br />
National Review of Yugoslavia did not provide enough information to this end.<br />
Gabcikovó/Bös-Nagymaros complex<br />
We have investigated the effect on the water quality of the Gabcikovó/Bös-Nagymaros complex<br />
using data for a station just upstream (e.g. Bratislava, Wolfsthal) from the National Reviews and<br />
data from a station just downstream (e.g. Medve), supplied by Jolankai (pers.comm.). The results<br />
of the investigation do not show any unambiguous proof of retention in the Gabcikovó/Bös-<br />
Nagymaros complex. Therefore, we choose not to include such a phenomenon in the model.<br />
4.4. Modelling the Behavior of Nitrogen<br />
4.4.1. Synthesis of Nitrogen Model<br />
Different authors have demonstrated that the observed in-stream loads of nitrogen are much smaller<br />
than the emissions estimates (Behrendt ea., in press, Behrendt ea., 1997, Behrendt, 1996,<br />
University of Vienna ea., 1997, Zessner ea. 1998). The difference is considered to be primarily<br />
caused by denitrification, and to a much lesser extent by a similar retention as with phosphorus.<br />
This removal process too seems to be a function of the area specific run-off. The denitrification<br />
process is believed to take place in the ground water and in the surface water sediments.<br />
Apparently, it is less effective under high area specific run-off conditions.
Danube Water Quality Model Simulations 19<br />
Most of the denitrification process can not be explicitly modelled, for different reasons:<br />
1. The ground water is not explicitly included in the model.<br />
2. The smaller surface waters are not modelled explicitly (only the Danube itself, some<br />
primary and a few secondary tributaries).<br />
With the modelling objectives in the present project in mind, it is very well possible to parametrize<br />
the denitrification. The nitrogen emissions can be reduced by an empirically derived<br />
"immission/emission-ratio". A range for this factor was derived from Behrendt ea. (in press). The<br />
values reported by Behrendt are intended to be applied to the estimated emission to the surface<br />
water. Therefore, in the present exercise these values can be applied directly to the emission data<br />
from the ARP Project EU/AR/102A/91 “Nutrient balances for Danube countries” (University of<br />
Vienna ea., 1997). Table 4.5b provides an overview of the immission/emission-ratios.<br />
Table 4.5b<br />
Immission/emission ratios for nitrogen, based on research<br />
presented in (Behrendt, in press).<br />
Country<br />
area specific<br />
runoff (l/km 2 /s)<br />
high estimate for<br />
immission/emission factor N<br />
low estimate for immission/emission<br />
factor N<br />
D 13.1 73 54<br />
A 19.3 88 59<br />
CZ 5.1 47 22<br />
SK 5.1 47 22<br />
H 2.3 36 5<br />
SL 17.5 85 58<br />
CR 6.4 52 30<br />
YU 7.7 56 37<br />
BiH 17.5 85 58<br />
BG 4.6 45 19<br />
RO 4.6 45 19<br />
MD 6.4 52 30<br />
UA 12.0 70 52<br />
The area specific runoff data are derived from Stancik ea., and afterwards proportionally reduced in order to match the<br />
average Danube flow in 1994-1997 (6491 m 3 /s).<br />
Paragraph 4.4.2 argues that the denitrification is not constant over the year: it is subject to a distinct<br />
temperature dependency. Therefore, the factors provided in table 4.5 have not been applied<br />
directly, but with a sinusoidal variation over the year. The lowest reduction has been applied in the<br />
winter, the highest in the summer. After some tuning we found that good results were obtained if<br />
the winter load was about three times the summer load. Paragraph 4.4.3 tries to quantify the<br />
denitrification in the Danube River and its modelled tributaries. This is taken into account as an<br />
additional retention process.<br />
4.4.2. Correlation between Nitrates and Temperature<br />
Van Dijk ea. (1997) describe a method to estimate the denitrification from water quality<br />
measurements. The basis for this method is a correlation between the nitrates concentration and the<br />
water temperature. The method assumes that the difference between the nitrates concentration at a<br />
low temperature and at higher temperature is due to denitrification. In order to investigate the<br />
presence of such a correlation, we have processed data for the stations Jochenstein, Wolfsthal and<br />
Hercegszanto. The results are presented in Appendix 4.
20 Danube Pollution Reduction Programme<br />
The correlation is there for all three stations. It is stronger for Jochenstein and Wolfsthal and less<br />
pronounced for Hercegszanto. Van Dijk ea. (1997) argue that a stronger correlation may be<br />
expected if the catchment is more homogeneous. Our observations would be in agreement with<br />
this, since the character of the catchment is homogeneous up to Wolfsthal and changes towards<br />
Hercegszanto.<br />
4.4.3. Nitrates Concentrations along the Hungarian Danube<br />
The Hungarian stretch of the Danube, downstream of Budapest may be a good stretch to study the<br />
nitrogen removal in the stream. On this stretch, the flow does not increase significantly and there<br />
are no significant point sources. We have investigated the concentrations of nitrogen between<br />
Budapest and the Hungarian border in different ways.<br />
The EU/AR/203 project (Vituki, 1997) presents data that allow us to compute the decrease in the<br />
yearly averaged concentration of nitrates. For the years 1989-1994 the result is a decrease of 7%<br />
on average.<br />
Data provided by an Hungarian expert (Jolankai, personal communication) allowed us to analyse<br />
the difference between a station downstream of Budapest (Nagytétény) and the Hungarian border<br />
for 1994-1997 in detail. The result was as follows:<br />
<br />
<br />
there is a systematic decrease in the concentration of N-NO3 of about 10%, which is<br />
about constant over the year!;<br />
there is as systematic decrease in the concentration of total nitrogen of 10% (winter) to<br />
15% (summer).<br />
The length of the analysed river stretch is about 200 km. With a typical streamflow velocity of 0.8<br />
m/s, this accounts for a residence time of 2.9 days. In order to reach a 10% removal on this stretch<br />
(summer conditions), a first order removal rate of 0.036 /day is required. This should be converted<br />
to a value in m/day using a typical depth of the river stretch in question. A value of 4.5 m yields a<br />
denitrification rate of 0.16 m/day.<br />
We believe that this denitrification rate is not representative for the Danube. The domestic<br />
wastewater and WWTP effluents from Budapest cause the conditions to be extremely favourable<br />
for a rapid denitrification, because:<br />
1. there is an abundance of organic carbon to support the denitrification reaction;<br />
2. the oxygen concentration in the water may be reduced;<br />
3. there is a large stock of denitrifying bacteria from the WWTP effluents.<br />
Tonderski found a very strong denitrification in the Vistula river downstream of Warsaw, and<br />
argued that it was caused by the facts mentioned above (Tonderski, 1997).<br />
Consequently, a lower value should be selected. We have used 0.05 m/day.
Danube Water Quality Model Simulations 21<br />
4.5. Computation of In-Stream Nutrient Loads<br />
4.5.1. Methodology<br />
For the computation of the (in-stream) nutrient loads we adopt the methodology proposed by Buijs<br />
ea. (1998).<br />
4.5.2. Total Phosphorus Data<br />
The measurement of total phosphorus and the computation of phosphorus loads from the results,<br />
presents a number of problems.<br />
The first potential problem, the reliability of the sampling and analysis, will not be further analysed<br />
here. There is an ongoing effort in the framework of the MLIM group and the TNMN to improve<br />
the sampling and analysis. We will work with the best available data.<br />
The second problem has to do with the sampling frequency in relation to the occurrence of peak<br />
flows. Recent work by Kroiss and Zessner (Zessner ea., 1998) indicates that there is a correlation<br />
between the river discharge and the total P concentration which shows a more than linear increase<br />
for high discharge values. Consequently, floods may carry a more than proportionally large part of<br />
the yearly load. In Vienna, 35% of an annual phosphorus load passed in 6 days during the 1997<br />
flood. With the common sampling frequency of once per month, the computed yearly load depends<br />
strongly on the flows during the sampling days. With such a low frequency, chances are high that a<br />
flood is missed and consequently, a large part of the load is overlooked.<br />
We have plotted the available measurements of total P against the discharge for 5 stations:<br />
Jochenstein, Wolfsthal, Hercegszanto, Bazias and Reni (see Appendix 5). For the stations<br />
Jochenstein and Wolfsthal the correlation is relatively good, while for the other stations the<br />
correlation is weak. Following the assumption that there is a correlation between the river<br />
discharge and the total phosphorus concentration, it is possible to estimate the phosphorus load<br />
more accurately if daily flow measurements are available. This has been done tentatively for the<br />
station of Wolfsthal, assuming a linear relation between the total P concentration and the river<br />
flow. The in-stream load estimated based on the daily discharge measurements turned out to be 3 to<br />
41% higher than the load computed by the method proposed by Buijs ea. (1998). The difference<br />
was the highest for the year 1996 (41%, with the high summer flood!) and the lowest for the year<br />
1995 (3%). For the years 1994 and 1997 the difference was 10% and 13%. A similar exercise for<br />
other stations was not successful, since no clear relation between the total phosphorus<br />
concentration and the river discharge could be established.<br />
A third problem is related to the fact that samples are usually taken from the surface only. It can be<br />
expected that there exists a vertical gradient in the suspended solids concentration. Consequently,<br />
the suspended solids concentration at the water surface is not representative for the whole water<br />
column. A sample from the surface causes an underestimation of the vertically averaged suspended<br />
solids concentration. Since phosphorus is partly adsorbed to particles, also the total phosphorus<br />
concentration derived from a surface sample will be underestimating the vertically averaged<br />
concentration.<br />
The high flow problem and the stratification problem have not yet been investigated thoroughly on<br />
a basin-wide scale. As a working hypothesis we will assume that both problems can easily cause an<br />
underestimation of about 30% of the river phosphorus load. The combined effect might be an<br />
underestimation of up to 50%. In this case the observed value should be multiplied with a factor of<br />
2! This factor will be used in the remainder of this report.
22 Danube Pollution Reduction Programme<br />
4.5.3. Immission Data: Organic Nitrogen<br />
A common problem in the water quality monitoring is the availability of measurements of organic<br />
nitrogen. In some cases we have completed the missing data by estimating the total organic<br />
nitrogen: the estimated fraction of organic nitrogen is 5% in Germany, 10% in Austria, 15% in<br />
Hungary, 18% (Bazias) to 22% (Reni) in Romania.<br />
The share of organic nitrogen (as a percentage of the total inorganic nitrogen) has been estimated to<br />
the best knowledge of the Technical Working Group. The number of values to substantiate this<br />
knowledge was limited. Should future detailed observations show that these percentages differ<br />
strongly from the chosen percentages, this must have subsequent impacts on the results.
5. Available Data and Their Use in the DWQM<br />
5.1. Hydrology<br />
River flow data have been provided in the National Reviews for many locations in the Danube<br />
basin. To set up the water balance equation, we use the average flows for a certain hydrological<br />
period. In this case the period is one month. The monthly averages should be based on daily<br />
observations, in order to obtain realistic averages. Table 5.1 provides an overview of the<br />
information processed.<br />
Table 5.1.<br />
Overview of monthly averaged flow data<br />
Station River Km<br />
TNMN<br />
code<br />
Years<br />
Daily<br />
data<br />
Source<br />
Jochenstein Danube 2204 L2130 ‘94-‘97 only ‘97 NR Germany<br />
Wolfsthal Danube 1874 L2170 ‘94-‘97 yes NR Austria<br />
Bezdan Danube 1425 - ‘94-‘97 yes NR Yugoslavia<br />
Bogojevo Danube 1367 - ‘94-‘97 yes NR Yugoslavia<br />
Novi Sad Danube 1255 - ‘94-‘97 yes NR Yugoslavia<br />
Smederovo Danube 1116 - ‘94-‘97 yes NR Yugoslavia<br />
Bazias Danube 1073 L0020 ‘95-‘97 no NR Romania<br />
Gruia Danube 857 - ‘95-‘97 no NR Romania<br />
NovoSelo Danube 834 L0730 '94-'96 no NR Bulgaria<br />
Giurgiu Danube 494 - ‘95-‘97 no NR Romania<br />
Isaccea Danube 101 - ‘95-‘97 no NR Romania<br />
S. Mitrovica Sava 136 - ‘94-‘97 yes NR Yugoslavia<br />
Senta Tisa 123 - ‘94-‘97 yes NR Yugoslavia<br />
Dravaszabolcs Drava 68 L1490 ‘94-‘97 no NR Hungary<br />
Oancea Prut ?? - ‘95-‘97 no NR Romania<br />
Lungoci Siret ?? - ‘95-‘97 no NR Romania<br />
Mako Maros 25 - ‘94-‘97 no NR Hungary<br />
Csenger Somes 45 - ‘94-‘97 no NR Hungary<br />
We have set up the water balance equation for the years 1994-1997, based on flow time series for<br />
the following stations:<br />
<br />
<br />
<br />
<br />
<br />
<br />
Jochenstein: at the border between Germany and Austria;<br />
Wolfsthal: at the border between Austria and Slovakia;<br />
Bezdan: just downstream of the border between Hungary and Yugoslavia;<br />
just upstream of the Danube delta;<br />
stations near the mouth of the tributaries Drava, Tisa, Sava, Siret and Prut;<br />
stations near the mouth of the Tisa tributaries Somes and Maros.<br />
The data needed some processing, in order to: (1) assure the monotonous increase of the flow along<br />
the river and its tributaries, and (2) to complete some time series for the period 1994-1997. The<br />
corrections applied were as follows:<br />
<br />
the time series for the Romanian station Gruia was completed from a correlation with the<br />
nearby Bulgarian station Novo Selo (the relation used was: Q Gruia = 0.97 Q NovoSelo );
24 Danube Pollution Reduction Programme<br />
<br />
<br />
<br />
the time series for the Prut and Siret rivers were completed from a correlation with the<br />
station Gruia (Q Prut = 0.019 Q Gruia , Q Siret = 0.039 Q Gruia );<br />
the time series for the station Isaccea near the delta was completed from a correlation<br />
with the station Gruia (Q Isaccea = 1.22 Q Gruia );<br />
the monotonous increase of the flow between Bezdan and the delta was forced by<br />
“constructing” a time series for the flow just upstream of the delta:<br />
Q+ () t = QBezdan() t + QDrava() t + QTisa() t + QSava() t + QSiret () t + QPr<br />
ut<br />
() t<br />
⎛<br />
Q t Average Q ⎞<br />
Isaccea<br />
Delta() = ⎜ ⎟× Q+<br />
() t<br />
⎝ Q ⎠<br />
+<br />
Figure 5.1 shows the time series of the monthly averaged flows for the stations Jochenstein,<br />
Bezdan and “delta” and for the main tributaries.<br />
12000<br />
10000<br />
Jochenst Bezdan Delta<br />
Discharge (m3/s)<br />
8000<br />
6000<br />
4000<br />
2000<br />
0<br />
January-94 January-95 January-96 January-97<br />
3500<br />
3000<br />
Drava Tisa Sava<br />
Discharge (m3/s)<br />
2500<br />
2000<br />
1500<br />
1000<br />
500<br />
0<br />
January-94 January-95 January-96 January-97<br />
Figure 5.1.<br />
Some time series of monthly averaged flows used in the water<br />
balance model: (a) Jochenstein (border Germany and Austria),<br />
Bezdan (border Hungary and Yugoslavia) and the delta; (b) the<br />
Drava, Tisa and Sava tributaries.
Danube Water Quality Model Simulations 25<br />
As it was discussed in paragraph 3, the methodology assumes a constant area specific runoff<br />
between stations where the flow is prescribed. In some areas we found that this condition was not<br />
satisfied. Therefore, we prescribed the river discharge at a number of additional locations. We did<br />
that in a relative way:<br />
<br />
<br />
<br />
<br />
<br />
the flow in the Morava river was specified as 5% of the Danube flow in Wolfsthal (based<br />
on actual flow data for 1994-1997);<br />
the flow in the Tisa river at Tiszabecs, near the Ukrainian border, was specified as 25% of<br />
the total Tisa flow (based on actual flow data for 1994-1997);<br />
the flow in the Inn river was specified as 53% of the Danube flow in Jochenstein (based<br />
on average data from the National Review of Austria);<br />
the flow in the Mura river at the Austrian-Slovenian border was specified as 30% of the<br />
total Drava flow (based on actual flow data for 1994-1997, supported by average data<br />
from the National Review of Austria);<br />
the flow in the Drava river at the Austrian-Slovenian border was specified as 50% of the<br />
total Drava flow (based on actual flow data for 1994-1997, supported by average data<br />
from the National Review of Austria).<br />
5.2. Point Sources<br />
The available data regarding point sources are supposed to answer two questions: (1) how big is the<br />
total emission of nitrogen and phosphorus from point sources?, and (2) which are the most<br />
important individual point sources?<br />
The remainder of paragraph 5.2 and paragraph 5.3 discuss the answers to these questions as they<br />
were given during the set-up and validation of the DWQM. With these data, also the simulations in<br />
support to the Transboundary Analysis were conducted. These data have one important drawback:<br />
the total emissions estimates from the Nutrient Balances project (University of Vienna ea., 1997)<br />
are based on data for 1992. During the course of the current project, new data became available<br />
about the estimated total emissions, this time based on information from 1996-1997, derived from<br />
the National Reviews (University of Vienna, 1999). These new data were used for the simulations<br />
conducted in support to the Pollution Reduction Programme, presented in chapter 8.<br />
The data developed for 1996-1997 do not show a clear trend if they are compared to the data for<br />
1992. Either such a trend is not present, or the basic data do not allow an analysis refined enough to<br />
detect it.<br />
The newly developed data replace those mentioned in table 5.2 (except for Croatia, Yugoslavia,<br />
Bosnia-Herzegovina) and table 5.3. The new data are listed in appendix 12.<br />
5.2.1. Available Information<br />
The following sources of information are available:<br />
<br />
<br />
<br />
overall estimates of point sources for 1988-1989 and 1992 from the Nutrient Balances<br />
project (University of Vienna ea., 1997);<br />
the current results of the EMIS inventory of point sources from domestic and industrial<br />
origin;<br />
the list of hot spots from the National Reviews compiled in the framework of the present<br />
project.
26 Danube Pollution Reduction Programme<br />
Nutrient Balances project<br />
The point sources estimates from the Nutrient Balances project aim at covering all point sources.<br />
They were made for the years 1988/1989 on one hand, and for the year 1992 on the other hand. We<br />
used only the data for 1992. A further refinement of the data has been used (Zessner, pers.comm.),<br />
see Appendix 7.<br />
EMIS Inventory<br />
The EMIS inventory of municipal point sources has the objective to cover 75% of the raw waste<br />
water load discharged into the sewer system. The EMIS chairman estimates that the EMIS<br />
inventory numbers need to be multiplied by 1.33 to 2.0 to obtain estimates of the total emissions<br />
from municipal point sources (Mehlhorn, pers.comm.). The data have been collected for the years<br />
1996-1997 for most countries, except for the Czech Republic (1994-1996), Bosnia-Herzegovina<br />
(1991) and Moldova (1992-1995). The data for Moldova still have the status "draft".<br />
Some modifications were made to the EMIS database for the present exercise: for the untreated<br />
waste water of Budapest, and for most sources from Slovakia the missing phosphorus load was<br />
obtained by dividing the nitrogen load by a value of 5.<br />
The EMIS database of industrial point sources is still not complete. Therefore, it can be expected<br />
that the total emissions from industry are currently underestimated.<br />
Hot spots list from National Reviews<br />
The emissions from the hot spots reported in the National Reviews will be taken into account as<br />
well. For some countries they provide the only available information. Note that the hot spots lists<br />
were compiled without any objective to give a complete inventory of point sources.<br />
Figures 5.2 to 5.4 present a graphical overview of the available data.<br />
60<br />
50<br />
N load (kT/a)<br />
40<br />
30<br />
20<br />
EMIS *1.33<br />
EMIS *2.0<br />
NB (1992) (munic.)<br />
NR Hotspots<br />
10<br />
0<br />
D A CZ SK H SL CR YU BiH BG RO MD UA<br />
Figure 5.2a<br />
Overview of information about nitrogen loads from municipal point<br />
sources.
Danube Water Quality Model Simulations 27<br />
12<br />
10<br />
P load (kT/a)<br />
8<br />
6<br />
4<br />
EMIS *1.33<br />
EMIS *2.0<br />
NB (1992) (munic.)<br />
NR Hotspots<br />
2<br />
0<br />
D A CZ SK H SL CR YU BiH BG RO MD UA<br />
Figure 5.2b<br />
Overview of information about phosphorus loads from municipal<br />
point sources.<br />
60<br />
N load (kT/a)<br />
50<br />
40<br />
30<br />
20<br />
10<br />
EMIS Inventory (industry)<br />
EMIS Inventory (industry)<br />
NB (1992) (industry)<br />
NR Hotspots<br />
0<br />
D A CZ SK H SL CR YU BiH BG RO MD UA<br />
Figure 5.3a<br />
Overview of information about nitrogen loads from industrial point<br />
sources.<br />
12<br />
10<br />
P load (kT/a)<br />
8<br />
6<br />
4<br />
EMIS Inventory (industry)<br />
EMIS Inventory (industry)<br />
NB (industry)<br />
NR Hotspots<br />
2<br />
0<br />
D A CZ SK H SL CR YU BiH BG RO MD UA<br />
Figure 5.3b<br />
Overview of information about phosphorus loads from industrial<br />
point sources.
28 Danube Pollution Reduction Programme<br />
60<br />
50<br />
N load (kT/a)<br />
40<br />
30<br />
20<br />
EMIS<br />
EMIS<br />
NB (1992) (agric.)<br />
NR Hotspots (agric.)<br />
10<br />
0<br />
D A CZ SK H SL CR YU BiH BG RO MD UA<br />
Figure 5.4a<br />
Overview of information about nitrogen loads from agricultural<br />
point sources.<br />
12<br />
10<br />
P load (kT/a)<br />
8<br />
6<br />
4<br />
EMIS<br />
EMIS<br />
NB (1992) (agric.)<br />
NR Hotspots (agric.)<br />
2<br />
0<br />
D A CZ SK H SL CR YU BiH BG RO MD UA<br />
Figure 5.4b:<br />
Overview of information about phosphorus loads from agricultural<br />
point sources.<br />
Only for the municipal point sources it is possible to really compare the data from the Nutrient<br />
Balances project and from the EMIS inventory. For some countries we observe that the emission<br />
numbers from the EMIS inventory, scaled up by a factor of 1.33 to 2.0, are lower than those from<br />
the Nutrient Balances project. This could be due to a smaller coverage of the EMIS inventory than<br />
we have assumed. However, if we compare the total PE’s in both information sources, we find that<br />
EMIS covers 50% to 86% of the PE’s in the Nutrient Balances study. So, the applied multiplication<br />
factor of 1.33 to 2.0 seems adequate. Another possible explanation for the difference is a decrease<br />
of point sources between 1992 (Nutrient Balances) and 1996-1997 (EMIS inventory). This is<br />
indeed the case for some countries e.g. Germany and Austria.
Danube Water Quality Model Simulations 29<br />
5.2.2. Total Emissions from Point Sources<br />
From the information described above, we had to make estimates of the total emission from point<br />
sources. Since the uncertainty in these numbers is considerably high, we work with a high and a<br />
low estimate. Table 5.2 below provides an overview of the selected values, plus the main<br />
considerations.<br />
Table 5.2.<br />
Estimates of emissions from point sources.<br />
Municipal Industrial Agricultural<br />
N (kt/a) P (kt/a) N (kt/a) P (kt/a) N (kt/a) P (kt/a)<br />
low high low high low high low high low high low high<br />
D 17.5 17.5 0.69 0.69 0.8 1.0 0.08 0.10 0.0 0.0 0.0 0.0<br />
A 19.3 19.3 1.62 1.62 0.7 2.0 0.03 0.10 0.0 0.0 0.0 0.0<br />
CZ 3.6 10.0 0.59 2.40 0.2 4.0 0.10 0.40 0.0 0.0 0.0 0.0<br />
SK 7.4 18.0 1.48 3.70 0.4 3.0 0.05 0.10 0.0 0.0 0.0 0.0<br />
H 9.5 22.0 2.15 5.20 2.2 3.0 0.05 1.70 0.0 0.0 0.0 0.0<br />
SL 3.3 8.0 0.70 1.60 3.0 6.0 0.20 0.40 0.0 0.0 0.00 0.00<br />
CR 5.7 8.3 1.00 1.99 0.5 2.0 0.07 0.37 0.0 0.0 0.00 0.00<br />
YU 17.4 19.2 3.04 5.27 2.8 5.5 0.52 1.04 4.0 6.0 0.54 0.81<br />
BiH 3.3 6.6 1.00 1.15 0.9 1.8 0.17 0.34 0.0 0.0 0.00 0.00<br />
BG 14.0 14.1 3.20 3.81 1.6 4.0 0.03 0.10 0.0 0.0 0.0 0.0<br />
RO 33.2 40.0 5.70 6.12 18.0 18.2 0.11 4.30 9.4 15.0 0.72 3.00<br />
MD 0.4 1.0 0.05 0.20 0.0 0.0 0.00 0.00 0.0 0.0 0.0 0.0<br />
UA 1.2 3.0 0.36 1.00 0.0 0.0 0.00 0.00 0.0 0.0 0.0 0.0<br />
Total 135.8 187.0 21.6 34.8 31.2 50.5 1.4 9.0 13.4 21.0 1.3 3.8<br />
Main considerations:<br />
<br />
<br />
<br />
<br />
<br />
<br />
<br />
<br />
the municipal sources from Austria and Germany were estimated as 1.33 times the EMIS<br />
inventory results;<br />
a high and a low estimate of the municipal sources from Yugoslavia were obtained by the<br />
method explained in table 4.4 (see table 5.4) and by taking the sum of the hot spots<br />
identified in the National Review;<br />
a high and a low estimate of the municipal sources from Bosnia-Herzegovina and Croatia<br />
were obtained by the method explained in table 4.4 (see table 5.4) and by taking 1.33<br />
times the EMIS inventory results;<br />
for the municipal sources from the other countries 1.33 times the EMIS inventory results were<br />
chosen as a lower value, and the Nutrient Balance results were chosen as a higher value;<br />
for the industrial point sources we used the data from EMIS and from the Nutrient<br />
Balances study as a high and a low estimate (for Austria, the Nutrient Balances numbers<br />
have been corrected to reflect the closing of a fertiliser plant);<br />
for the industrial point sources from Yugoslavia, Croatia and Bosnia-Herzegovina the<br />
method presented in table 4.4 (see table 5.4) was selected as a higher estimate;<br />
for Slovenia (N and P), Bosnia (N and P), Yugoslavia (N and P) and Slovakia (P) only<br />
one estimate was present, the lower estimate was set to 50% of this value;<br />
a high and a low estimate of the agricultural point sources from Romania were obtained<br />
by taking the values on the hot spots list and by taking the values from the Nutrient<br />
Balances study (the Nutrient Balances numbers have been reduced to 33% of their<br />
original values);
30 Danube Pollution Reduction Programme<br />
<br />
<br />
a high and a low estimate of the agricultural point sources from Yugoslavia were obtained<br />
by taking the values on the hot spots list and by taking 150% of those values;<br />
for the agricultural point sources from the remaining countries there are no agricultural<br />
point sources.<br />
5.2.3. Important Point Sources<br />
Information about individual point sources has been derived from the EMIS inventory and from the<br />
Hot Spots lists in the National Reviews. This information has been processed as follows:<br />
<br />
the lists of point sources from the EMIS inventory and the Hot Spots lists have been<br />
merged;<br />
point sources without (estimates of the) emissions of nitrogen and phosphorus have been<br />
removed;<br />
point sources present in both lists have been identified:<br />
- if the emission estimates were non-contradictory, the most complete description of the<br />
point source has been retained and the other one deleted;<br />
- if the emission estimates were contradictory, one of the two has been selected on the<br />
basis of expert judgement;<br />
for the remaining list of 730 point sources the total emissions of N and P have been<br />
computed: 145.5 kt/a of nitrogen and 21.3 kt/a of phosphorus;<br />
for each individual source its relative contribution to the total emission of N and P was<br />
computed, and the largest number of the two was determined ("maximum relative<br />
contribution");<br />
the point sources sorted according to a descending maximum relative contribution;<br />
a "small list" of 171 point sources was made up, consisting of the largest point sources<br />
which together represent at least 80% of the total emissions of N and P.<br />
Appendix 6 provides the total list of point sources, as well as a number of maps which indicate the<br />
position of the point sources on the "small list" in relation to the river network schematization.<br />
5.3. Distributed Emissions<br />
5.3.1. Diffuse Sources from Countries Analysed in the Nutrient Balances<br />
Project<br />
The diffuse emissions from all Danube countries, except Croatia, Yugoslavia and Bosnia-<br />
Herzegovina have been obtained from the Nutrient Balances project. In appendix 7 we provide an<br />
overview of information taken from this project. Paragraph 4.2 describes a approximate<br />
methodology to adapt the data from the Nutrient Balances project for the time gap between the<br />
target year 1992 in that project and the target period 1994-1997 in the present exercise (table 4.3).<br />
We have compiled the necessary "country parameters" to support this correction from the National<br />
Reviews. Appendix 8 summarises the results. Looking at the country parameters in appendices 7<br />
and 8 we conclude:<br />
<br />
<br />
<br />
neither the Nutrient Balances project nor the present National Reviews provide a<br />
complete picture of homogeneous quality for all Danube countries;<br />
there are apparent inconsistencies between data from the Nutrient Balances project and<br />
from the present National Reviews;<br />
it is therefore dangerous to interpret the difference between the information in the<br />
Nutrient Balances project and the present National Reviews as "the apparent change of<br />
conditions between 1992 and 1994-1997".
Danube Water Quality Model Simulations 31<br />
For this reason the approximate methodology described in paragraph 4.2 has not been followed. In<br />
stead, the data from the Nutrient Balances project have been corrected on the basis of expert<br />
judgement only:<br />
<br />
<br />
the direct discharges of manure from Romania have been reduced by a factor of four;<br />
the erosion and runoff of phosphorus from Hungary has been reduced, since the original<br />
numbers correspond to extremely high unit area emissions.<br />
The resulting diffuse sources data are collected in table 5.3.<br />
Table 5.3.<br />
Diffuse emissions from countries analysed in the Nutrient Balances<br />
project.<br />
Nitrogen (kt/a) D A CZ SK H SL BG RO MD UA<br />
direct discharges private hh's n.a. 1.0 3.0 3.0 5.0 1.0 1.0 n.a. n.a. n.a.<br />
storm water overflow 2.0 2.0 2.0 1.0 n.a. 1.0 3.0 5.0 n.a. n.a.<br />
direct discharges of manure 2.0 2.0 n.a. n.a. 8.0 n.a. 7.0 25.0 n.a. 1.0<br />
base flow 65.0 54.0 13.0 27.0 5.0 4.0 4.0 95.0 3.0 4.0<br />
erosion, runoff (from agriculture land) 11.0 8.0 4.0 10.0 28.0 4.0 6.0 38.0 9.0 17.0<br />
erosion, run-off from forests and others 10.0 9.0 n.a. n.a. n.a. n.a. 2.0 n.a. n.a. 9.0<br />
Total 90 76 22 41 46 10 23 163 12 31<br />
Phosphorus (kt/a) D A CZ SK H SL BG RO MD UA<br />
direct discharges private hh's n.a. 0.20 0.20 0.30 1.50 0.10 0.30 n.a. n.a. n.a.<br />
storm water overflow 0.30 0.40 0.30 0.20 n.a. 0.10 0.40 1.10 n.a. 0.10<br />
direct discharges of manure 0.80 0.40 0.10 n.a. 1.60 n.a. 1.80 4.50 n.a. 0.50<br />
base flow n.a. 0.50 0.10 0.30 n.a. 0.40 0.50 4.30 n.a. 0.40<br />
erosion, runoff (from agriculture land) 5.10 3.10 0.60 1.40 5.00 0.10 0.70 6.80 2.10 2.80<br />
erosion, run-off from forests and others 0.80 0.80 n.a. n.a. 0.60 n.a. 0.30 n.a. n.a. 0.90<br />
Total 7.0 5.4 1.3 2.2 8.7 0.7 4.0 16.7 2.1 4.7<br />
n.a.: Insignificant or not reported.<br />
These emission data are valid for the year 1992 (University of Vienna ea., 1997), with modifications regarding the<br />
discharges of manure from Romania and the erosion from Hungary (see report text).
32 Danube Pollution Reduction Programme<br />
5.3.2. Diffuse Sources from the Remaining Countries<br />
The data for Croatia, Yugoslavia and Bosnia-Herzegovina have been estimated based on specific<br />
emission factors obtained from the Nutrient Balances project. Paragraph 4.2 describes the<br />
methodology which was used (table 4.4). The specific emission factors are presented in appendix 7.<br />
The country parameters are presented in appendix 8. The resulting load estimates are presented in<br />
table 5.3 below.<br />
Table 5.4.<br />
Estimated emissions from Croatia, Yugoslavia and Bosnia-<br />
Herzegovina.<br />
N (kt/a)<br />
P (kt/a)<br />
CR YU BiH CR YU BiH<br />
industries 2.0 5.5 1.8 0.35 0.98 0.32<br />
direct discharges of private households 0.9 2.3 0.7 0.17 0.43 0.12<br />
storm water overflow 0.6 1.8 0.7 0.10 0.32 0.12<br />
effluents from sewer systems 5.7 17.4 6.6 1.00 3.04 1.15<br />
base flow 14.5 39.3 15.6 0.33 1.01 0.32<br />
erosion, runoff (from agriculture land) 7.1 24.8 7.2 1.45 5.08 1.48<br />
discharge of manure 2.4 8.3 2.4 0.51 1.78 0.52<br />
erosion, run-off from forests and others 1.7 2.4 2.1 0.19 0.28 0.24<br />
TOTAL 34.8 101.7 37.0 4.10 12.93 4.27<br />
This table contains estimates only! The method used for the estimation is explained in paragraph 4.2 of the present<br />
report. The basic data used are listed in appendix 8 (country data) and appendix 7 (emission factors, based on the<br />
emission estimates from the other Danube countries for 1992). The estimated diffuse emissions are used directly in the<br />
remainder of this report. The use of the estimates of point sources is explained in table 5.2!<br />
5.3.3. Introduction in the Model<br />
The diffuse sources from the countries analysed by the Nutrient Balances project (paragraph 5.3.1)<br />
and the diffuse sources estimates for Croatia, Yugoslavia and Bosnia-Herzegovina (paragraph<br />
5.3.2) are introduced in the model according to the methodology described in paragraph 4.1.<br />
Following table 4.2 the loads are introduced in a distributed way, in three types, e.g. a part causing<br />
a constant load in the river, a part causing a constant concentration and a part causing a<br />
concentration proportional to the flow.<br />
From the total point sources mentioned in paragraph 5.2.2, a part has been introduced in the model<br />
directly as a point emission (paragraph 5.2.3). The remaining load is added to the distributed<br />
emissions, of the type that causes a constant load in the river.
Danube Water Quality Model Simulations 33<br />
5.4. In-Stream Loads<br />
Simultaneous measurements of river flows and concentrations data have been provided in the<br />
National Reviews for many locations in the Danube basin. Table 5.5 below provides an overview<br />
of the information processed so far.<br />
Table 5.5.<br />
Overview of processed concentration and flow data<br />
Station River Km<br />
TNMN<br />
code<br />
Jochenstein Danube 2204 L2130/-<br />
L2220<br />
frequency of<br />
concentration<br />
measurements<br />
flow data<br />
available?<br />
12 per year monthly<br />
averages<br />
Wolfsthal Danube 1874 L2170 12 per year monthly<br />
averages<br />
Hercegszanto Danube 1435 L1540 about 30 per<br />
year<br />
at<br />
sampling<br />
days only<br />
Bazias Danube 1071 L0020 12 per year monthly<br />
averages<br />
Reni Danube 131 L0430 12 per year monthly<br />
averages<br />
Jesenice Sava 729 L1220/<br />
L1330<br />
6 to 12 per<br />
year<br />
monthly<br />
averages<br />
Zupanja Sava 254 L1060 12 per year monthly<br />
averages<br />
Ormoz Drava 300 L1390 6 to 12 per<br />
year<br />
at<br />
sampling<br />
days only<br />
D. Miholjac Drava 78 L1250 12 per year monthly<br />
averages<br />
Dravaszabolcs Drava 68 L1610 about 25 per<br />
year<br />
Tiszabecs Tisa 757 - about 25 per<br />
year<br />
Tiszasziget Tisa 162 L1700 about 25 per<br />
year<br />
at<br />
sampling<br />
days only<br />
at<br />
sampling<br />
days only<br />
at<br />
sampling<br />
days only<br />
organic<br />
nitrogen<br />
estimated<br />
from<br />
chlorophy<br />
ll data<br />
estimated<br />
from<br />
chlorophy<br />
ll data<br />
measured<br />
(lower<br />
frequency<br />
)<br />
estimated<br />
as 18% of<br />
total N<br />
estimated<br />
as 22% of<br />
total N<br />
measured<br />
measured<br />
estimated<br />
as 10% of<br />
total N<br />
measured<br />
estimated<br />
based on<br />
measurem<br />
ents as<br />
36% of<br />
the total<br />
measured<br />
measured<br />
Data<br />
source<br />
NR<br />
Germany<br />
and<br />
Austria<br />
NR<br />
Austria<br />
NR<br />
Hungary<br />
NR<br />
Romania<br />
NR<br />
Romania<br />
NR's<br />
Croatia<br />
and<br />
Slovenia<br />
NR<br />
Croatia<br />
NR<br />
Slovenia<br />
NR<br />
Croatia<br />
NR<br />
Hungary<br />
NR<br />
Hungary<br />
NR<br />
Hungary
34 Danube Pollution Reduction Programme<br />
Simultaneous measurements of river flows and concentrations data have been used to compute the<br />
yearly loads at selected stations. The loads have been computed using the methodology which was<br />
proposed in a recent project executed under the responsibility of the MLIM sub group (Buijs ea.,<br />
1998). Table 5.6 lists the results.<br />
Table 5.6.<br />
Overview of in-stream loads for selected stations.<br />
<strong>DANUBE</strong><br />
SAVA<br />
Year TN TP Year TN TP<br />
kt/a kt/a kt/a kt/a<br />
Jochenstein 1994 129 3.8 Jesenice 1994 21<br />
1995 139 5.8 1995 29<br />
1996 109 3.1 1996 37<br />
1997 95 5.3 1997 19 0.5<br />
Wolfsthal 1994 169 6.7 Zupanja 1994<br />
1995 202 10.0 1995 124<br />
1996 179 6.0 1996 124<br />
1997 168 7.6 1997 130<br />
Hercegszanto 1994 179 11.1<br />
1995 233 13.2 DRAVA<br />
1996 195 9.9 Year TN TP<br />
1997 166 9.7 kt/a kt/a<br />
Bazias 1994 281 12.9 Ormoz 1994<br />
1995 385 18.9 1995<br />
1996 425 15.1 1996 16 0.2<br />
1997 382 13.2 1997<br />
Reni 1994 366 22.1 D. Miholjac 1994 35 1.6<br />
1995 389 30.5 1995 40 2.9<br />
1996 588 23.0 1996 46 3.2<br />
1997 473 22.2 1997 27 1.8<br />
Dravaszabolcs 1994 36 1.8<br />
1995 47 2.2<br />
1996 49 2.8<br />
1997 30 2.2<br />
TISA<br />
Year TN TP<br />
kt/a kt/a<br />
Tiszabecs 1994 11 0.6<br />
1995 10 0.8<br />
1996 5 0.5<br />
1997 5 0.7<br />
Tiszasziget 1994 53 4.3<br />
1995 54 4.5<br />
1996 48 5.5<br />
1997 63 9.7<br />
This table contains river load values computed by the author, based on simultaneous measurements of concentrations<br />
and discharges, reported in the National Reviews.<br />
It is interesting to compare the Danube nutrient loads at the Delta with historical data. Figure 5.2<br />
provides a comparison with data compiled in the AR/203/91 "water quality targets and objectives"<br />
project (Vituki, 1997) and data from (RMRI, 1998).
Danube Water Quality Model Simulations 35<br />
900<br />
800<br />
Reni (AR/203/91) Reni/Isaccea (NR) Sulina/Ceatal Ismail (RMRI)<br />
700<br />
TI<br />
N<br />
lo<br />
ad<br />
(kt<br />
/a)<br />
600<br />
500<br />
400<br />
300<br />
200<br />
100<br />
0<br />
1960 1976 1988 1989 1990 1991 1992 1993 1994 1995 1996 1997<br />
AR/203/91 uses monthly concentration measurements for the station Reni, Danube km 132 (in the framework of the<br />
Budapest declaration) combined with monthly averaged flows. The Romanian National Review uses monthly<br />
concentration measurements for the station Reni, Danube km 132 (in the framework of the Budapest declaration)<br />
combined with monthly averaged flows for the nearby station of Isaccea.RMRI uses monthly averaged concentration<br />
measurements from daily monitoring at Sulina, Sulina branch km 0, combined with monthly averaged flows for the<br />
station Ceatal Ismail, Danube km 80.<br />
Figure 5.5a<br />
Historic overview of Danube nutrient loads: Nitrogen.<br />
70<br />
60<br />
Reni (AR/203/91)<br />
Reni/Isaccea (NR)<br />
tot<br />
-P<br />
lo<br />
ad<br />
(kt<br />
/a)<br />
50<br />
40<br />
30<br />
20<br />
10<br />
0<br />
1960 1976 1988 1989 1990 1991 1992 1993 1994 1995 1996 1997<br />
AR/203/91 uses monthly concentration measurements for the station Reni, Danube km 132 (in the framework of the<br />
Budapest declaration) combined with monthly averaged flows. The Romanian National Review uses monthly<br />
concentration measurements for the station Reni, Danube km 132 (in the framework of the Budapest declaration)<br />
combined with monthly averaged flows for the nearby station of Isaccea.<br />
Figure 5.5b<br />
Historic overview of Danube nutrient loads: Phosphorus.
36 Danube Pollution Reduction Programme<br />
Figure 5.5a shows a large difference between the load estimates from different information sources.<br />
For 1988-1995 the nitrogen loads reported by (RMRI, 1998) are considerably larger than those<br />
reported by (Vituki, 1997) and those computed by the author from data in the National Review of<br />
Romania. Only for 1996-1997 the data are more or less consistent. A similar comparison for<br />
phosphorus was not possible, since (RMRI, 1998) does not report total phosphorus loads. The large<br />
discrepancy in the loads shown in figure 5.5a needs a further investigation. To this end, we plotted<br />
the equivalent yearly average flow (figure 5.6a) and the yearly average concentration (figure 5.6b)<br />
from the same information sources.<br />
8000<br />
W 7000<br />
at<br />
er<br />
6000<br />
di 5000<br />
sc<br />
ha 4000<br />
rg<br />
e 3000<br />
(m<br />
3/ 2000<br />
1000<br />
Reni (AR/203/91) Isaccea (NR) Ceatal Ismail (RMRI)<br />
0<br />
1960 1976 1988 1989 1990 1991 1992 1993 1994 1995 1996 1997<br />
Figure 5.6a<br />
Historic overview of yearly average Danube River discharges.<br />
5.0<br />
TI<br />
N<br />
4.0<br />
co<br />
nc<br />
ent<br />
rati 3.0<br />
on<br />
(m<br />
g/l) 2.0<br />
1.0<br />
Reni (AR/203/91) Reni (NR) Sulina (RMRI)<br />
0.0<br />
1960 1976 1988 1989 1990 1991 1992 1993 1994 1995 1996 1997<br />
Figure 5.6b<br />
Historic overview of yearly averaged total inorganic nitrogen<br />
concentrations near the Danube mouth.<br />
Figure 5.6 demonstrates a clear explanation for the discrepancies in the inorganic nitrogen loads.<br />
The yearly averaged flows are more or less equal in all three information sources. The yearly<br />
averaged concentrations however, show dramatic differences between the RMRI data and the other<br />
two information sources. It is hard to say what the reason is for this difference. Some possible<br />
explanations can be identified:<br />
<br />
<br />
the large distance (about 130 km) between the two concentration sampling points,<br />
including the complete Danube delta (pers.comm. Popescu);<br />
differences in sampling and analysis methodologies and quality control procedures.
6. Model Results<br />
The water quality model has been run with the data discussed in paragraph 5. The following 2<br />
“scenarios” have been calculated:<br />
<br />
<br />
A “low” scenario: with the lower estimate for the point sources, with 80% of the diffuse<br />
sources, and with the lower estimate for the immission/emission ratio.<br />
A “high” scenario: with the higher estimate for the point sources, with 120% of the<br />
diffuse sources, and with the higher estimate for the immission/emission ratio.<br />
6.1. River Discharges<br />
The computed river flows are presented for the following important cross-boundary stations (see<br />
Appendix 9):<br />
<br />
<br />
<br />
<br />
<br />
station Jochenstein, at the D-A border (where flows have been prescribed);<br />
station Bezdan, at the H-YU border (where flows have been prescribed);<br />
station Delta (where flows have been prescribed);<br />
station Wolfsthal, at the A-SK border (where flows have been prescribed);<br />
station Smederovo, downstream of the Tisa and Sava tributaries (where flows have been<br />
interpolated, based on the prescribed flows in Bezdan, at the Delta, in the Drava, Tisa,<br />
Sava, Prut and Siret rivers, and on the catchment profile in between).<br />
The model performance is satisfactory, with one remark.<br />
The modelled flow series at the Delta show higher peaks and lower minima than the observed flow<br />
series. This is probably due to an artefact created by the final correction step to satisfy the water<br />
balance equation (described in paragraph 3.5). When the flow is going to decrease in the next<br />
hydrological period, the model anticipates the expected fall of the water level and increases the<br />
flow to compensate for it. This phenomenon sharpens a flow peak. The opposite happens when the<br />
flow is bound to increase. It is probably not necessary to apply a correction.<br />
6.2. Nutrient Concentrations<br />
The computed nutrient concentrations are presented for the following important cross-boundary<br />
stations :<br />
<br />
<br />
<br />
<br />
<br />
station Jochenstein, at the D-A border;<br />
station Wolfsthal, at the A-SK border;<br />
station Hercegszanto, close to the H-YU border;<br />
station Bazias, at the beginning of the common YU-RO Danube stretch;<br />
station Reni, near the Delta;<br />
at stations close to the mouth of the Drava (D. Miholjac, km 78, Dravaszabolcs, km 68);<br />
station Tiszasziget, at km 162 in the Tisa at the H-YU border;<br />
station Zupanja, at km 254 in the Sava near the CR-YU border.<br />
<br />
For nitrogen the following parameters are presented:<br />
<br />
<br />
<br />
TotN-high: the computed total nitrogen concentration for the “high” scenario;<br />
TotN-low: the computed total nitrogen concentration for the “low” scenario;<br />
TotN-obs: the measured total nitrogen concentration (if available);
38 Danube Pollution Reduction Programme<br />
<br />
<br />
TIN-obs: the observed concentration of total inorganic nitrogen, with the estimated<br />
organic nitrogen shown as an "error bar" (if TotN is not measured, see paragraph 4.5.3);<br />
N-NO3-obs: the observed concentration of nitrates (in some cases).<br />
For phosphorus, the following parameters are presented:<br />
<br />
<br />
<br />
TotP-high: the computed total phosphorus concentration for the “high” scenario;<br />
TotP-low: the computed total phosphorus concentration for the “low” scenario;<br />
TotP-obs: the observed total phosphorus concentration, with an error bar representing the<br />
high flow problem and the stratification problem (see paragraph 4.5.2).<br />
If the total nitrogen concentration (including the organic fraction) is not measured, the measured<br />
concentrations of total inorganic nitrogen are shown. In this case, an "error bar" is added indicating<br />
the estimated organic nitrogen (see paragraph 4.5.3).<br />
The observed total phosphorus concentrations are shown with an “error bar” on the upper side. This<br />
bar has a length of 100% of the measured value, so the top is at 200% of the measured value. Its<br />
intention is to visualise the fact that the measured concentrations are not representing the average<br />
river load, due to the high flow problem and the stratification problem (see paragraph 4.5.2).<br />
The results for nitrogen are satisfactory. Except for the Sava river, the “high” and “low” scenario<br />
enclose the observed concentrations. We could say that the “high” scenario tends to be closer to the<br />
measured concentrations than the “low” scenario, especially for Jochenstein, for the Drava and for<br />
the Sava. The large difference between the “high” and the “low” scenario on the Tisa is<br />
remarkable.<br />
The results for phosphorus are also satisfactory, except for the station Bazias. Later on, when we<br />
will look at the river loads, we will see that the observed values for Bazias can hardly be correct.<br />
Except for the station Bazias, the “high” and “low” scenario enclose a large part of the observed<br />
concentrations and the associated “error bars”. This time we could say that the “low” scenario tends<br />
to be closer to the measured concentrations than the “high” scenario, especially for Wolfsthal and<br />
Reni. Again, the large difference between the “high” and the “low” scenario on the Tisa is<br />
remarkable.<br />
The large difference between the "high" and "low" scenario for the Tisa station can be explained as<br />
follows. The Tisa basin is characterised by a low specific runoff. Under such circumstances, the<br />
high and low estimates of the immission/emission-factor (tables 4.5a and 4.5b) are far apart.<br />
Hungary in particular presents an extreme case: the high estimate of this factor is 36%, and the low<br />
estimate 5%. This means that due to this factor alone the high and low estimates of the nutrient<br />
emission from Hungary which reaches the river network, differs by a factor of 7! Therefore, the<br />
predicted river concentrations in the Tisa differ a lot between the "high" and "low" scenarios.<br />
In general we observe a better agreement between the model results and the measured<br />
concentrations for the upper part of the Danube than for the lower part. One factor to explain this<br />
difference is the following. Between Hercegszanto the major tributaries Sava, Tisa and Drava flow<br />
into the Danube. These tributaries drain large parts of the countries Croatia, Yugoslavia and<br />
Bosnia-Herzegovina. For these three countries, we do not have real estimates of the diffuse<br />
emissions. The numbers which were used in the computations are based on average emission<br />
factors, valid for the other 10 Danube countries in the year 1992 (see paragraphs 4.2 and 5.3).<br />
Taking into account this major difficulty, the model results are satisfactory.
N<br />
(m<br />
g/l<br />
)<br />
5<br />
4<br />
3<br />
2<br />
Station Jochenstein<br />
1<br />
0<br />
TotN-high TotN-low TIN-obs N-NO3-obs<br />
January-94 January-95 January-96 January-97<br />
5<br />
4<br />
Station Wolfsthal<br />
3<br />
2<br />
N (mg/l)<br />
1<br />
0<br />
TotN-high TotN-low TIN-obs N-NO3-obs<br />
January-94 January-95 January-96 January-97<br />
The lines represent in-stream concentrations computed by the Danube Water<br />
Quality Model. “High” indicates a high estimate for the emissions combined with<br />
a weak retention in the basin.<br />
Figure 6.1a Computed and observed concentrations of total<br />
nitrogen<br />
5<br />
4<br />
Station Hercegszanto<br />
3<br />
2<br />
N (mg/l)<br />
1<br />
0<br />
TotN-high TotN-low TotN-obs N-NO3-obs<br />
January-94 January-95 January-96 January-97<br />
5<br />
4<br />
Station Bazias<br />
3<br />
2<br />
N (mg/l)<br />
1<br />
0<br />
TotN-high TotN-low TIN-obs N-NO3-obs<br />
January-94 January-95 January-96 January-97<br />
“Low” indicates a low estimate for the emissions combined with a strong retention<br />
in the basin. The points represent measured concentrations. Note that the accuracy<br />
of such measurements is never perfect. Note also that for most stations the<br />
measurements of total nitrogen are estimated from total inorganic nitrogen rather<br />
than really measured (see paragraph 4.5.3).
5<br />
4<br />
Station Reni<br />
3<br />
2<br />
N (mg/l)<br />
1<br />
0<br />
TotN-high TotN-low TIN-obs N-NO3-obs<br />
January-94 January-95 January-96 January-97<br />
5<br />
4<br />
Drava near km 70<br />
3<br />
2<br />
N (mg/l)<br />
1<br />
0<br />
TotN-high TotN-low TN-D.Mih TIN-Dravasz.<br />
January-94 January-95 January-96 January-97<br />
The lines represent in-stream concentrations computed by the Danube Water<br />
Quality Model. “High” indicates a high estimate for the emissions combined with<br />
a weak retention in the basin.<br />
Figure 6.1b Computed and observed concentrations of total<br />
nitrogen.<br />
5<br />
4<br />
Station Tiszasziget (Tisa km 162)<br />
3<br />
2<br />
N (mg/l)<br />
1<br />
0<br />
TotN-high TotN-low TN-obs<br />
January-94 January-95 January-96 January-97<br />
5<br />
4<br />
Station Zupanja (Sava)<br />
3<br />
2<br />
N (mg/l)<br />
1<br />
0<br />
TotN-high TotN-low TN-obs<br />
January-94 January-95 January-96 January-97<br />
“Low” indicates a low estimate for the emissions combined with a strong retention<br />
in the basin. The points represent measured concentrations. Note that the accuracy<br />
of such measurements is never perfect. Note also that for most stations the<br />
measurements of total nitrogen are estimated from total inorganic nitrogen rather<br />
than really measured (see paragraph 4.5.3).
0.5<br />
TotP-high TotP-low TotP-obs<br />
0.4<br />
Station Jochenstein<br />
0.3<br />
0.2<br />
P (mg/l)<br />
0.1<br />
0<br />
January-94 January-95 January-96 January-97<br />
0.5<br />
TotP-high TotP-low TotP-obs<br />
0.4<br />
Station Wolfsthal<br />
0.3<br />
0.2<br />
P (mg/l)<br />
0.1<br />
0<br />
January-94 January-95 January-96 January-97<br />
The lines represent in-stream concentrations computed by the Danube Water<br />
Quality Model. “High” indicates a high estimate for the emissions combined with<br />
a weak retention in the basin.<br />
Figure 6.2a Computed and observed concentrations of total<br />
phosphorus.<br />
0.5<br />
0.4<br />
Station Hercegszanto<br />
0.3<br />
0.2<br />
P (mg/l)<br />
0.1<br />
0<br />
TotP-high TotP-low TotP-obs<br />
January-94 January-95 January-96 January-97<br />
0.5<br />
TotP-high TotP-low TotP-obs<br />
0.4<br />
Station Bazias<br />
0.3<br />
0.2<br />
P (mg/l)<br />
0.1<br />
0<br />
January-94 January-95 January-96 January-97<br />
“Low” indicates a low estimate for the emissions combined with a strong retention<br />
in the basin. The points represent measured concentrations. Note that the accuracy<br />
of such measurements is never perfect. Note also that the error bars represent the<br />
high flow problem and the stratification problem (see paragraph 4.5.2).
0.5<br />
TotP-high TotP-low TotP-obs<br />
0.4<br />
Station Reni<br />
0.3<br />
0.2<br />
P (mg/l)<br />
0.1<br />
0<br />
January-94 January-95 January-96 January-97<br />
1<br />
TotP-high TotP-low TotP-DravaSz.<br />
0.8<br />
Station Dravaszabolcs<br />
0.6<br />
0.4<br />
P (mg/l)<br />
0.2<br />
0<br />
January-94 January-95 January-96 January-97<br />
Figure 6.2b Computed and observed concentrations of total<br />
phosphorus.<br />
1<br />
TotP-high TotP-low TotP-obs<br />
0.8<br />
Station Tiszasziget<br />
0.6<br />
0.4<br />
P (mg/l)<br />
0.2<br />
0<br />
January-94 January-95 January-96 January-97<br />
The lines represent in-stream concentrations computed by the Danube Water<br />
Quality Model. “High” indicates a high estimate for the emissions combined with<br />
a weak retention in the basin.<br />
“Low” indicates a low estimate for the emissions combined with a strong retention<br />
in the basin. The points represent measured concentrations. Note that the accuracy<br />
of such measurements is never perfect. Note also that the error bars represent the<br />
high flow problem and the stratification problem (see paragraph 4.5.2).
Danube Water Quality Model Simulations 43<br />
6.3. Nutrient Loads<br />
The computed and observed loads of nitrogen and phosphorus are presented in figure 6.3 below.<br />
The computed loads are presented as lines, the observed loads as bars.<br />
600<br />
500<br />
1994 1995 1996<br />
1997 Low High<br />
N load (kT/a)<br />
400<br />
300<br />
200<br />
100<br />
0<br />
Jochenstein Wolfsthal Hercegszanto Bazias Reni<br />
Figure 6.3a<br />
Observed and computed nutrient loads (nitrogen).<br />
P load (kT/a)<br />
70<br />
60<br />
50<br />
40<br />
30<br />
20<br />
10<br />
0<br />
1994 1995 1996<br />
1997 Low High<br />
Jochenstein Wolfsthal Hercegszanto Bazias Reni<br />
The lines represent the in-stream concentrations computed by the Danube Water Quality Model. “High” indicates a high<br />
estimate for the emissions combined with a weak retention in the basin. “Low” indicates a low estimate for the emissions<br />
combined with a strong retention in the basin. The bars represent the in-stream loads computed from simultaneous<br />
measurements of concentrations and discharges (see paragraph 5.4). Note that the accuracy of such measurements and<br />
the subsequent load calculation is never perfect. Note also that the nitrogen loads in the bars are for most stations based<br />
on total nitrogen concentrations which have been estimated from the measured total inorganic nitrogen concentrations<br />
(see paragraph 4.5.3). Note also that the phosphorus loads have error bars (factor 2) which represent a correction for<br />
the high flow problem and the stratification problem (see paragraph 4.5.2).<br />
Figure 6.3b<br />
Observed and computed nutrient loads (phosphorus).
44 Danube Pollution Reduction Programme<br />
The results are satisfactory for both nitrogen and phosphorus. Note that the “observed loads” have<br />
been multiplied by a factor of 2, to account for the high flow problem and the stratification<br />
problem. Note also that for phosphorus the model predicts the largest increase in the river load<br />
between Hercegszanto and Bazias, due to the inflow of the Drava, Sava and Tisa tributaries. The<br />
observations however, show the largest increase between Bazias and Reni, which we do not really<br />
understand.<br />
Figure 6.4 shows similar graphs for the tributaries. For nitrogen, the Drava and Tisa rivers are<br />
modelled more or less correct, whereas the Sava load is underestimated. For phosphorus, the Drava<br />
and Tisa rivers are also modelled more or less correct. There was no information to check the Sava<br />
load.
50<br />
45<br />
40<br />
35<br />
30<br />
25<br />
20<br />
15<br />
10<br />
5<br />
80<br />
70<br />
60<br />
50<br />
40<br />
30<br />
20<br />
10<br />
0<br />
140<br />
120<br />
100<br />
80<br />
60<br />
40<br />
20<br />
0<br />
1994 1995 1996<br />
1997 Low High<br />
Ormoz (km 300) D.Miholjac (km 78) Dravaszabolcs (km<br />
68)<br />
1994 1995 1996<br />
1997 Low High<br />
TiszaBecs (km 757) Tiszasziget (km 162)<br />
1994 1995 1996<br />
1997 Low High<br />
Jesenice (km 729) Zupanja (km254)<br />
10.0<br />
9.0<br />
8.0<br />
7.0<br />
6.0<br />
5.0<br />
4.0<br />
3.0<br />
2.0<br />
1.0<br />
0.0<br />
1994 1995 1996<br />
1997 Low High<br />
Ormoz (km 300) D.Miholjac (km 78) Dravaszabolcs (km<br />
68)<br />
0<br />
N load (kT/a)<br />
N load (kT/a)<br />
N load (kT/a)<br />
P load (kT/a)<br />
20.0<br />
18.0<br />
16.0<br />
14.0<br />
12.0<br />
10.0<br />
8.0<br />
6.0<br />
4.0<br />
2.0<br />
0.0<br />
1994 1995 1996<br />
1997 Low High<br />
P load (kT/a)<br />
TiszaBecs (km 757) Tiszasziget (km<br />
162)<br />
Note that phosphorus data for the Sava were not available.<br />
Figure 6.4. Observed and computed in-stream loads of<br />
nitrogen (left) and phosphorus (right) in the<br />
main tributaries Drava (top), Tisa (middle) and<br />
Sava (bottom).
7. Simulations in Support to the Transboundary Diagnostic<br />
Analysis<br />
7.1. General<br />
7.1.1. Computational Procedure<br />
In the framework of the Transboundary Diagnostic Analysis (TDA), one of the interesting question<br />
is to show a longitudinal profile of the load along the river Danube, which is subdivided over the<br />
countries from which these loads originate. From a mathematical point of view, such a result can be<br />
produced with the Danube Water Quality Model as long as the removal processes are linear<br />
(proportional with the concentration of the disappearing substance). This is by approximation the<br />
case. Trial computations have been made as follows:<br />
<br />
<br />
<br />
in stead of 1 set of emission data, 13 sets have been prepared, each holding the emissions<br />
of one country;<br />
13 runs with the DWQM have been made, and the resulting load profiles written to file;<br />
the 13 profiles have been added into one graph.<br />
We have checked that the joint individual result of all 13 countries equals the overall result from a<br />
run with all 13 countries together. This was indeed the case within 1% of accuracy.<br />
7.1.2. Emissions<br />
The emission estimates used for the TDA calculations should be somewhere in between the “high”<br />
and the “low” scenarios discussed in paragraph 6, in order to be consistent with our analysis so far.<br />
For nitrogen, we chose them in such a way that the load to the Delta equals the Danube nitrogen<br />
load reported by (RMRI, 1998). We selected their average value for 1994-1997, being 443 kt/a, and<br />
increased this value with 22% to account for the organic nitrogen fraction (see paragraph 4.5.3).<br />
The result was 540 kt/a, which corresponds to 96% of the “high” scenario. For phosphorus, we<br />
chose the average Danube in-stream load for 1994-1997, as it was computed in the present report,<br />
and increased that value with a factor of two, to account for the high flow problem and the<br />
stratification problem (see paragraph 4.5.2). The result was 48 kt/a, which corresponds to 79% of<br />
the “high” scenario.<br />
7.1.3. In-Stream Denitrification<br />
The river load profile for nitrogen is affected by the in-stream denitrification coefficient. In<br />
paragraph 6, the “high” and “low” scenario were made with a constant value of 0,05 m/d. Here, we<br />
made two TDA calculations: one with a weaker denitrification (0.033 m/d) and one with a stronger<br />
denitrification (0.075 m/d). In order to keep the load to the Delta more or less constant, the<br />
emissions needed to be decreased in one case and increased in the other. Finally, we did the two<br />
calculations with the emissions equal to 92% and 101% of those in the “high scenario”.
48 Danube Pollution Reduction Programme<br />
7.2. The Water Volume along the Danube<br />
Before proceeding to the in-stream load profiles of nitrogen and phosphorus, we first present the<br />
computed water volume in the Danube, subdivided over the countries of origin. The computation<br />
was made in agreement with the methodology presented in paragraph 3.<br />
The main Danube tributaries of the Danube are clearly visible in figure 7.1, as points where the<br />
water volume shows a discontinuous increase. The increase is particularly strong at the inflows of<br />
the Drava, Tisa and Sava tributaries. If we compare this figure to figure 3.1 (catchment area), we<br />
observe that the relative share of the water volume from the upper Danube countries is much bigger<br />
than their share of the catchment. This reflects their high area specific runoff.<br />
7.3. The Nutrient Loads along the Danube<br />
Figure 7.2 presents the phosphorus load profile along the Danube, subdivided over the countries of<br />
origin. The graph follows the water volume graph (figure 7.1) with one major difference. Just<br />
downstream of the load increase caused by the Drava, Tisa and Sava inflows, a substantial part of<br />
the load is retained in the backwater area of the Iron Gates dams. This is caused by sedimentation<br />
of a part of the phosphorus which is adsorbed to suspended solids.<br />
Figure 7.3 presents the nitrogen load profile along the Danube, subdivided over the countries of<br />
origin. The graph follows the water volume graph (figure 7.1), but in this case the loads all slowly<br />
diminish due to the denitrification process. This is not a strong effect however, and consequently<br />
the graphs made for a weaker (figure 7.3a) and for a stronger (figure 7.3b) denitrification rate do<br />
not show large differences.
250<br />
M990604g<br />
3<br />
water Km /a<br />
200<br />
Germany Austria Czech_Re Slovakia<br />
Hungary Slovenia Croatia Yugoslav<br />
8.6<br />
1.5<br />
(4.3%)<br />
(0.7%)<br />
Bosnia_H Bulgaria Romania Moldova<br />
Ukraine<br />
35.6<br />
(17.6%)<br />
7.5<br />
150<br />
17.8<br />
(3.7%)<br />
(8.8%)<br />
23.0<br />
(11.3%)<br />
100<br />
13.0<br />
6.3<br />
8.8<br />
3.9<br />
2.5<br />
(6.4%)<br />
(3.1%)<br />
(4.3%)<br />
(1.9%)<br />
(1.2%)<br />
50<br />
44.8<br />
(22.1%)<br />
29.5 (14.5%)<br />
0<br />
source<br />
Inn<br />
D-A border<br />
Morava/A-SK-H border<br />
H to CR/YU<br />
Drava<br />
Tisa<br />
Sava<br />
YU-RO border<br />
Iron Gates<br />
YU-BG border<br />
BG-RO border<br />
outflow<br />
Figure 7.1. Longitudinal profile of the annual water volume in the Danube (in km 3 /a), subdivided over the countries of origin.<br />
total 202.8<br />
(100%)
50<br />
phosphorus (kt/a)<br />
45<br />
40<br />
35<br />
GERMANY AUSTRIA CZECH_RE SLOVAKIA<br />
HUNGARY SLOVENIA CROATIA YUGOSLAV<br />
BOSNIA_H BULGARIA ROMANIA MOLDOVA<br />
UKRAINE<br />
4.0<br />
1.4<br />
12.7<br />
(8.1%)<br />
(2.9%)<br />
(26.0%)<br />
30<br />
4.0<br />
(8.1%)<br />
25<br />
2.2<br />
(4.6%)<br />
20<br />
7.0<br />
(14.4%)<br />
15<br />
2.2<br />
1.3<br />
(4.5%)<br />
(2.7%)<br />
10<br />
3.8<br />
1.7<br />
1.1<br />
(7.7%)<br />
(3.5%)<br />
(2.2%)<br />
5<br />
3.8<br />
(7.7%)<br />
0<br />
total<br />
3.7<br />
48.9<br />
(7.6%)<br />
(100%)<br />
source<br />
Inn<br />
D-A border<br />
M o ra va/A -S K -H b ord er<br />
H to CR/Y U<br />
Drava<br />
Tisa<br />
Sava<br />
YU-RO border<br />
Iron Gates<br />
YU-BG border<br />
BG-RO border<br />
outflow<br />
Figure 7.2. Longitudinal profile of the annual phosphorus load in the Danube (in kt/a), subdivided over the countries of origin.
600<br />
nitrogen (kt/a)<br />
500<br />
GERMANY AUSTRIA CZECH_RE SLOVAKIA<br />
HUNGARY SLOVENIA CROATIA YUGOSLAV<br />
BOSNIA_H BULGARIA ROMANIA MOLDOVA<br />
8<br />
27<br />
115<br />
(5.0%)<br />
(1.4%)<br />
(21.3%)<br />
400<br />
UKRAINE<br />
21 (4.0%)<br />
34<br />
(6.4%)<br />
300<br />
69<br />
(12.8%)<br />
22<br />
(4.1%)<br />
200<br />
19<br />
30<br />
30<br />
(3.6%)<br />
(5.6%)<br />
(5.5%)<br />
15<br />
(2.8%)<br />
100<br />
77<br />
(14.4%)<br />
70<br />
(13%)<br />
0<br />
total 537 (100%)<br />
source<br />
Inn<br />
D-A border<br />
Morava/A-SK-H border<br />
H to CR/YU<br />
Drava<br />
Tisa<br />
Sava<br />
YU-RO border<br />
Iron Gates<br />
YU-BG border<br />
BG-RO border<br />
outflow<br />
Figure 7.3a Longitudinal profile of the annual nitrogen load in the Danube (in kt/a), subdivided over the countries of origin, with a<br />
low estimate for the in-stream denitrification (= removal) rate.
600<br />
nitrogen (kt/a)<br />
500<br />
GERMANY AUSTRIA CZECH_RE SLOVAKIA<br />
HUNGARY SLOVENIA CROATIA YUGOSLAV<br />
BOSNIA_H BULGARIA ROMANIA MOLDOVA<br />
28<br />
8<br />
121<br />
(5.1%)<br />
(1.5%)<br />
(22%)<br />
400<br />
UKRAINE<br />
23 (4.1%)<br />
36<br />
(6.5%)<br />
300<br />
72<br />
(13.1%)<br />
23<br />
(4.1%)<br />
20<br />
(3.5%)<br />
200<br />
31<br />
30<br />
15<br />
(5.6%)<br />
(5.4%)<br />
(2.8%)<br />
100<br />
77<br />
(13.9%)<br />
68<br />
(12.3%)<br />
0<br />
total 551 (100%)<br />
source<br />
Inn<br />
D-A border<br />
M orav a/A -SK -H border<br />
H to C R/YU<br />
Drava<br />
Tisa<br />
Sava<br />
YU-RO border<br />
Iron Gates<br />
YU-BG border<br />
B G -R O bo rd er<br />
outflow<br />
Figure 7.3b Longitudinal profile of the annual nitrogen load in the Danube (in kt/a), subdivided over the countries of origin, with a<br />
high estimate for the in-stream denitrification (= removal) rate.
Danube Water Quality Model Simulations 53<br />
8. Simulations in support to the Pollution Reduction<br />
Programme<br />
8.1. General<br />
8.1.1. Definition of the Projects in the PRP<br />
The simulations with the DWQM in support to the Pollution Reduction Programme (PRP) have the<br />
objective of estimating the effects of the projects proposed in the PRP on the in-stream<br />
transboundary transport of pollution. The precise definition of the projects in the PRP was taken<br />
from the PRP report (GEF Danube Pollution Reduction Programme, 1999).<br />
For the DWQM simulations the projects in the PRP are divided in 2 groups, which are treated<br />
differently: (1) projects aimed at the reduction of emissions, (2) projects aimed at increasing the<br />
self-purification capacity of the river, in particular the restoration of wetlands.<br />
8.1.2. Consequences of the Projects in the PRP for the Pollution Sources in<br />
the DWQM<br />
The procedure below was followed:<br />
<br />
the existing list of “emissions directly to the river” (i.e. introduced as a point source in the<br />
model, on the actual position in the river network, see Appendix 6) had to be updated:<br />
a. some projects in the PRP were not yet in the list: those were added;<br />
b. for some pollution sources which are present in the PRP the estimated emission was<br />
smaller than the reduction after implementation of the PRP: in those cases the<br />
emission estimates were increased;<br />
a complete list was made of all PRP projects;<br />
those which actually quantify an emission reduction were selected;<br />
from the selected projects, the largest individual projects were selected, which all together<br />
make up 80% of the total emission reduction;<br />
the reductions of the list of “80%” were applied to the list of “emissions directly to the<br />
river” (figure 4.1);<br />
the remaining reductions were applied to the “remaining emissions” (figure 4.1).<br />
The updated list of “emissions directly to the river”, with and without implementation of the PRP,<br />
is listed in appendix 13.<br />
8.1.3. Consequences of Wetlands Restoration Projects in the PRP for the<br />
DWQM<br />
The wetlands in the Danube basin in its current state are included in the "retention in the<br />
catchment" as it is described in paragraphs 4.3 and 4.4 of the present report. For the wetlands<br />
proposed to be restored in the PRP we followed a different technique. The starting point was the<br />
additional nutrient removal by these restored wetlands as estimated in (GEF Danube Pollution<br />
Reduction Programme, 1999). A boundary condition was that a presentation of the results per<br />
country and per sector (see below) must be possible. As a consequence, the additional nutrient<br />
removal by restored wetlands needed to be implemented as a fully linear process. This goal was<br />
achieved by a local increase of the intensity of the existing linear in-stream removal processes:<br />
denitrification (nitrogen) and sedimentation (phosphorus) at the projected locations of the restored<br />
wetlands.
54 Danube Pollution Reduction Programme<br />
The area of the restored wetlands was computed from their total nutrient removal by a factor<br />
expressing the nutrient removal capacity of the wetlands: 0.1 tN/y/ha and 0.01 tP/y/ha. The local<br />
increase of the equivalent linear removal processes in the DWQM was determined by making trial<br />
runs and matching the total nutrient removal by the wetlands with the desired values in the PRP.<br />
The result was: an effective net settling velocity for total phosphorus of 0.016 m/d, and a<br />
denitrification rate at 20 °C of 0.025 m/d. These values can be compared to those for the existing<br />
removal processes in the DWQM: an effective net settling velocity for total phosphorus of 1.3 m/d<br />
in the Iron Gates lakes, and a denitrification rate at 20 °C of 0.05 m/d.<br />
8.1.4. Emissions data<br />
New data about the emissions estimates from the years 1996-1997 have been incorporated in the<br />
simulations in support to the PRP. This causes a small difference between the "baseline"<br />
computations in the PRP simulations and the computations made for the Transboundary Analysis.<br />
This difference should not be interpreted as a trend between the years 1996-1997 on one hand and<br />
the year 1992 on the other hand. Either such a trend is not present, or the basic data do not allow an<br />
analysis refined enough to detect it. The difference should be interpreted in stead as a reflection of<br />
the inaccuracies related to our imperfect knowledge of the system.<br />
8.1.5. Computational procedure<br />
The computational procedure included one new element: similar to the subdivision over the 13<br />
Danube countries which was made before, we now also made a subdivision over the emissions<br />
from "sectors": population, industry, agriculture and others (mainly emissions from natural areas).<br />
Some small corrections and refinements had to be introduced in the data, to allow a consistent<br />
subdivision over the sectors:<br />
<br />
<br />
<br />
Table 8.1.<br />
the diffuse sources term “base flow” was subdivided over “population”, “agriculture” and<br />
“other” with an average ratio for all Danube countries, derived from the 1992 Nutrient<br />
Balances data (University of Vienna, 1997), see table 8.1;<br />
for some countries and some sectors the estimated total emissions according to<br />
(University of Vienna, 1999) were smaller than the “emissions directly to the river”,<br />
which leads to a negative number for the “remaining emissions”: corrections have been<br />
applied to the estimated totals;<br />
for some countries and some sectors the total emissions according to (University of<br />
Vienna, 1999) were smaller than the total reduction of pollution in the PRP, which leads<br />
again to a negative number for the “remaining emissions”: further corrections have been<br />
applied to the estimated totals.<br />
Sector<br />
Distribution of the "base flow" emissions over the sectors.<br />
Fraction of “base flow”,<br />
nitrogen (%)<br />
Fraction of “base flow”,<br />
phosphorus (%)<br />
Population 12 33<br />
Agriculture 50 33<br />
Other 38 33
Danube Water Quality Model Simulations 55<br />
8.2. Overview of Total Emissions in the Baseline Simulation<br />
The total emissions data are presented below, as totals over the Danube basin, subdivided over the<br />
sectors (figure 8.1) and subdivided over point sources and diffuse sources (figure 8.2).<br />
N (kt/a)<br />
Other<br />
20%<br />
Population<br />
27%<br />
Industry<br />
5%<br />
Figure 8.1a<br />
Agriculture<br />
48%<br />
Total nitrogen emissions, subdivided over the sectors.<br />
Other<br />
6%<br />
P (kt/a)<br />
Population<br />
39%<br />
Agriculture<br />
47%<br />
Industry<br />
8%<br />
Figure 8.1b Total phosphorus emissions, subdivided over the sectors.<br />
Figure 1 demonstrates that the share of the sector “population” is much larger for phosphorus than it is for<br />
nitrogen. The difference is compensated by the share of the sector “other” (e.g. forest and nature areas).
56 Danube Pollution Reduction Programme<br />
N (kt/a)<br />
Point sources<br />
26%<br />
Diffuse sources<br />
74%<br />
Figure 8.2a<br />
Total nitrogen emissions, subdivided over point sources and diffuse<br />
sources.<br />
P (kt/a)<br />
Point sources<br />
42%<br />
Diffuse sources<br />
58%<br />
Figure 8.2b<br />
Total phosphorus emissions, subdivided over point sources and<br />
diffuse sources.<br />
Figure 2 demonstrates that the share of the point sources is much larger for phosphorus than it is for<br />
nitrogen.
0<br />
8<br />
2<br />
6<br />
5<br />
4<br />
4<br />
7<br />
4<br />
1<br />
5<br />
Danube Water Quality Model Simulations 57<br />
8.3. Computed Longitudinal In-Stream Load Profiles, Subdivided per<br />
Country<br />
kt/a<br />
14<br />
kt/a<br />
68<br />
14<br />
69<br />
12<br />
29<br />
26<br />
15<br />
20<br />
14<br />
68<br />
31<br />
18<br />
20<br />
99<br />
26<br />
100<br />
487<br />
2<br />
6<br />
5<br />
3<br />
4<br />
6<br />
4<br />
1<br />
5<br />
7<br />
source<br />
M990603a<br />
source<br />
GERMANY AUSTRIA CZECH_RE SLOVAKIA<br />
HUNGARY SLOVENIA CROATIA YUGOSLAV<br />
BOSNIA_H BULGARIA ROMANIA MOLDOVA<br />
UKRAINE<br />
Inn<br />
D-A border<br />
Inn<br />
D-A border<br />
Baseline<br />
PRP implementation<br />
Morava/A-SK-H border<br />
Morava/A-SK-H border<br />
H to CR/YU<br />
Drava<br />
H to CR/YU<br />
Drava<br />
Tisa<br />
Sava<br />
Tisa<br />
Sava<br />
YU-RO border<br />
Iron Gates<br />
YU-BG border<br />
YU-RO border<br />
Iron Gates<br />
YU-BG border<br />
BG-RO border<br />
BG-RO border<br />
outflow<br />
600<br />
500<br />
400<br />
300<br />
200<br />
100<br />
100<br />
200<br />
300<br />
400<br />
500<br />
600<br />
outflow<br />
%<br />
%<br />
76<br />
13<br />
78<br />
14<br />
14<br />
32<br />
28<br />
21<br />
23<br />
88<br />
15<br />
37<br />
20<br />
113<br />
20<br />
28<br />
566 100<br />
Figure 3<br />
Figure 8.3.<br />
In-stream nitrogen load profiles per country for the Danube river,<br />
before (left side) and after (right side) implementation of the PRP.
0<br />
8<br />
8<br />
2<br />
4<br />
6<br />
3<br />
4<br />
7<br />
7<br />
3<br />
7<br />
58 Danube Pollution Reduction Programme<br />
kt/a<br />
3.7<br />
10<br />
kt/a<br />
3.4<br />
10<br />
3.4<br />
0.8<br />
1.7<br />
2.4<br />
0.6<br />
1.7<br />
12<br />
4.4<br />
2.5<br />
2.0<br />
23<br />
8.3<br />
1.0<br />
3.2<br />
100<br />
35.4<br />
2<br />
5<br />
7<br />
2<br />
5<br />
7<br />
6<br />
3<br />
9<br />
source<br />
M990603e<br />
source<br />
GERMANY AUSTRIA CZECH_RE SLOVAKIA<br />
HUNGARY SLOVENIA CROATIA YUGOSLAV<br />
BOSNIA_H BULGARIA ROMANIA MOLDOVA<br />
UKRAINE<br />
Inn<br />
D-A border<br />
Inn<br />
D-A border<br />
Baseline<br />
PRP implementation<br />
Morava/A-SK-H border<br />
Morava/A-SK-H border<br />
Drava<br />
Drava<br />
Tisa<br />
Sava<br />
Tisa<br />
Sava<br />
YU-RO border<br />
Iron Gates<br />
YU-BG border<br />
YU-RO border<br />
Iron Gates<br />
YU-BG border<br />
BG-RO border<br />
BG-RO border<br />
outflow<br />
50<br />
40<br />
30<br />
20<br />
10<br />
10<br />
20<br />
30<br />
40<br />
50<br />
outflow<br />
%<br />
%<br />
3.9<br />
1.0<br />
2.0<br />
2.8<br />
1.7<br />
2.0<br />
9.0<br />
18<br />
3.3<br />
3.3<br />
11.3<br />
23<br />
1.2<br />
3.6<br />
48.8 100<br />
Figure 4<br />
Figure 8.4.<br />
In-stream phosphorus load profiles per country for the Danube<br />
river, before (left side) and after (right side) implementation of the<br />
PRP.
0<br />
5<br />
3<br />
3<br />
2<br />
8<br />
Danube Water Quality Model Simulations 59<br />
kt/a<br />
kt/a<br />
74<br />
18<br />
11<br />
100<br />
25<br />
8<br />
8<br />
3<br />
2<br />
2<br />
5<br />
A-SL border<br />
M990603b<br />
A-SL border<br />
GERMANY AUSTRIA CZECH_RE SLOVAKIA<br />
HUNGARY SLOVENIA CROATIA YUGOSLAV<br />
BOSNIA_H BULGARIA ROMANIA MOLDOVA<br />
UKRAINE<br />
Baseline<br />
PRP implementation<br />
SL-CR border<br />
SL-CR border<br />
CR to H/CR, Mura<br />
CR to H/CR, Mura<br />
H/CR to CR<br />
H/CR to CR<br />
outflow<br />
outflow<br />
10<br />
15<br />
20<br />
25<br />
30<br />
10<br />
15<br />
20<br />
25<br />
30<br />
%<br />
%<br />
21<br />
71<br />
10<br />
11<br />
30 100<br />
Figure 5<br />
Figure 8.5.<br />
In-stream nitrogen load profiles per country for the Drava river,<br />
before (left side) and after (right side) implementation of the PRP.
60 Danube Pollution Reduction Programme<br />
kt/a<br />
kt/a<br />
62<br />
1.3<br />
17<br />
0.4<br />
0.2<br />
13<br />
0.3<br />
100<br />
2.1<br />
8<br />
A-SL border<br />
M990603f<br />
A-SL border<br />
GERMANY AUSTRIA CZECH_RE SLOVAKIA<br />
HUNGARY SLOVENIA CROATIA YUGOSLAV<br />
BOSNIA_H BULGARIA ROMANIA MOLDOVA<br />
UKRAINE<br />
Baseline<br />
PRP implementation<br />
SL-CR border<br />
SL-CR border<br />
CR to H/CR, Mura<br />
CR to H/CR, Mura<br />
H/CR to CR<br />
H/CR to CR<br />
outflow 3.0<br />
outflow<br />
0.0<br />
0.5<br />
1.0<br />
1.5<br />
2.0<br />
2.5<br />
0.5<br />
1.0<br />
1.5<br />
2.0<br />
2.5<br />
3.0<br />
%<br />
%<br />
1.6<br />
56<br />
0.4<br />
15<br />
0.5<br />
18<br />
0.3 11<br />
2.8 100<br />
Figure 6<br />
Figure 8.6.<br />
In-stream phosphorus load profiles per country for the Drava river,<br />
before (left side) and after (right side) implementation of the PRP.
0<br />
4<br />
4<br />
Danube Water Quality Model Simulations 61<br />
kt/a<br />
15<br />
kt/a<br />
11<br />
17<br />
13<br />
40<br />
31<br />
24<br />
19<br />
100<br />
78<br />
4<br />
3<br />
km 966<br />
M 990603c<br />
km 966<br />
GERMANY AUSTRIA CZECH_RE SLOVAKIA<br />
HUNGARY SLOVENIA CROATIA YUGOSLAV<br />
BOSNIA_H BULGARIA ROMANIA MOLDOVA<br />
UKRAINE<br />
Baseline<br />
PRP implementation<br />
UK-H border<br />
UK-H border<br />
Somes<br />
Somes<br />
Bodrog<br />
Bodrog<br />
Slana<br />
Slana<br />
Zagyva<br />
Zagyva<br />
Cris<br />
Cris<br />
Mures<br />
Mures<br />
H-YU border<br />
H-YU border<br />
outflow<br />
100<br />
80<br />
60<br />
40<br />
20<br />
20<br />
40<br />
60<br />
80<br />
100<br />
outflow<br />
%<br />
%<br />
12<br />
15<br />
14<br />
16<br />
33<br />
40<br />
20<br />
24<br />
82 100<br />
Figure 7<br />
Figure 8.7.<br />
In-stream nitrogen load profiles per country for the Tisa river,<br />
before (left side) and after (right side) implementation of the PRP.
0<br />
2<br />
4<br />
6<br />
8<br />
5<br />
62 Danube Pollution Reduction Programme<br />
kt/a<br />
12<br />
kt/a<br />
1.0<br />
19<br />
1.7<br />
0.3<br />
33<br />
2.9<br />
33<br />
2.9<br />
100<br />
8.9<br />
3<br />
km 966<br />
M990603g<br />
km 966<br />
GERMANY AUSTRIA CZECH_RE SLOVAKIA<br />
HUNGARY SLOVENIA CROATIA YUGOSLAV<br />
BOSNIA_H BULGARIA ROMANIA MOLDOVA<br />
UKRAINE<br />
Baseline<br />
PRP implementation<br />
UK-H border<br />
UK-H border<br />
Somes<br />
Somes<br />
Bodrog<br />
Bodrog<br />
Slana<br />
Slana<br />
Zagyva<br />
Zagyva<br />
Cris<br />
Cris<br />
Mures<br />
Mures<br />
H-YU border<br />
H-YU border<br />
outflow<br />
outflow<br />
10<br />
10<br />
2<br />
4<br />
6<br />
8<br />
%<br />
%<br />
1.2<br />
12<br />
1.8<br />
18<br />
0.5<br />
3.2<br />
32<br />
3.1<br />
32<br />
9.9 100<br />
Figure 8<br />
Figure 8.8.<br />
In-stream phosphorus load profiles per country for the Tisa river,<br />
before (left side) and after (right side) implementation of the PRP.
0<br />
Danube Water Quality Model Simulations 63<br />
km 803 M990603d<br />
km 803<br />
GERMANY AUSTRIA CZECH_RE SLOVAKIA<br />
HUNGARY SLOVENIA CROATIA YUGOSLAV<br />
BOSNIA_H BULGARIA ROMANIA MOLDOVA<br />
UKRAINE<br />
SL-CR border<br />
SL-CR border<br />
Baseline<br />
PRP implementation<br />
CR to CR/BH<br />
CR to CR/BH<br />
CR/BH to BH/YU<br />
CR/BH to BH/YU<br />
BH/YU to YU<br />
BH/YU to YU<br />
outflow<br />
140<br />
120<br />
100<br />
80<br />
60<br />
40<br />
20<br />
20<br />
40<br />
outflow<br />
kt/a<br />
%<br />
20<br />
15<br />
22<br />
17<br />
49<br />
37<br />
40<br />
31<br />
130 100<br />
13<br />
kt/a<br />
14<br />
%<br />
18<br />
20<br />
38<br />
43<br />
31<br />
34<br />
100<br />
111<br />
1<br />
60<br />
80<br />
00<br />
120<br />
140<br />
Figure 9<br />
Figure 8.9.<br />
In-stream nitrogen load profiles per country for the Sava river,<br />
before (left side) and after (right side) implementation of the PRP.
0<br />
2<br />
4<br />
6<br />
8<br />
64 Danube Pollution Reduction Programme<br />
kt/a<br />
kt/a<br />
0.9<br />
22<br />
2.4<br />
33<br />
3.6<br />
37<br />
4.0<br />
100<br />
10.9<br />
8<br />
km 803<br />
M990603h<br />
km 803<br />
GERMANY AUSTRIA CZECH_RE SLOVAKIA<br />
HUNGARY SLOVENIA CROATIA YUGOSLAV<br />
BOSNIA_H BULGARIA ROMANIA MOLDOVA<br />
UKRAINE<br />
SL-CR border<br />
SL-CR border<br />
Baseline<br />
PRP implementation<br />
CR to CR/BH<br />
CR to CR/BH<br />
CR/BH to BH/YU<br />
CR/BH to BH/YU<br />
BH/YU to YU<br />
BH/YU to YU<br />
outflow<br />
outflow<br />
10<br />
12<br />
14<br />
16<br />
10<br />
12<br />
14<br />
16<br />
2<br />
4<br />
6<br />
8<br />
%<br />
%<br />
2.2<br />
15<br />
2.7<br />
18<br />
4.9<br />
32<br />
5.2<br />
35<br />
15.0 100<br />
Figure 10<br />
Figure 8.10.<br />
In-stream phosphorus load profiles per country for the Sava river,<br />
before (left side) and after (right side) implementation of the PRP.
Danube Water Quality Model Simulations 65<br />
8.4. Comparative Effect of Emissions Reductions and Wetlands<br />
Restoration<br />
600<br />
M990604a<br />
kt/a<br />
500<br />
PRP Implemented<br />
W etlands Restored<br />
Yearly Baseline Pollution<br />
51.5<br />
27.6<br />
400<br />
300<br />
200<br />
487.3<br />
100<br />
0<br />
source<br />
Figure 11<br />
Inn<br />
D-A border<br />
Morava/A-SK-H border<br />
H to C R/YU<br />
Drava<br />
Tisa<br />
Sava<br />
YU-RO border<br />
Iron Gates<br />
YU-BG border<br />
BG-RO border<br />
outflow<br />
50<br />
45<br />
40<br />
35<br />
PRP Implemented<br />
Wetlands Restored<br />
Yearly Baseline Pollution<br />
kt/a<br />
10.84<br />
2.48<br />
30<br />
25<br />
20<br />
15<br />
35.44<br />
10<br />
5<br />
0<br />
source<br />
Inn<br />
D-A border<br />
Morava/A-SK-H border<br />
H to CR/YU<br />
Drava<br />
Tisa<br />
Sava<br />
YU-RO border<br />
Iron Gates<br />
YU-BG border<br />
BG-RO border<br />
outflow<br />
Figure 12<br />
Figure 8.11. In-stream nitrogen load profile for the Danube river, before and after implementation of<br />
the PRP, with the additional effect of the restoration of 17 wetlands (top).<br />
Figure 8.12. In-stream phosphorus load profile for the Danube river, before and after implementation<br />
of the PRP, with the additional effect of the restoration of 17 wetlands (bottom).
66 Danube Pollution Reduction Programme<br />
30<br />
25<br />
M990604b<br />
PRP Implemented<br />
W etlands Restored<br />
Yearly Baseline Pollution<br />
kt/a<br />
1.6<br />
3.1<br />
20<br />
15<br />
10<br />
25.1<br />
5<br />
0<br />
A-SL border<br />
Figure 13<br />
SL-CR border<br />
CR to H/CR, Mura<br />
H/CR to CR<br />
outflow<br />
3.0<br />
2.5<br />
2.0<br />
PRP Implemented<br />
W etlands Restored<br />
Yearly Baseline Pollution<br />
kt/a<br />
0.40<br />
0.29<br />
1.5<br />
1.0<br />
2.07<br />
0.5<br />
0.0<br />
A-SL border<br />
SL-CR border<br />
CR to H/C R, M ura<br />
H/CR to CR<br />
outflow<br />
Figure 14<br />
Figure 8.13. In-stream nitrogen load profile for the Drava river, before and after implementation of<br />
the PRP, with the additional effect of the restoration of 17 wetlands (top).<br />
Figure 8.14. In-stream phosphorus load profile for the Drava river, before and after implementation of<br />
the PRP, with the additional effect of the restoration of 17 wetlands (bottom).
Danube Water Quality Model Simulations 67<br />
90<br />
M990604c<br />
kt/a<br />
80<br />
70<br />
PRP Implemented<br />
W etlands Restored<br />
Yearly Baseline Pollution<br />
1.5<br />
2.9<br />
60<br />
50<br />
40<br />
30<br />
77.8<br />
20<br />
10<br />
0<br />
km 966<br />
Figure 15<br />
UK-H border<br />
Som es<br />
Bodrog<br />
Slana<br />
Zagyva<br />
Cris<br />
Mures<br />
H-YU border<br />
outflow<br />
10<br />
9<br />
8<br />
PRP Implemented<br />
W etlands Restored<br />
Yearly Baseline Pollution<br />
kt/a<br />
0.54<br />
0.47<br />
7<br />
6<br />
5<br />
4<br />
3<br />
8.91<br />
2<br />
1<br />
0<br />
km 966<br />
UK-H border<br />
Somes<br />
Bodrog<br />
Slana<br />
Zagyva<br />
Cris<br />
Mures<br />
H-YU border<br />
outflow<br />
Figure 16<br />
Figure 8.15. In-stream nitrogen load profile for the Tisa river, before and after implementation of the<br />
PRP, with the additional effect of the restoration of 17 wetlands (top).<br />
Figure 8.16. In-stream phosphorus load profile for the Tisa river, before and after implementation of<br />
the PRP, with the additional effect of the restoration of 17 wetlands (bottom).
68 Danube Pollution Reduction Programme<br />
140<br />
M990604d<br />
kt/a<br />
120<br />
100<br />
PRP Implemented<br />
Wetlands Restored<br />
Yearly Baseline Pollution<br />
17.4<br />
2.5<br />
80<br />
60<br />
40<br />
110.5<br />
20<br />
0<br />
km 803<br />
Figure 17<br />
SL-CR border<br />
CR to CR/BH<br />
CR/BH to BH/YU<br />
BH/YU to YU<br />
outflow<br />
16<br />
14<br />
12<br />
10<br />
PRP Implemented<br />
Wetlands Restored<br />
Yearly Baseline Pollution<br />
kt/a<br />
3.73<br />
0.37<br />
8<br />
6<br />
10.86<br />
4<br />
2<br />
0<br />
km 803<br />
SL-CR border<br />
CR to CR/BH<br />
CR/BH to BH/YU<br />
BH/YU to YU<br />
outflow<br />
Figure 18<br />
Figure 8.17. In-stream nitrogen load profile for the Sava river, before and after implementation of the<br />
PRP, with the additional effect of the restoration of 17 wetlands (top).<br />
Figure 8.18. In-stream phosphorus load profile for the Sava river, before and after implementation of<br />
the PRP, with the additional effect of the restoration of 17 wetlands (bottom).
0<br />
5<br />
Danube Water Quality Model Simulations 69<br />
8.5. Computed Longitudinal In-Stream Load Profiles, Subdivided per<br />
Sector<br />
Baseline Others N (kt/a)<br />
Baseline Agriculture N (kt/a)<br />
Baseline Industry N (kt/a)<br />
Baseline Population N (kt/a)<br />
600<br />
500<br />
400<br />
300<br />
200<br />
100<br />
kt/a<br />
25<br />
47<br />
23<br />
100<br />
kt/a<br />
122<br />
25<br />
230<br />
111<br />
487<br />
5<br />
source M990604e<br />
source<br />
Inn<br />
D-A border<br />
Inn<br />
D-A border<br />
Baseline<br />
PRP Implementation<br />
Morava/A-SK-H border<br />
Morava/A-SK-H border<br />
H to CR/YU<br />
Drava<br />
H to CR/YU<br />
Drava<br />
Tisa<br />
Sava<br />
Tisa<br />
Sava<br />
YU-RO border<br />
Iron Gates<br />
YU-BG border<br />
YU-RO border<br />
Iron Gates<br />
YU-BG border<br />
BG-RO border<br />
BG-RO border<br />
outflow<br />
100<br />
200<br />
300<br />
400<br />
500<br />
600<br />
outflow<br />
158<br />
30<br />
262<br />
117<br />
566<br />
%<br />
%<br />
28<br />
46<br />
21<br />
100<br />
Figure 19<br />
Figure 8.19.<br />
In-stream nitrogen load profile for the Danube river, before (left<br />
side) and after (right side) implementation of the PRP, subdivided<br />
over the sectors population, industry, agriculture and others.
0<br />
6<br />
8<br />
70 Danube Pollution Reduction Programme<br />
Baseline Others N (kt/a)<br />
Baseline Agriculture N (kt/a)<br />
Baseline Industry N (kt/a)<br />
Baseline Population N (kt/a)<br />
kt/a<br />
34<br />
54<br />
100<br />
kt/a<br />
12.2<br />
1.2<br />
19.2<br />
2.8<br />
35.4<br />
3<br />
8<br />
source M990604f<br />
source<br />
Inn<br />
D-A border<br />
Inn<br />
D-A border<br />
Baseline<br />
PRP Implementation<br />
Morava/A-SK-H border<br />
Morava/A-SK-H border<br />
H to CR/YU<br />
Drava<br />
H to CR/YU<br />
Drava<br />
Tisa<br />
Sava<br />
Tisa<br />
Sava<br />
YU-RO border<br />
Iron Gates<br />
YU-BG border<br />
YU-RO border<br />
Iron Gates<br />
YU-BG border<br />
BG-RO border<br />
BG-RO border<br />
outflow<br />
outflow<br />
10<br />
20<br />
30<br />
40<br />
50<br />
10<br />
20<br />
30<br />
40<br />
50<br />
20.2<br />
3.9<br />
21.6<br />
3.0<br />
48.8<br />
%<br />
%<br />
41<br />
44<br />
100<br />
Figure 20<br />
Figure 8.20.<br />
In-stream phosphorus load profile for the Danube river, before (left<br />
side) and after (right side) implementation of the PRP, subdivided<br />
over the sectors population, industry, agriculture and others.
Danube Water Quality Model Simulations 71<br />
300<br />
250<br />
Baseline Population N (kt/a)<br />
200<br />
PRP-Implementation Population N (kt/a)<br />
N (kt/a)<br />
150<br />
100<br />
50<br />
0<br />
source<br />
Inn<br />
D-A border<br />
Morava/A-SK-H border<br />
H to CR/YU<br />
Drava<br />
Tisa<br />
Sava<br />
YU-RO border<br />
Iron Gates<br />
YU-BG border<br />
BG-RO border<br />
outflow<br />
300<br />
250<br />
Baseline Industry N (kt/a)<br />
200<br />
PRP-Implementation Industry N (kt/a)<br />
N (kt/a)<br />
150<br />
100<br />
50<br />
0<br />
source<br />
Inn<br />
D-A border<br />
Morava/A-SK-H border<br />
H to CR/YU<br />
Drava<br />
Tisa<br />
Sava<br />
YU-RO border<br />
Iron Gates<br />
YU-BG border<br />
BG-RO border<br />
outflow<br />
300<br />
250<br />
Baseline Agriculture N (kt/a)<br />
200<br />
PRP-Implementation Agriculture N (kt/a)<br />
N (kt/a)<br />
150<br />
100<br />
50<br />
0<br />
source<br />
Inn<br />
D-A border<br />
Morava/A-SK-H border<br />
H to CR/YU<br />
Drava<br />
Tisa<br />
Sava<br />
YU-RO border<br />
Iron Gates<br />
YU-BG border<br />
BG-RO border<br />
outflow<br />
Figure 8.21. In-stream nitrogen load profiles for the Danube river, before and after<br />
implementation of the PRP, for the sectors population, industry and agriculture.
72 Danube Pollution Reduction Programme<br />
25<br />
20<br />
Baseline Population P (kt/a)<br />
PRP-Implementation Population P (kt/a)<br />
15<br />
10<br />
5<br />
0<br />
source<br />
Inn<br />
D-A border<br />
Morava/A-SK-H border<br />
H to CR/YU<br />
Drava<br />
Tisa<br />
Sava<br />
YU-RO border<br />
Iron Gates<br />
YU-BG border<br />
BG-RO border<br />
outflow<br />
P (kt/a)<br />
25<br />
20<br />
Baseline Industry P (kt/a)<br />
PRP-Implementation Industry P (kt/a)<br />
15<br />
10<br />
5<br />
0<br />
source<br />
Inn<br />
D-A border<br />
Morava/A-SK-H border<br />
H to CR/YU<br />
Drava<br />
Tisa<br />
Sava<br />
YU-RO border<br />
Iron Gates<br />
YU-BG border<br />
BG-RO border<br />
outflow<br />
P (kt/a)<br />
25<br />
20<br />
Baseline Agriculture P (kt/a)<br />
PRP-Implementation Agriculture P (kt/a)<br />
15<br />
10<br />
5<br />
0<br />
source<br />
Inn<br />
D-A border<br />
Morava/A-SK-H border<br />
H to CR/YU<br />
Drava<br />
Tisa<br />
Sava<br />
YU-RO border<br />
Iron Gates<br />
YU-BG border<br />
BG-RO border<br />
outflow<br />
P (kt/a)<br />
Figure 8.22. In-stream phosphorus load profiles for the Danube river, before and after implementation<br />
of the PRP, for the sectors population, industry and agriculture.
Annexes