- Page 1: Tracking Adaptation Pathways and Id
- Page 5: Naveen P Singh Cynthia Bantilan Byj
- Page 9 and 10: Table of Contents Acknowledgements
- Page 11 and 12: List of Tables Table 1. Summary com
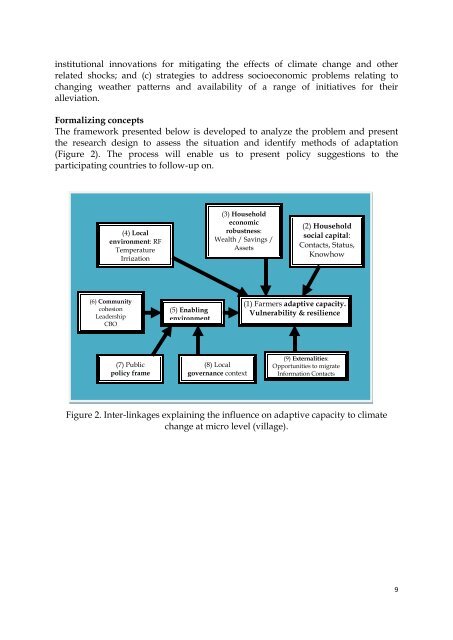
- Page 13: List of Figures Figure 1. Conceptua
- Page 17 and 18: II. Executive Summary The recent 4t
- Page 19 and 20: years. Regional-level analysis also
- Page 21 and 22: Farmers feel that even in the lowla
- Page 23 and 24: depending on the water availability
- Page 25 and 26: y pumping water from a nearby river
- Page 27 and 28: is practiced as an effective adapta
- Page 29 and 30: management technologies are some of
- Page 31 and 32: What aspects of their own agricultu
- Page 33: List of Abbreviations ADB Asian Dev
- Page 36 and 37: events over a certain period of tim
- Page 38 and 39: xxiv
- Page 40 and 41: The water resource sector due to ch
- Page 42 and 43: Climate Change: Riding through Pove
- Page 44 and 45: Table 3. Employment Trend in Agricu
- Page 48 and 49: The climatic conditions continue to
- Page 50 and 51: Table 4:- Matrix of climate resilie
- Page 52 and 53: forward a local agenda that ensures
- Page 54 and 55: are to be diverted to seasonal rive
- Page 56 and 57: 6 Understand the social dynamics of
- Page 58 and 59: changes were recalled for recording
- Page 60 and 61: Table 7. Data source and reference
- Page 62 and 63: temperature and, low precipitation
- Page 64 and 65: Qualitative Assessments To capture
- Page 66 and 67: Table 8. Indicators used to compute
- Page 68 and 69: Future impact of climate change on
- Page 70 and 71: low in the state of Andhra Pradesh
- Page 72 and 73: Table 9. Trends in general climatic
- Page 74 and 75: showed South Asia Southeast Asia Cl
- Page 76 and 77: (0.02 o C/year) (0.02 o C/year) Met
- Page 78 and 79: Table 9b. Climatic trends in the ta
- Page 80 and 81: Table 9c. Climatic trends in the ta
- Page 82 and 83: ainfall. The variation of rainfall
- Page 84 and 85: trend but Tmin had no significant t
- Page 86 and 87: China No long-term significant tren
- Page 88 and 89: Climate change projection - From ba
- Page 90 and 91: information for various structural
- Page 92 and 93: Rainfall (mm) Rainfall (mm) Rainfal
- Page 94 and 95: Targeting vulnerable regions to cli
- Page 96 and 97:
and analysis of decadal trend. Thes
- Page 98 and 99:
Vulnerability to climate change Tab
- Page 100 and 101:
Bangladesh Of the six zones to whic
- Page 102 and 103:
and MRD) are most vulnerable compar
- Page 104 and 105:
Farmer’s perception on agricultur
- Page 106 and 107:
Table 13. List of study villages in
- Page 108 and 109:
districts. The major soil type of A
- Page 110 and 111:
Sri Lanka Three districts namely, P
- Page 112 and 113:
Bangladesh For the present study Kh
- Page 114 and 115:
Thailand Chok Chai District in Nakh
- Page 116 and 117:
Viet Nam In Viet Nam, agricultural
- Page 118 and 119:
Table 13f. General characteristics
- Page 120 and 121:
Table 14a. Cropping Pattern in sele
- Page 122 and 123:
In Mahagalwewa village, over the pe
- Page 124 and 125:
Crops Galahitiyagama Mahagalwewa Ga
- Page 126 and 127:
cereal production in the village. E
- Page 128 and 129:
China In Lucheba village there used
- Page 130 and 131:
Livestock developments in the study
- Page 132 and 133:
Sri Lanka Dairy farming is a better
- Page 134 and 135:
Note: NC=No Change, MI=Major Increa
- Page 136 and 137:
Table 16a. Dynamics of input market
- Page 138 and 139:
Table 16c. Trends in accessibility
- Page 140 and 141:
A typical village market in Shirapu
- Page 142 and 143:
Sri Lanka In Galahitiyagama, during
- Page 144 and 145:
Table 17c. Accessibility of output
- Page 146 and 147:
Pulse cultivation ranged from 10% t
- Page 148 and 149:
Table18c. Farmer’s perception and
- Page 150 and 151:
China China is different from the r
- Page 152 and 153:
increased from just 10% in seventie
- Page 154 and 155:
Thailand Farmers have responded to
- Page 156 and 157:
Vegetables+herbs - - - - - 12.0 10.
- Page 158 and 159:
income from the share of livestock
- Page 160 and 161:
Table 20a. Farmer’s perception on
- Page 162 and 163:
Kalman Mulching was not practiced d
- Page 164 and 165:
Thailand Farmers in upland villages
- Page 166 and 167:
Farmer’s perception of climate va
- Page 168 and 169:
Sri Lanka Farmers perceived that th
- Page 170 and 171:
Thailand The actual annual rainfall
- Page 172 and 173:
Viet Nam Data is available from onl
- Page 174 and 175:
Dynamics of sources and availabilit
- Page 176 and 177:
irrigated area catered to by canals
- Page 178 and 179:
Sri Lanka Most of the villages in t
- Page 180 and 181:
Table 22d. Trends in available wate
- Page 182 and 183:
villages of Kanzara and Kinkheda in
- Page 184 and 185:
complained that the large-scale and
- Page 186 and 187:
strategies being integrated through
- Page 188 and 189:
(KVKs), which are the agricultural
- Page 190 and 191:
Predicting future crop needs - resu
- Page 192 and 193:
objective information of greater ac
- Page 194 and 195:
Analyzing economic impact of climat
- Page 196 and 197:
Further, it can be deduced that mos
- Page 198 and 199:
Adaptation measures - how the farme
- Page 200 and 201:
Table 29:- Summarized information o
- Page 202 and 203:
India Adaptation measures exercised
- Page 204 and 205:
Kinkheda ‣ Adaptation of improved
- Page 206 and 207:
Flood prone villages Nishiagunj Vil
- Page 208 and 209:
China ‣ Diversifying into part ti
- Page 210 and 211:
Constraints to adaptation as percei
- Page 212 and 213:
Lack of agriculture extension servi
- Page 214 and 215:
Infrastructural barriers Rural road
- Page 216 and 217:
Bangladesh Market access for the ou
- Page 218 and 219:
China Development and introduction
- Page 220 and 221:
Table 32. National Initiatives on c
- Page 222 and 223:
can be to encourage farmers by givi
- Page 224 and 225:
options for efficient use of resour
- Page 226 and 227:
to climate change. There have been
- Page 228 and 229:
Managing climate risks effectively
- Page 230 and 231:
Summary and Conclusions The primary
- Page 232 and 233:
Poor and marginal farmers get into
- Page 234 and 235:
References Adaptation Knowledge Pla
- Page 236 and 237:
EM-DAT. 2011. Emergency events data
- Page 238 and 239:
Jones, J.W.G., Hoogenboom, G., Port
- Page 240 and 241:
Parthasarathy, D. 2009. Social and
- Page 242 and 243:
partnership to link research and ac
- Page 244 and 245:
temperature trend Length of growing
- Page 246 and 247:
Sources: BVJ Gandhi, 2008 208
- Page 248 and 249:
Annexure 3. Social and resource map
- Page 250 and 251:
Social map of the Bata-Atha Resourc
- Page 252 and 253:
Social and resource map of Kud Sawa
- Page 254 and 255:
Social and resource map of Tha Taen
- Page 256 and 257:
Social map of selected village in P
- Page 258 and 259:
220