Geophysical Institute of the ASCR
Geophysical Institute of the ASCR
Geophysical Institute of the ASCR

You also want an ePaper? Increase the reach of your titles
YUMPU automatically turns print PDFs into web optimized ePapers that Google loves.
Geomagnetic forcing on regional and global temperatures<br />
We show that inter-annual variations <strong>of</strong> temperature in Europe, North America and over <strong>the</strong> globe at<br />
a time <strong>of</strong> faster warming <strong>of</strong> <strong>the</strong> earth’s surface over <strong>the</strong> past thirty years are influenced by<br />
geomagnetic activity indicating <strong>the</strong> solar wind (Bucha, 2004, 2005). The obtained results help to<br />
distinguish between <strong>the</strong> response to geomagnetic and anthropogenic forcing and contribute to useful<br />
climate forecasts in Europe and North America up to six months in advance.<br />
High correlation coefficients that were found between geomagnetic activity and meteorological<br />
parameters are important for <strong>the</strong> detection <strong>of</strong> causes influencing inter-annual and intra-seasonal<br />
variations <strong>of</strong> regional and global temperatures in <strong>the</strong> past several decades (Bucha and Bucha, 1998,<br />
2002). The positive phase <strong>of</strong> NAO (North Atlantic Oscillation) prevailed from 1973 to 1994. At that<br />
time also geomagnetic activity was highest over <strong>the</strong> past 135 years. We found that <strong>the</strong> NAO as well as<br />
winter temperatures in Europe and in <strong>the</strong> U.S.A. are positively correlated with geomagnetic activity.<br />
Summer temperatures in Europe are also positively correlated (correlation coefficient equals 0.78)<br />
while temperatures in <strong>the</strong> USA are negatively correlated (-0.77) with geomagnetic activity (Bucha,<br />
2005).<br />
aa<br />
50<br />
30<br />
10 64<br />
T(°C)<br />
60<br />
56<br />
a<br />
b<br />
aa<br />
T(°C)<br />
120<br />
100<br />
80<br />
60 65<br />
40<br />
108<br />
104<br />
100 0.4<br />
∆T(°C)<br />
60<br />
T(°C)<br />
55<br />
0.2<br />
0.0<br />
-0.2<br />
c<br />
d<br />
e<br />
f<br />
1970 1980 1990 2000<br />
years<br />
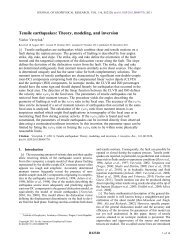
Fig. 38. Time series <strong>of</strong> (a) geomagnetic activity (aa index) for February, (b) surface air temperature in Europe<br />
for <strong>the</strong> sum <strong>of</strong> June-August, (c) geomagnetic activity for <strong>the</strong> sum <strong>of</strong> December – February, (d) surface air<br />
temperature in <strong>the</strong> U.S.A. for <strong>the</strong> sum <strong>of</strong> May – July and (e) for <strong>the</strong> sum <strong>of</strong> May – September, (f) annual<br />
anomalies <strong>of</strong> global temperature.<br />
Successful seasonal forecasts up to six months in advance for Europe and <strong>the</strong> USA could become<br />
a good evidence <strong>of</strong> <strong>the</strong> validity <strong>of</strong> evolutionary processes in <strong>the</strong> atmosphere influenced by<br />
geomagnetic forcing. Preliminary predictions based on <strong>the</strong> positive correlation between geomagnetic<br />
activity (Fig. 38, curve a) and summer temperature in Europe indicate that low geomagnetic activity<br />
in February 2005 influenced <strong>the</strong> temperature in central Europe which was below normal in summer<br />
2005 with probability <strong>of</strong> 70 – 80% (curve b). Vice versa, negative correlation between geomagnetic<br />
activity in winter (curve c) and summer temperature in <strong>the</strong> USA (curve d) shows that <strong>the</strong> US<br />
temperature in summer 2005 probably was higher than was in 2004.<br />
57