Vector Space Semantic Parsing: A Framework for Compositional ...
Vector Space Semantic Parsing: A Framework for Compositional ...
Vector Space Semantic Parsing: A Framework for Compositional ...

Create successful ePaper yourself
Turn your PDF publications into a flip-book with our unique Google optimized e-Paper software.
3.1 Learning<br />
The error on a parse tree is computed as the sum<br />
of classification errors of all subparses. Hence, the<br />
learning is to minimise the objective<br />
J(θ) = 1 N<br />
∑<br />
T<br />
∑<br />
(y(θ),t)∈T<br />
1<br />
2 (t − y(θ))2 + λ‖θ‖ 2<br />
(3)<br />
where θ are the model parameters, N is the number<br />
of trees, λ is a regularisation hyperparameter,<br />
T is a parse tree, y(θ) is given by Equation 2, and<br />
t is the class of the corresponding subparse (t = 1<br />
means correct). The gradient ∂J<br />
∂θ<br />
is computed efficiently<br />
thanks to backpropagation through the<br />
structure (Goller and Kuchler, 1996). L-BFGS<br />
(Liu and Nocedal, 1989) is used to minimise the<br />
objective function.<br />
3.2 Experiments<br />
We implemented our classifier in Torch7 3 (Collobert<br />
et al., 2011a), which is a powerful Matlablike<br />
environment <strong>for</strong> machine learning. In order to<br />
save time, we only trained the classifier on 10-best<br />
parses of WSJ02-21. The training phase took six<br />
days on a computer with 16 800MHz CPU-cores<br />
and 256GB RAM. The word embeddings given by<br />
Collobert et al. (2011b) 4 were used as L in Equation<br />
1. Note that these embeddings, which are the<br />
result of training a language model neural network<br />
on the English Wikipedia and Reuters, have been<br />
shown to capture many interesting semantic similarities<br />
between words.<br />
We tested the classifier on the development<br />
set WSJ22, which contains 1, 700 sentences, and<br />
measured the per<strong>for</strong>mance in positive rate and<br />
negative rate<br />
pos-rate =<br />
neg-rate =<br />
#true pos<br />
#true pos + #false neg<br />
#true neg<br />
#true neg + #false pos<br />
The positive/negative rate tells us the rate at which<br />
positive/negative examples are correctly labelled<br />
positive/negative. In order to achieve high per<strong>for</strong>mance<br />
in the reranking task, the classifier must<br />
have a high positive rate as well as a high negative<br />
rate. In addition, percentage of positive examples<br />
is also interesting because it shows the unbalancedness<br />
of the data. Because the accuracy is not<br />
3 http://www.torch.ch/<br />
4 http://ronan.collobert.com/senna/<br />
a reliable measurement when the dataset is highly<br />
unbalanced, we do not show it here. Table 1, Figure<br />
5, and Figure 6 show the classification results.<br />
pos-rate (%) neg-rate (%) %-Pos<br />
gold-std 75.31 - 1<br />
1-best 90.58 64.05 71.61<br />
10-best 93.68 71.24 61.32<br />
50-best 95.00 73.76 56.43<br />
Table 1: Classification results on the WSJ22 and<br />
the k-best lists.<br />
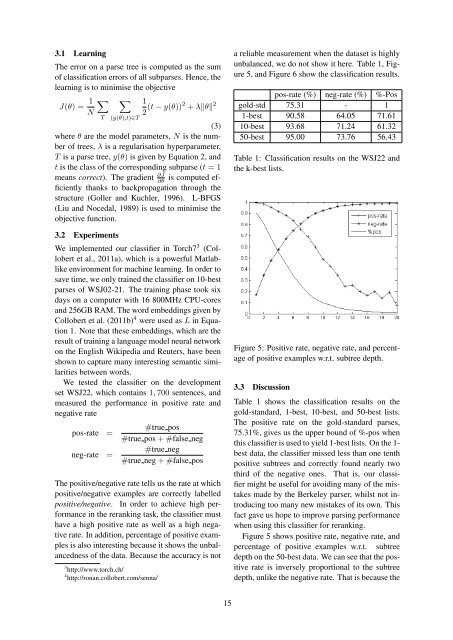
Figure 5: Positive rate, negative rate, and percentage<br />
of positive examples w.r.t. subtree depth.<br />
3.3 Discussion<br />
Table 1 shows the classification results on the<br />
gold-standard, 1-best, 10-best, and 50-best lists.<br />
The positive rate on the gold-standard parses,<br />
75.31%, gives us the upper bound of %-pos when<br />
this classifier is used to yield 1-best lists. On the 1-<br />
best data, the classifier missed less than one tenth<br />
positive subtrees and correctly found nearly two<br />
third of the negative ones. That is, our classifier<br />
might be useful <strong>for</strong> avoiding many of the mistakes<br />
made by the Berkeley parser, whilst not introducing<br />
too many new mistakes of its own. This<br />
fact gave us hope to improve parsing per<strong>for</strong>mance<br />
when using this classifier <strong>for</strong> reranking.<br />
Figure 5 shows positive rate, negative rate, and<br />
percentage of positive examples w.r.t. subtree<br />
depth on the 50-best data. We can see that the positive<br />
rate is inversely proportional to the subtree<br />
depth, unlike the negative rate. That is because the<br />
15