Estimation of Distribution Transformer Losses in Feeder Circuit - ijcee
Estimation of Distribution Transformer Losses in Feeder Circuit - ijcee
Estimation of Distribution Transformer Losses in Feeder Circuit - ijcee

You also want an ePaper? Increase the reach of your titles
YUMPU automatically turns print PDFs into web optimized ePapers that Google loves.
International Journal <strong>of</strong> Computer and Electrical Eng<strong>in</strong>eer<strong>in</strong>g, Vol. 3, No. 5, October 2011<br />
<strong>Estimation</strong> <strong>of</strong> <strong>Distribution</strong> <strong>Transformer</strong> <strong>Losses</strong> <strong>in</strong> <strong>Feeder</strong><br />
<strong>Circuit</strong><br />
V. A. Kulkarni and P. K Katti<br />
Abstract—<strong>Losses</strong> <strong>of</strong> distribution transformers (DT) <strong>in</strong> a<br />
distribution system (DS) depend on ma<strong>in</strong>ly load. Actual<br />
measurement <strong>of</strong> these losses is <strong>in</strong> substation (SS) feeder circuit<br />
is not easy due to many <strong>in</strong>conveniences like difficulty <strong>in</strong><br />
<strong>in</strong>stallation <strong>of</strong> meters, unfavourable locations and conditions.<br />
But as the DT losses are sizeable they need to be considered for<br />
overall loss calculations. In this paper, an approach is<br />
developed to estimate the DT losses <strong>in</strong> a feeder circuit. <strong>Losses</strong><br />
<strong>of</strong> <strong>in</strong>dividual DTs are calculated and summed up to give the<br />
losses due to DT circuit. A sample case <strong>of</strong> a large power<br />
system is considered. The losses are calculated by the said<br />
approach. The overall DT circuit losses are 8.57% <strong>of</strong> the total<br />
import.<br />
Index Terms—<strong>Feeder</strong> circuit, Loss calculation, Loss factor,<br />
<strong>Transformer</strong> losses.<br />
I. INTRODUCTION<br />
Energy losses <strong>of</strong> a power system are calculated by two<br />
methods:<br />
i. Actual read<strong>in</strong>gs and ii. Analytical calculations.<br />
A large DS comprises <strong>of</strong> feeder l<strong>in</strong>es, DTs and end users.<br />
Generally the loss measurement is through a simple<br />
empirical formula given by <strong>Losses</strong> equal to difference<br />
between <strong>in</strong>put and output <strong>in</strong> units (kWh). However, if it is<br />
required to estimate the losses <strong>of</strong> <strong>in</strong>dividual sections like<br />
only feeder or transformer circuits, it is practically difficult.<br />
For this purpose, it is necessary to <strong>in</strong>stall the meters <strong>in</strong> the<br />
<strong>in</strong>dividual circuits. Because <strong>of</strong> topography , vast area and<br />
<strong>in</strong>conveniences <strong>in</strong> <strong>in</strong>stall<strong>in</strong>g and not<strong>in</strong>g down, the actual<br />
read<strong>in</strong>gs method is practically difficult.<br />
The analytical method may be approximate. Sometimes<br />
the results may differ too much with that <strong>of</strong> the practical<br />
values giv<strong>in</strong>g rise to big gap <strong>in</strong> the two estimations.<br />
Therefore, the best method is to comb<strong>in</strong>e these two methods<br />
and estimate the best possible losses near to accuracy[8].<br />
In this paper, a method that <strong>in</strong>cludes the load variability<br />
and correspond<strong>in</strong>g actual read<strong>in</strong>gs are considered. The<br />
period is one month.<br />
The two methods are used to estimate the losses <strong>in</strong> the<br />
transformer circuit <strong>in</strong> a feeder and a new approach is<br />
presented.<br />
The organization <strong>of</strong> this paper is as follows:<br />
Firstly, the power system SS, its components like feeder<br />
and DT are discussed. Various losses <strong>in</strong> DTs are discussed.<br />
Manuscript received March 15, 2011; revised September 30, 2011.<br />
V. A. Kulkarni Work<strong>in</strong>g as faculty member <strong>in</strong> Dept. <strong>of</strong> Electrical<br />
Eng<strong>in</strong>eer<strong>in</strong>g at Padmashree Dr. D.Y. Patil Institute <strong>of</strong> Engg and technology,<br />
Pune, India (email: vjykulkarni58@yahoo.com).<br />
P. K Katti Work<strong>in</strong>g as Head <strong>of</strong> Dept. <strong>of</strong> Electrical Eng<strong>in</strong>eer<strong>in</strong>g at Dr.<br />
Babasaheb Ambedkar. Technological University, Lonere, India. (email:<br />
pk_katti2003@yahoo.com)<br />
Next, approach for estimat<strong>in</strong>g the losses <strong>of</strong> DT circuit is<br />
presented us<strong>in</strong>g actual read<strong>in</strong>gs available and analytical<br />
methods.<br />
A large power system is considered as sample case study.<br />
The load pr<strong>of</strong>ile, based on the consumer’s data, is described.<br />
The approach is implemented for the loss calculations.<br />
Results and conclusions are drawn on the basis <strong>of</strong><br />
calculations.<br />
II. SUBSTATION (SS) FEEDER CIRCUIT<br />
Energy is supplied from the substation to the end users<br />
(consumers) by feeder circuit. It can be divided <strong>in</strong>to two<br />
parts as :<br />
i. HT feeder l<strong>in</strong>e which a conductor overhead or<br />
underground (ACSR or HT cable) and<br />
ii. Ttransformer (DTs).<br />
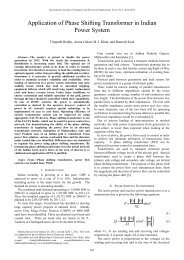
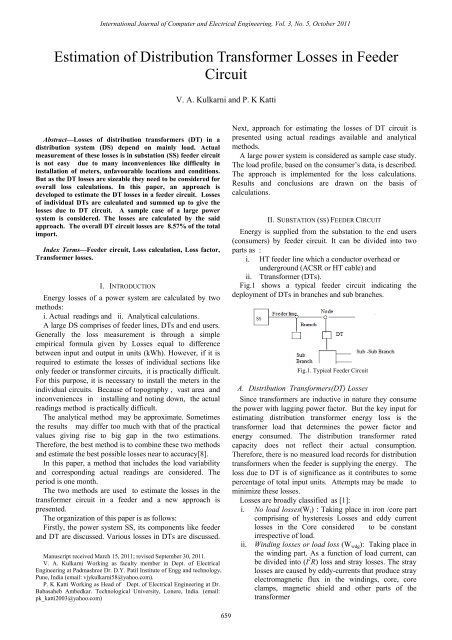
Fig.1 shows a typical feeder circuit <strong>in</strong>dicat<strong>in</strong>g the<br />
deployment <strong>of</strong> DTs <strong>in</strong> branches and sub branches.<br />
Fig.1. Typical <strong>Feeder</strong> <strong>Circuit</strong><br />
A. <strong>Distribution</strong> <strong>Transformer</strong>s(DT) <strong>Losses</strong><br />
S<strong>in</strong>ce transformers are <strong>in</strong>ductive <strong>in</strong> nature they consume<br />
the power with lagg<strong>in</strong>g power factor. But the key <strong>in</strong>put for<br />
estimat<strong>in</strong>g distribution transformer energy loss is the<br />
transformer load that determ<strong>in</strong>es the power factor and<br />
energy consumed. The distribution transformer rated<br />
capacity does not reflect their actual consumption.<br />
Therefore, there is no measured load records for distribution<br />
transformers when the feeder is supply<strong>in</strong>g the energy. The<br />
loss due to DT is <strong>of</strong> significance as it contributes to some<br />
percentage <strong>of</strong> total <strong>in</strong>put units. Attempts may be made to<br />
m<strong>in</strong>imize these losses.<br />
<strong>Losses</strong> are broadly classified as [1]:<br />
i. No load losses(W i ) : Tak<strong>in</strong>g place <strong>in</strong> iron /core part<br />
compris<strong>in</strong>g <strong>of</strong> hysteresis <strong>Losses</strong> and eddy current<br />
losses <strong>in</strong> the Core considered to be constant<br />
irrespective <strong>of</strong> load.<br />
ii. W<strong>in</strong>d<strong>in</strong>g losses or load loss (W wdg ): Tak<strong>in</strong>g place <strong>in</strong><br />
the w<strong>in</strong>d<strong>in</strong>g part. As a function <strong>of</strong> load current, can<br />
be divided <strong>in</strong>to (I 2 R) loss and stray losses. The stray<br />
losses are caused by eddy-currents that produce stray<br />
electromagnetic flux <strong>in</strong> the w<strong>in</strong>d<strong>in</strong>gs, core, core<br />
clamps, magnetic shield and other parts <strong>of</strong> the<br />
transformer<br />
659
International Journal <strong>of</strong> Computer and Electrical Eng<strong>in</strong>eer<strong>in</strong>g, Vol. 3, No. 5, October 2011<br />
iii. Other losses (W other ): dielectric loss ( due to<br />
electrostatic reversal <strong>in</strong> <strong>in</strong>sulation and circulat<strong>in</strong>g<br />
currents), load unbalance, oil leakage, loss <strong>of</strong> life,<br />
lack <strong>of</strong> ma<strong>in</strong>tenance, improper up keep <strong>of</strong><br />
distribution boxes, and jo<strong>in</strong>ts loose connections.<br />
Generally the value is less than 1% <strong>of</strong> total energy<br />
<strong>in</strong>put to the system.<br />
The most important losses are W i and W wdg . The other<br />
losses are described ma<strong>in</strong>ly to give a complete picture on<br />
losses.<br />
B. Loss Calculation Approach<br />
T = Period <strong>of</strong> consideration (day/month/year)<br />
kVA av = Average <strong>of</strong> recorded kVA from load curve = ∑<br />
i = 1<br />
kVA(i) / T<br />
Load factor (L d ) :It is the ratio <strong>of</strong> the average kVA<br />
consumed dur<strong>in</strong>g a designated period, to the maximum<br />
demand (MDkVA) occurr<strong>in</strong>g <strong>in</strong> that same period. A system<br />
load factor measures the degree <strong>of</strong> utilisation <strong>of</strong> the power<br />
supply system. By <strong>in</strong>creas<strong>in</strong>g the system load factor, the<br />
need to provide larger build<strong>in</strong>g transformer capacity may be<br />
avoided and the construction <strong>of</strong> new generat<strong>in</strong>g and<br />
transmission plant may be delayed or the magnitude <strong>of</strong> the<br />
<strong>in</strong>crease reduced. It is given by [7]<br />
Load factor = L d F = (kVA av ) / (MDkVA )<br />
Loss factor (L s F actr ): It describes the average electrical<br />
energy losses for electricity transmitted dur<strong>in</strong>g T. Ideally, to<br />
calculate the load losses it would be necessary to <strong>in</strong>tegrate<br />
the squares <strong>of</strong> all momentary ratios <strong>of</strong> actual load to the<br />
rated load. This is practically difficult. Therefore,<br />
summation <strong>of</strong> energy consumed <strong>in</strong> transformers is<br />
developed given by[2]-[5] :<br />
Loss factor =L s F actr = L d F 2 + (0.273) (L d F - K) 2<br />
where K = (kVA m<strong>in</strong>) / (kVA max ) (as per load curve)<br />
Now, W wdg = W c [(MD kVA) / (Tr kVA total ) ] 2 (L s F actr )<br />
where Wc = Full load Copper loss<br />
W i and W c can be obta<strong>in</strong>ed from the standard losses table<br />
available.<br />
Tr kVA total = Total rat<strong>in</strong>gs <strong>of</strong> all transformer kVA<br />
<strong>Transformer</strong> energy losses are given by TR Enloss = ( W i +<br />
W wdg + W other ) T<br />
Total <strong>Losses</strong> for all distribution transformers can then be<br />
calculated by summ<strong>in</strong>g the losses for <strong>in</strong>dividual transformer<br />
as below:<br />
n<br />
Total <strong>Transformer</strong> energy losses = ∑ TR Enloss (i)<br />
i =1<br />
III. SAMPLE CASE STUDY<br />
A large scale power system is considered <strong>in</strong> Pune, India.<br />
The Substation (SS) is located <strong>in</strong> dense <strong>in</strong>dustrial area<br />
compris<strong>in</strong>g Small Scale Industries (SSIs), medium and large<br />
<strong>in</strong>dustries. Work<strong>in</strong>g voltage <strong>of</strong> SS is 220kV /22kV hav<strong>in</strong>g<br />
44 feeders. 90% <strong>of</strong> the power is supplied to <strong>in</strong>dustries.<br />
<strong>Feeder</strong> No12 is selected for sample study. The period <strong>of</strong><br />
study was one month (for 30 days) <strong>in</strong> May 2010. The feeder<br />
is drawn through distance <strong>of</strong> 15 km. Figure 2 shows the<br />
load curve pr<strong>of</strong>ile the feeder circuit .<br />
Maximum consumption is 68541 units on sixth day,<br />
T<br />
m<strong>in</strong>imum is 58000 units on fifth day and average is 62533.3<br />
units. And maximum is 38000kVA on twentieth day,<br />
m<strong>in</strong>imum is 13876 kVA third day and average is 20562.8<br />
kVA.<br />
Standard transformer losses are shown <strong>in</strong> Table I.<br />
Fig.2(a). Load Curve Units (kWh)<br />
Fig.2(b). Load Curve kVA<br />
TABLE I: STANDARD TRANSFORMER LOSSES<br />
Sl. No. <strong>Transformer</strong> rat<strong>in</strong>g kVA W i (W) W c (W)<br />
1. 100 350 2500<br />
2. 200 570 3300<br />
3. 315 800 4600<br />
4. 500 1100 6500<br />
5. 1000 1800 11000<br />
6. 2000 3000 20000<br />
All are oil immersed transformers. Overall transformer<br />
capacity is 44205kVA. It is clear from the tableI that 2000<br />
kVA transformers have the major share <strong>of</strong> about half <strong>of</strong> the<br />
total capacity. These transformers are ma<strong>in</strong>ly used for SSIs<br />
which are LT consumers. Table II shows the details <strong>of</strong> the<br />
transformers <strong>in</strong> the feeder circuit and their share <strong>in</strong> the<br />
overall transformer capacity.<br />
TABLE II: DATAILS OF TRANFORMERS USED<br />
Sl.<br />
No<br />
<strong>Transformer</strong><br />
rat<strong>in</strong>g kVA<br />
Qty Total<br />
kVA<br />
Percentage (%) <strong>of</strong><br />
Overall Total capacity<br />
1. 100 15 1500 3.39<br />
2. 200 10 2000 4.52<br />
3. 315 07 2205 4.99<br />
4. 500 15 7500 16.97<br />
5. 1000 11 11000 24.88<br />
6. 2000 10 20000 45.24<br />
Total Overall 68 44205kVA<br />
Tr kVA total<br />
Out <strong>of</strong> 68 DTs, 50 (73.5%) are <strong>in</strong>stalled before 20 years.<br />
The total transformer capacity is loaded to 87% (38000 MD<br />
kVA <strong>of</strong> feeder). The power system is very large and the<br />
available manpower is proportionately less. Hence rout<strong>in</strong>e<br />
ma<strong>in</strong>tenance <strong>of</strong> transformers is carried out once <strong>in</strong> three<br />
years. Therefore, transformer losses are expected to be more.<br />
660
International Journal <strong>of</strong> Computer and Electrical Eng<strong>in</strong>eer<strong>in</strong>g, Vol. 3, No. 5, October 2011<br />
All the DTs are essentially located near the load centers.<br />
The cables drawn to the loads are not more than 25 mts.,<br />
reduc<strong>in</strong>g the losses <strong>in</strong> the cables.<br />
Table III <strong>in</strong>dicates the calculated values <strong>of</strong> various factors<br />
TABLE III: FACTORS USED FOR LOSS CALCULATIONS<br />
L d F 0.539<br />
K 0.365<br />
L s F actr 0.298<br />
<strong>Transformer</strong>s <strong>in</strong> electricity distribution companies have<br />
low load<strong>in</strong>gs for many reasons. DTs are protected aga<strong>in</strong>st<br />
short circuit, but not aga<strong>in</strong>st overload or excessive<br />
temperature. The anticipated high variability <strong>of</strong> load and<br />
the need to reserve capacity to provide resilience aga<strong>in</strong>st<br />
failure <strong>of</strong> other equipment are some <strong>of</strong> the reasons[9].<br />
IV. RESULTS<br />
As per the load curve data, total consumption (SS import)<br />
is 1876000units, 616884 kVA per month.<br />
Although transformer capacity is loaded to recorded<br />
value up to 38000 MD kVA collectively but consider<strong>in</strong>g<br />
the low values <strong>of</strong> the factors, it can be noted that <strong>in</strong> terms <strong>of</strong><br />
load<strong>in</strong>g, the utility <strong>of</strong> transformers is less.<br />
Table IV presents the losses <strong>of</strong> DTs grouped as per the<br />
rat<strong>in</strong>gs.<br />
TABLE IV(a): DAILY ENERGY LOSS OF TOTAL TRANSFORMER<br />
CIRCUIT<br />
Sl.<br />
No.<br />
Tranformer<br />
Type<br />
(kVA)<br />
Qty<br />
Energy <strong>Losses</strong> <strong>in</strong> Units(kWh)<br />
Other losses<br />
W i W wdg<br />
W other<br />
Total<br />
Units<br />
(kWh )<br />
1. 100 15 108 147 27 282<br />
2. 200 10 112.8 158.4 41 312.2<br />
3. 315 07 103.6 155.2 34 292.8<br />
4. 500 15 324 459.3 78 861.3<br />
5. 1000 11 475.2 871.2 146 1492.4<br />
6. 2000 10 720 1056 237 2013<br />
Total ∑ 1843.6 2847.1 563 5253.7<br />
TABLE IV(b): MONTHLY ENERGY LOSS OF TOTAL TRANSFORMER<br />
CIRCUIT<br />
Sl.<br />
No.<br />
Tranformer<br />
Type<br />
(kVA)<br />
Qty<br />
Energy <strong>Losses</strong> <strong>in</strong> Units(kWh)<br />
W i W wdg<br />
Other (Oil,<br />
Jo<strong>in</strong>ts, Life )<br />
Total<br />
Units<br />
(kWh )<br />
1. 100 15 3240 4410 810 8460<br />
2. 200 10 3384 4752 1230 9266<br />
3. 315 07 3108 4656 1020 7864<br />
4. 500 15 9720 13779 2340 25839<br />
5. 1000 11 14256 26136 4380 44772<br />
6. 2000 10 21600 31680 7110 60390<br />
Total ∑ 55308 76251 15870 156591<br />
The table V shows losses <strong>of</strong> each group as percentage <strong>of</strong><br />
total import units <strong>in</strong> the feeder.<br />
TABLE V: RATING WISE TRANSFORMER LOSSES FOR ONE MONTH<br />
Sl.<br />
No.<br />
Tranformer Type<br />
(kVA)<br />
Percentage(%) Of Total<br />
<strong>in</strong>put (import) Units(kWh)<br />
1. 100 0.45<br />
2. 200 0.5<br />
3. 315 0.63<br />
4. 500 1.38<br />
5. 1000 2.39<br />
6. 2000 3.22<br />
Total ∑ 8.57%<br />
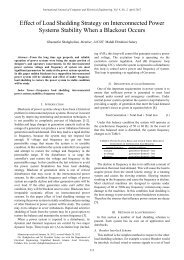
Fig. 3 shows the losses <strong>of</strong> the transformers grouped<br />
accord<strong>in</strong>g to the rat<strong>in</strong>gs.<br />
4<br />
<strong>Transformer</strong> losses<br />
% 0f Import<br />
2<br />
0<br />
0.45 0.5 0.63<br />
1.38<br />
2.39<br />
Fig.3. <strong>Transformer</strong> losses as percentage <strong>of</strong> total import<br />
V. CONCLUSIONS<br />
The method used <strong>in</strong> this paper makes use <strong>of</strong> the past data<br />
<strong>of</strong> the feeder circuit. By calculat<strong>in</strong>g the factors, the losses<br />
can be easily calculated.<br />
Total losses due transformers <strong>in</strong> the feeder circuit is<br />
8.57% <strong>of</strong> the total <strong>in</strong>put to the substation.<br />
This quantity <strong>of</strong> loss is seem<strong>in</strong>gly little high as compared<br />
to normal losses <strong>of</strong> 5 to 6% <strong>in</strong> a feeder circuit. More losses<br />
<strong>in</strong> present case can be attributed to life , poor ma<strong>in</strong>tenance<br />
and environmental aspects. If ma<strong>in</strong>tenance work is done<br />
with plann<strong>in</strong>g, at least 5000units (0.3%) can be saved. It can<br />
be noted that the losses are more for high rated transformer<br />
groups. This is because they are connected to bulk LT<br />
consumers. The network is large and covers many versatile<br />
types <strong>of</strong> mach<strong>in</strong>ery. Hence the losses are expected to be<br />
more. <strong>Transformer</strong>s <strong>of</strong> low rat<strong>in</strong>gs are connected to HT<br />
consumers. Compared to LT consumers, HT consumers are<br />
less <strong>in</strong> number and are cautious about energy sav<strong>in</strong>g<br />
activities. Energy Conservation <strong>in</strong> HT sector is<br />
comparatively wide and easy.<br />
REFERENCES<br />
[1] Guidel<strong>in</strong>es on Energy Efficiency <strong>of</strong> Electrical Installations –<br />
Electrical and Mechanical Services, Department <strong>of</strong> Energy,<br />
Government <strong>of</strong> Hong Kong Special Adm<strong>in</strong>istrative Region, 1999<br />
[2] Adriano Gal<strong>in</strong>do Leal, José Antonio Jard<strong>in</strong>i, Luiz Carlos Magr<strong>in</strong>i, and<br />
Se Un Ahn “<strong>Distribution</strong> <strong>Transformer</strong> <strong>Losses</strong> Evaluation A New<br />
Analytical Methodology and Artificial Neural Network Approach”,<br />
IEEE Tr. On Power Systems, vol. 24, no. 2, May 2009 705 pp705.<br />
[3] J. A. Jard<strong>in</strong>i, C. M. V. Tahan, M. R. Gouvea, S. U. Ahn, and F. M.<br />
Figueiredo, “Daily load pr<strong>of</strong>iles for residential, commercial and<br />
Industrial low voltage consumers,” IEEE Trans. Power Del., vol. 15,<br />
no. 1, pp. 375–380, Jan. 2000.<br />
[4] Select<strong>in</strong>g Energy Efficient <strong>Distribution</strong> <strong>Transformer</strong>s - A Guide for<br />
Achiev<strong>in</strong>g Least-Cost Solutions -,Polish Copper Promotion Centre<br />
and European Copper Institute , June 2008<br />
[5] Alejandro Navarro, and H Rudnik “Large scale <strong>Distribution</strong> Part-I:<br />
simultaneous Network and transformer Optimization and part –II”,<br />
IEEE Tr. on Power Systems, Vol24, No2, pp744/752.<br />
[6] Juan, O Galvan,Pavlos, Georgilakis and R O Vadez , ‘A review <strong>of</strong><br />
transformer losses’ Electric power components and systems ,v33,<br />
No.10 , Oct2005 pp1046<br />
[7] Dr M K Khedkar,G M Dhole and V S Ingle, “Optimal load transfer:<br />
strategy for loss reduction <strong>of</strong> distribution network” IEI Journal,-El,<br />
V84, Dec2003.<br />
[8] V A Kulkarni and Dr. P K Katti, “Efficient utilization <strong>of</strong> energy <strong>in</strong><br />
<strong>in</strong>dustry- energy management perspective “IEEE International Con.<br />
on Power Technol. POWERCON2010 OCT 2010 , Ch<strong>in</strong>a.<br />
[9] V A Kulkarni and Dr. P K Katti,”Assessment <strong>of</strong> Energy Efficiency <strong>in</strong><br />
SSI cluster by implement<strong>in</strong>g energy efficient systems” International<br />
Conference on Advances <strong>in</strong> Renewable Energy ICARE2010, Bhopal,<br />
India, June2010, pp259.<br />
661
International Journal <strong>of</strong> Computer and Electrical Eng<strong>in</strong>eer<strong>in</strong>g, Vol. 3, No. 5, October 2011<br />
Vijaykumar Annaji Kulkarni received his degree<br />
<strong>in</strong> Electrical Eng<strong>in</strong>eer<strong>in</strong>g (B.E.) from University<br />
Vishveshwaraiah College <strong>of</strong> Eng<strong>in</strong>eer<strong>in</strong>g,<br />
Bangalore, India <strong>in</strong> 1982 and Master <strong>of</strong> Eng<strong>in</strong>eer<strong>in</strong>g<br />
(M.E) <strong>in</strong> Electrical Power Systems from Govt.<br />
College <strong>of</strong> Engg. Pune, India <strong>in</strong> 1994. He is<br />
work<strong>in</strong>g as faculty member <strong>in</strong> Padmashree Dr.<br />
D.Y.Patil Institute <strong>of</strong> Engg.& Tech. Pune, India. He<br />
is member <strong>of</strong> IEEE and IE(India).<br />
He has published many technical research papers at national and<br />
<strong>in</strong>ternational level. His areas <strong>of</strong> <strong>in</strong>terest are energy conservation ,<br />
management, DSM and application <strong>of</strong> energy technology for rural areas.<br />
He is pusu<strong>in</strong>g Ph D under the guidance <strong>of</strong> Dr. P K Katti<br />
Pradeep. K. Katti was born <strong>in</strong> 1961. He graduated<br />
from Mysore University’s degree <strong>in</strong> Electrical<br />
Eng<strong>in</strong>eer<strong>in</strong>g (Power) from BIET-Davanagere <strong>in</strong><br />
1985. He obta<strong>in</strong>ed M.E (Control System) from Govt.<br />
College <strong>of</strong> Eng<strong>in</strong>eer<strong>in</strong>g <strong>of</strong> Pune University <strong>in</strong> 1991.<br />
He obta<strong>in</strong>ed Ph. D <strong>in</strong> Energy system from VNIT-<br />
Nagpur –India <strong>in</strong>2007.<br />
He has a wide teach<strong>in</strong>g experience, and presently<br />
work<strong>in</strong>g with Dr. Babasaheb Ambedkar Technological University, Lonere,<br />
India as pr<strong>of</strong>essor and Head <strong>in</strong> the Dept. <strong>of</strong> Electrical Eng<strong>in</strong>eer<strong>in</strong>g. He has<br />
guided projects at U.G. & P.G. and PhD research level. He has several<br />
Publications to his credit at <strong>in</strong>ternational and national level through<br />
conferences, journal, magaz<strong>in</strong>es etc.<br />
662