part three - Department of Immigration & Citizenship
part three - Department of Immigration & Citizenship
part three - Department of Immigration & Citizenship

Create successful ePaper yourself
Turn your PDF publications into a flip-book with our unique Google optimized e-Paper software.
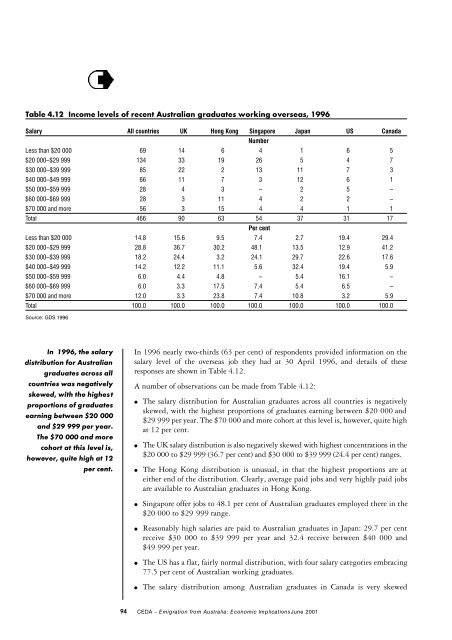
Table 4.12 Income levels <strong>of</strong> recent Australian graduates working overseas, 1996<br />
Salary All countries UK Hong Kong Singapore Japan US Canada<br />
Number<br />
Less than $20 000 69 14 6 4 1 6 5<br />
$20 000–$29 999 134 33 19 26 5 4 7<br />
$30 000–$39 999 85 22 2 13 11 7 3<br />
$40 000–$49 999 66 11 7 3 12 6 1<br />
$50 000–$59 999 28 4 3 – 2 5 –<br />
$60 000–$69 999 28 3 11 4 2 2 –<br />
$70 000 and more 56 3 15 4 4 1 1<br />
Total 466 90 63 54 37 31 17<br />
Per cent<br />
Less than $20 000 14.8 15.6 9.5 7.4 2.7 19.4 29.4<br />
$20 000–$29 999 28.8 36.7 30.2 48.1 13.5 12.9 41.2<br />
$30 000–$39 999 18.2 24.4 3.2 24.1 29.7 22.6 17.6<br />
$40 000–$49 999 14.2 12.2 11.1 5.6 32.4 19.4 5.9<br />
$50 000–$59 999 6.0 4.4 4.8 – 5.4 16.1 –<br />
$60 000–$69 999 6.0 3.3 17.5 7.4 5.4 6.5 –<br />
$70 000 and more 12.0 3.3 23.8 7.4 10.8 3.2 5.9<br />
Total 100.0 100.0 100.0 100.0 100.0 100.0 100.0<br />
Source: GDS 1996<br />
In 1996, the salary<br />
distribution for Australian<br />
graduates across all<br />
countries was negatively<br />
skewed, with the highest<br />
proportions <strong>of</strong> graduates<br />
earning between $20 000<br />
and $29 999 per year.<br />
The $70 000 and more<br />
cohort at this level is,<br />
however, quite high at 12<br />
per cent.<br />
In 1996 nearly two-thirds (63 per cent) <strong>of</strong> respondents provided information on the<br />
salary level <strong>of</strong> the overseas job they had at 30 April 1996, and details <strong>of</strong> these<br />
responses are shown in Table 4.12.<br />
A number <strong>of</strong> observations can be made from Table 4.12:<br />
●<br />
●<br />
●<br />
The salary distribution for Australian graduates across all countries is negatively<br />
skewed, with the highest proportions <strong>of</strong> graduates earning between $20 000 and<br />
$29 999 per year. The $70 000 and more cohort at this level is, however, quite high<br />
at 12 per cent.<br />
The UK salary distribution is also negatively skewed with highest concentrations in the<br />
$ 2 0 000 to $29 999 (36.7 per cent) and $30 000 to $39 999 (24.4 per cent) ranges.<br />
The Hong Kong distribution is unusual, in that the highest proportions are at<br />
either end <strong>of</strong> the distribution. Clearly, average paid jobs and very highly paid jobs<br />
are available to Australian graduates in Hong Kong.<br />
●<br />
●<br />
●<br />
●<br />
Singapore <strong>of</strong>fer jobs to 48.1 per cent <strong>of</strong> Australian graduates employed there in the<br />
$20 000 to $29 999 range.<br />
Reasonably high salaries are paid to Australian graduates in Japan: 29.7 per cent<br />
receive $30 000 to $39 999 per year and 32.4 receive between $40 000 and<br />
$49 999 per year.<br />
The US has a flat, fairly normal distribution, with four salary categories embracing<br />
77.5 per cent <strong>of</strong> Australian working graduates.<br />
The salary distribution among Australian graduates in Canada is very skewed<br />
94 C E DA – Emigration from Australia: Economic ImplicationsJune 2001