part three - Department of Immigration & Citizenship
part three - Department of Immigration & Citizenship
part three - Department of Immigration & Citizenship

You also want an ePaper? Increase the reach of your titles
YUMPU automatically turns print PDFs into web optimized ePapers that Google loves.
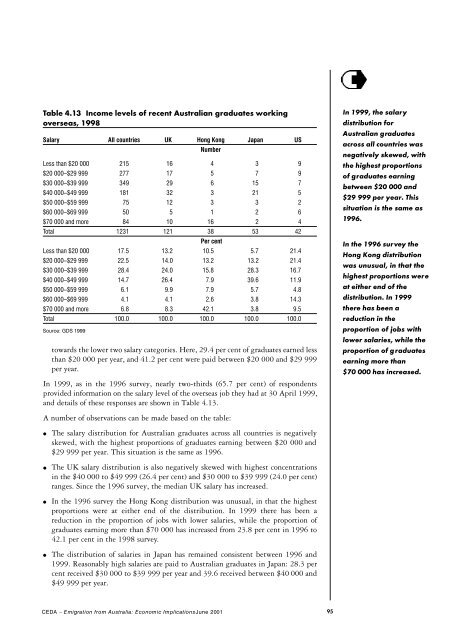
Table 4.13 Income levels <strong>of</strong> recent Australian graduates working<br />
overseas, 1998<br />
Salary All countries UK Hong Kong Japan US<br />
Number<br />
Less than $20 000 215 16 4 3 9<br />
$20 000–$29 999 277 17 5 7 9<br />
$30 000–$39 999 349 29 6 15 7<br />
$40 000–$49 999 181 32 3 21 5<br />
$50 000–$59 999 75 12 3 3 2<br />
$60 000–$69 999 50 5 1 2 6<br />
$70 000 and more 84 10 16 2 4<br />
Total 1231 121 38 53 42<br />
Per cent<br />
Less than $20 000 17.5 13.2 10.5 5.7 21.4<br />
$20 000–$29 999 22.5 14.0 13.2 13.2 21.4<br />
$30 000–$39 999 28.4 24.0 15.8 28.3 16.7<br />
$40 000–$49 999 14.7 26.4 7.9 39.6 11.9<br />
$50 000–$59 999 6.1 9.9 7.9 5.7 4.8<br />
$60 000–$69 999 4.1 4.1 2.6 3.8 14.3<br />
$70 000 and more 6.8 8.3 42.1 3.8 9.5<br />
Total 100.0 100.0 100.0 100.0 100.0<br />
Source: GDS 1999<br />
towards the lower two salary categories. Here, 29.4 per cent <strong>of</strong> graduates earned less<br />
than $20 000 per year, and 41.2 per cent were paid between $20 000 and $29 999<br />
per year.<br />
In 1999, as in the 1996 survey, nearly two-thirds (65.7 per cent) <strong>of</strong> respondents<br />
provided information on the salary level <strong>of</strong> the overseas job they had at 30 April 1999,<br />
and details <strong>of</strong> these responses are shown in Table 4.13.<br />
In 1999, the salary<br />
distribution for<br />
Australian graduates<br />
across all countries was<br />
negatively skewed, with<br />
the highest proportions<br />
<strong>of</strong> graduates earning<br />
between $20 000 and<br />
$29 999 per year. This<br />
situation is the same as<br />
1996.<br />
In the 1996 survey the<br />
Hong Kong distribution<br />
was unusual, in that the<br />
highest proportions were<br />
at either end <strong>of</strong> the<br />
distribution. In 1999<br />
there has been a<br />
reduction in the<br />
proportion <strong>of</strong> jobs with<br />
lower salaries, while the<br />
proportion <strong>of</strong> graduates<br />
earning more than<br />
$70 000 has increased.<br />
A number <strong>of</strong> observations can be made based on the table:<br />
●<br />
●<br />
●<br />
●<br />
The salary distribution for Australian graduates across all countries is negatively<br />
skewed, with the highest proportions <strong>of</strong> graduates earning between $20 000 and<br />
$29 999 per year. This situation is the same as 1996.<br />
The UK salary distribution is also negatively skewed with highest concentrations<br />
in the $40 000 to $49 999 (26.4 per cent) and $30 000 to $39 999 (24.0 per cent)<br />
ranges. Since the 1996 survey, the median UK salary has increased.<br />
In the 1996 survey the Hong Kong distribution was unusual, in that the highest<br />
proportions were at either end <strong>of</strong> the distribution. In 1999 there has been a<br />
reduction in the proportion <strong>of</strong> jobs with lower salaries, while the proportion <strong>of</strong><br />
graduates earning more than $70 000 has increased from 23.8 per cent in 1996 to<br />
42.1 per cent in the 1998 survey.<br />
The distribution <strong>of</strong> salaries in Japan has remained consistent between 1996 and<br />
1999. Reasonably high salaries are paid to Australian graduates in Japan: 28.3 per<br />
cent received $30 000 to $39 999 per year and 39.6 received between $40 000 and<br />
$49 999 per year.<br />
C E DA – Emigration from Australia: Economic ImplicationsJune 2001<br />
95