design of experiment and taguchi method application in ... - incdmtm
design of experiment and taguchi method application in ... - incdmtm
design of experiment and taguchi method application in ... - incdmtm

You also want an ePaper? Increase the reach of your titles
YUMPU automatically turns print PDFs into web optimized ePapers that Google loves.
International Conference<br />
6th Workshop on European Scientific <strong>and</strong> Industrial Collaboration<br />
on promot<strong>in</strong>g Advanced Technologies <strong>in</strong> Manufactur<strong>in</strong>g<br />
WESIC‘08<br />
Bucharest, 25-26 September 2008<br />
ROMANIA<br />
DESIGN OF EXPERIMENT AND TAGUCHI METHOD<br />
APPLICATION IN ANALYSIS OF GEAR OIL PUMP FLOW<br />
CAPACITY<br />
Ismar Alagić,<br />
REZ-RDA Central BiH/University <strong>of</strong> Zenica, Faculty <strong>of</strong> Mechanical Eng<strong>in</strong>eer<strong>in</strong>g <strong>in</strong> Zenica,<br />
Štrosmajerova 11/3. BA-7200 Zenica, Bosnia <strong>and</strong> Herzegov<strong>in</strong>a,<br />
E-mail: ismar@rez.ba , ialagic@mf.unze.ba; alagicismar@yahoo.com<br />
ABSTRACT<br />
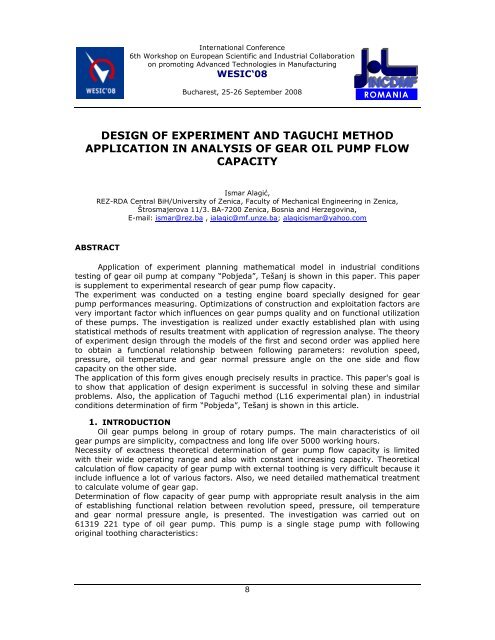
Application <strong>of</strong> <strong>experiment</strong> plann<strong>in</strong>g mathematical model <strong>in</strong> <strong>in</strong>dustrial conditions<br />
test<strong>in</strong>g <strong>of</strong> gear oil pump at company “Pobjeda”, Tešanj is shown <strong>in</strong> this paper. This paper<br />
is supplement to <strong>experiment</strong>al research <strong>of</strong> gear pump flow capacity.<br />
The <strong>experiment</strong> was conducted on a test<strong>in</strong>g eng<strong>in</strong>e board specially <strong>design</strong>ed for gear<br />
pump performances measur<strong>in</strong>g. Optimizations <strong>of</strong> construction <strong>and</strong> exploitation factors are<br />
very important factor which <strong>in</strong>fluences on gear pumps quality <strong>and</strong> on functional utilization<br />
<strong>of</strong> these pumps. The <strong>in</strong>vestigation is realized under exactly established plan with us<strong>in</strong>g<br />
statistical <strong>method</strong>s <strong>of</strong> results treatment with <strong>application</strong> <strong>of</strong> regression analyse. The theory<br />
<strong>of</strong> <strong>experiment</strong> <strong>design</strong> through the models <strong>of</strong> the first <strong>and</strong> second order was applied here<br />
to obta<strong>in</strong> a functional relationship between follow<strong>in</strong>g parameters: revolution speed,<br />
pressure, oil temperature <strong>and</strong> gear normal pressure angle on the one side <strong>and</strong> flow<br />
capacity on the other side.<br />
The <strong>application</strong> <strong>of</strong> this form gives enough precisely results <strong>in</strong> practice. This paper's goal is<br />
to show that <strong>application</strong> <strong>of</strong> <strong>design</strong> <strong>experiment</strong> is successful <strong>in</strong> solv<strong>in</strong>g these <strong>and</strong> similar<br />
problems. Also, the <strong>application</strong> <strong>of</strong> Taguchi <strong>method</strong> (L16 <strong>experiment</strong>al plan) <strong>in</strong> <strong>in</strong>dustrial<br />
conditions determ<strong>in</strong>ation <strong>of</strong> firm “Pobjeda”, Tešanj is shown <strong>in</strong> this article.<br />
1. INTRODUCTION<br />
Oil gear pumps belong <strong>in</strong> group <strong>of</strong> rotary pumps. The ma<strong>in</strong> characteristics <strong>of</strong> oil<br />
gear pumps are simplicity, compactness <strong>and</strong> long life over 5000 work<strong>in</strong>g hours.<br />
Necessity <strong>of</strong> exactness theoretical determ<strong>in</strong>ation <strong>of</strong> gear pump flow capacity is limited<br />
with their wide operat<strong>in</strong>g range <strong>and</strong> also with constant <strong>in</strong>creas<strong>in</strong>g capacity. Theoretical<br />
calculation <strong>of</strong> flow capacity <strong>of</strong> gear pump with external tooth<strong>in</strong>g is very difficult because it<br />
<strong>in</strong>clude <strong>in</strong>fluence a lot <strong>of</strong> various factors. Also, we need detailed mathematical treatment<br />
to calculate volume <strong>of</strong> gear gap.<br />
Determ<strong>in</strong>ation <strong>of</strong> flow capacity <strong>of</strong> gear pump with appropriate result analysis <strong>in</strong> the aim<br />
<strong>of</strong> establish<strong>in</strong>g functional relation between revolution speed, pressure, oil temperature<br />
<strong>and</strong> gear normal pressure angle, is presented. The <strong>in</strong>vestigation was carried out on<br />
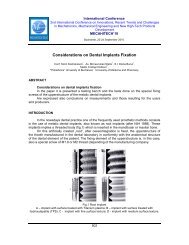
61319 221 type <strong>of</strong> oil gear pump. This pump is a s<strong>in</strong>gle stage pump with follow<strong>in</strong>g<br />
orig<strong>in</strong>al tooth<strong>in</strong>g characteristics:<br />
8
International Conference<br />
6th Workshop on European Scientific <strong>and</strong> Industrial Collaboration<br />
on promot<strong>in</strong>g Advanced Technologies <strong>in</strong> Manufactur<strong>in</strong>g<br />
WESIC‘08<br />
Bucharest, 25-26 September 2008<br />
ROMANIA<br />
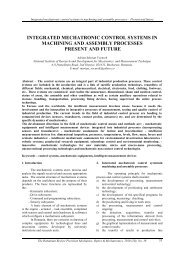
Figure 1. Section <strong>of</strong> gear pump.<br />
• Number <strong>of</strong> teeth z 8<br />
• Normal module m n 6,5<br />
• Pitch diameter d o 52<br />
• Root diameter d f 38,3 -0,3<br />
• Base diameter d b 47,128<br />
• Tip diameter d e 66 h7<br />
• Face width b 28 h8<br />
• Normal pressure angle α 25º<br />
• Centre distance a 52,75 ±0,02<br />
• Number <strong>of</strong> teeth <strong>of</strong> mesh<strong>in</strong>g gear z 1 8<br />
Also, <strong>in</strong> <strong>experiment</strong> we were used gear′s with value <strong>of</strong> normal pressure angle: α (II) =27º<br />
<strong>and</strong> α (III) =29º . Theoretical value <strong>of</strong> flow capacity <strong>of</strong> oil gear pump is given by equation as<br />
follows [1]:<br />
2 ⋅ z ⋅ b ⋅ A⋅<br />
n<br />
Q =<br />
… (1)<br />
η<br />
6<br />
2<br />
⋅10<br />
⎛ β ⎞<br />
cos⎜<br />
ο<br />
⎟<br />
⎝ π ⋅180<br />
⎠<br />
where is:<br />
• z -Number <strong>of</strong> teeth;<br />
• b -face width, mm;<br />
• A -cross section <strong>of</strong> gear gap, mm 2 ;<br />
• n -revolution speed (rpm), m<strong>in</strong> -1 ;<br />
• η -efficiency <strong>of</strong> pump (<strong>in</strong> this case η=0,8);<br />
• β -helix angle (<strong>in</strong> this case β=0), º .<br />
9
International Conference<br />
6th Workshop on European Scientific <strong>and</strong> Industrial Collaboration<br />
on promot<strong>in</strong>g Advanced Technologies <strong>in</strong> Manufactur<strong>in</strong>g<br />
WESIC‘08<br />
Bucharest, 25-26 September 2008<br />
ROMANIA<br />
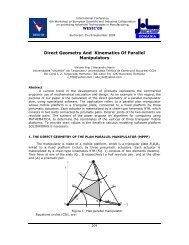
Experiment was performed on a test<strong>in</strong>g eng<strong>in</strong>e board (see figure 3) specially <strong>design</strong>ed for<br />
these pumps test<strong>in</strong>g with small resistance.<br />
Figure 2. Oil gear pump 61319 221 type.<br />
Figure 3. Test eng<strong>in</strong>e board for test<strong>in</strong>g gear pumps.<br />
2. EXPERIMENTAL DESIGN<br />
With<strong>in</strong> <strong>experiment</strong>al <strong>in</strong>vestigation <strong>of</strong> relationship (1) there have been assumed<br />
dependences <strong>of</strong> flow capacity (Q) upon oil pressure (p), rpm (n), oil temperature (t) <strong>and</strong><br />
gear normal pressure angle (α) <strong>in</strong> the form <strong>of</strong> regression polynomial <strong>of</strong> the first order:<br />
Y = b 0 x 0 + b 1 x 1 + b 2 x 2 + b 3 x 3 + b 4 x 4 + b 12 x 1 x 2 + b 13 x 1 x 3 + b 14 x 1 x 4 + b 23 x 2 x 3 + b 24 x 2 x 4 +<br />
b 34 x 3 x 4 + b 123 x 1 x 2 x 3 + b 134 x 1 x 3 x 4 + b 234 x 2 x 3 x 4 + b 1234 x 1 x 2 x 3 x 4 … (2)<br />
where:<br />
b 0 , b 1 ,… b 1234 , are parameters or coefficients <strong>of</strong> regression <strong>and</strong><br />
x 1 , x 2 , x 3 , x 4 , are coded value <strong>of</strong> model.<br />
In order to elim<strong>in</strong>ate the <strong>in</strong>fluence <strong>of</strong> other factors upon the flow capacity, planned<br />
<strong>experiment</strong> is performed on oil gear pump <strong>of</strong> type 61319 221.Clearly, <strong>design</strong> (α) <strong>and</strong><br />
exploitation (p, n, t) characteristics <strong>of</strong> gear pump will be varied <strong>experiment</strong>ally by<br />
manufactur<strong>in</strong>g sample gear pump 61319 221, <strong>and</strong> then the gear pump flow capacity will<br />
be exam<strong>in</strong>ed. Test<strong>in</strong>g the flow capacity will be performed on the test eng<strong>in</strong>e board,<br />
specially <strong>design</strong>ed for these pumps performances measur<strong>in</strong>g <strong>in</strong> the company “Pobjeda”,<br />
Tešanj, B&H.<br />
Characteristics <strong>of</strong> test eng<strong>in</strong>e board are as follows: Flow <strong>in</strong>dication, from 5,6 to 200 dm 3<br />
(maximum flow by section 400 dm 3 ); Pressure <strong>in</strong>dication, from 0 to 2,5 MPa; Vacuum<br />
<strong>in</strong>dication, from -1 to 0 MPa; Maximum power <strong>of</strong> electric motor 70 kW; Maximum<br />
pressure loss by normal flow, to 0,1 MPa; Temperature <strong>in</strong>dication, from 0 to 120 °C;<br />
Revolution speed (rpm) <strong>in</strong>dication, from 100 to 4000 rpm; Force moment <strong>of</strong> variable<br />
speed hydraulic governor, 0,8 Nm; Volume <strong>of</strong> oil tank, 80 dm 3 .<br />
Also, characteristics <strong>of</strong> work<strong>in</strong>g fluid, oil SUPER HD SL. (grade SAE 30, producer INA,<br />
Croatia), are: Specific weight, γ=0,898 kg/dm 3 ;Viscosity by 50 °C, ν=65 mm 2 /s;Viscosity<br />
<strong>in</strong>dex, IV=95; Flash po<strong>in</strong>t by Marcusson, 200° C; Freez<strong>in</strong>g po<strong>in</strong>t by ASTM, -20° C [2].<br />
10
International Conference<br />
6th Workshop on European Scientific <strong>and</strong> Industrial Collaboration<br />
on promot<strong>in</strong>g Advanced Technologies <strong>in</strong> Manufactur<strong>in</strong>g<br />
WESIC‘08<br />
Bucharest, 25-26 September 2008<br />
ROMANIA<br />
Table 1. Levels <strong>of</strong> model factor <strong>in</strong> natural <strong>and</strong> coded values.<br />
Lower level Basic level Upper level Interval <strong>of</strong> variation<br />
FACTOR<br />
pressure<br />
rpm<br />
p, 10 -1 MPa 2 4 6<br />
x 1 -1 0 +1<br />
n, m<strong>in</strong> -1 1000 1750 2500<br />
x 2 -1 0 +1<br />
oil temperature t, ˚C 80 84 88<br />
x 3 -1 0 +1<br />
normal pressure α, ˚ 25 27 29<br />
angle x 4 -1 0 +1<br />
In the Table 1, coded <strong>and</strong> natural values <strong>of</strong> model factor are shown, while <strong>in</strong> the same<br />
time equations <strong>of</strong> transformation are <strong>in</strong> the shape:<br />
x<br />
X<br />
− X<br />
i oi<br />
i<br />
= … (3)<br />
wi<br />
where:<br />
x i , is coded value <strong>of</strong> model factor;<br />
X i , is natural value <strong>of</strong> model factor;<br />
X oi , is basic level <strong>of</strong> model factor, <strong>and</strong><br />
w i , is <strong>in</strong>terval <strong>of</strong> variation.<br />
Table 2. Plan-matrix <strong>and</strong> results <strong>of</strong> <strong>in</strong>vestigation<br />
No x 0 x 1 x 2 x 3 x 4 x 1 ·x 2 x 1·x 3 x 1·x 4 x 2·x 3 x 2·x 4 x 3·x 4 x 1·x 2·x 3 x 1·x 3·x 4 x 2·x 3·x 4 x 1·x 2·x 3·x 4<br />
1 +1 +1 +1 +1 +1 +1 +1 +1 +1 +1 +1 +1 +1 +1 +1 131,5 132,332<br />
2 +1 -1 +1 +1 +1 -1 -1 -1 +1 +1 +1 -1 -1 +1 -1 133,8 134,92<br />
3 +1 +1 -1 +1 +1 -1 +1 +1 -1 -1 +1 -1 +1 -1 -1 47,6 48,72<br />
4 +1 -1 -1 +1 +1 +1 -1 -1 -1 -1 +1 +1 -1 -1 +1 53,7 54,532<br />
5 +1 +1 +1 -1 +1 +1 -1 +1 -1 +1 -1 -1 -1 -1 -1 133,1 133,932<br />
6 +1 -1 +1 -1 +1 -1 +1 -1 -1 +1 -1 +1 +1 -1 +1 135,1 136,22<br />
7 +1 +1 -1 -1 +1 -1 -1 +1 +1 -1 -1 +1 -1 +1 +1 51,3 52,42<br />
8 +1 -1 -1 -1 +1 +1 +1 -1 +1 -1 -1 -1 +1 +1 -1 55,5 55,994<br />
9 +1 +1 +1 +1 -1 +1 +1 -1 +1 -1 -1 +1 -1 -1 -1 147,7 148,82<br />
10 +1 -1 +1 +1 -1 -1 -1 +1 +1 -1 -1 -1 +1 -1 +1 150,2 151,37<br />
11 +1 +1 -1 +1 -1 -1 +1 -1 -1 +1 -1 -1 -1 +1 +1 56,6 57,432<br />
12 +1 -1 -1 +1 -1 +1 -1 +1 -1 +1 -1 +1 +1 +1 -1 60,3 61,42<br />
13 +1 +1 +1 -1 -1 +1 -1 -1 -1 -1 +1 -1 +1 +1 +1 149,5 150,62<br />
14 +1 -1 +1 -1 -1 -1 +1 +1 -1 -1 +1 +1 -1 +1 -1 151,6 152,432<br />
15 +1 +1 -1 -1 -1 -1 -1 -1 +1 +1 +1 +1 +1 -1 -1 57,7 58,532<br />
16 +1 -1 -1 -1 -1 +1 +1 +1 +1 +1 +1 -1 -1 -1 +1 62,3 63,42<br />
17 +1 0 0 0 0 0 0 0 0 0 0 0 0 0 0 99,4 99,57<br />
18 +1 0 0 0 0 0 0 0 0 0 0 0 0 0 0 102 99,57<br />
19 +1 0 0 0 0 0 0 0 0 0 0 0 0 0 0 99,8 99,57<br />
20 +1 0 0 0 0 0 0 0 0 0 0 0 0 0 0 98,6 99,57<br />
21 +1 0 0 0 0 0 0 0 0 0 0 0 0 0 0 105,4 99,57<br />
22 +1 0 0 0 0 0 0 0 0 0 0 0 0 0 0 103 99,57<br />
23 +1 0 0 0 0 0 0 0 0 0 0 0 0 0 0 104,4 99,57<br />
Multy-factor complete orthogonal first order plan N=2 k + n 0 , with replication <strong>in</strong> central<br />
po<strong>in</strong>t n 0 times is used for function form Q = f (p, n, t, α).In our case (four factors),<br />
11<br />
2<br />
750<br />
4<br />
2<br />
y<br />
ŷ
International Conference<br />
6th Workshop on European Scientific <strong>and</strong> Industrial Collaboration<br />
on promot<strong>in</strong>g Advanced Technologies <strong>in</strong> Manufactur<strong>in</strong>g<br />
WESIC‘08<br />
Bucharest, 25-26 September 2008<br />
ROMANIA<br />
number <strong>of</strong> replication <strong>of</strong> <strong>experiment</strong> <strong>in</strong> central po<strong>in</strong>t is n 0 =7. Therefore, the number <strong>of</strong><br />
<strong>experiment</strong>al po<strong>in</strong>ts is: N=2 k + n 0 = 2 4 + 7 = 23. By regression analysis <strong>of</strong> data from the<br />
Table 2, regression model <strong>of</strong> first order <strong>in</strong> coded values has been obta<strong>in</strong>ed:<br />
Ŷ= 99,57-1,719⋅x 1 +42,969⋅x 2 -0,919⋅x 3 -5,894⋅x 4 + 0,606⋅x 1 ⋅x 2 -0,106⋅x 1 ⋅x 3 -<br />
0,106⋅x 1 ⋅x 4 +0,156⋅x 2 ⋅x 3 -2,294⋅x 2 ⋅x 4 -0,131⋅x 3 ⋅x 4 +0,019⋅x 1 ⋅x 2 ⋅x 3 -<br />
0,169⋅x 1 ⋅x 3 ⋅x 4 +0,169⋅x 2 ⋅x 3 ⋅x 4 +0,181⋅x 1 ⋅x 2 ⋅x 3 ⋅x 4<br />
…(4)<br />
Us<strong>in</strong>g the transformation equations (3) <strong>and</strong> model (4) is transformed <strong>in</strong>to model with<br />
natural values:<br />
Q=Ŷ=217,004-83,094⋅p+0,021⋅n-2,464⋅t-7,067⋅α+<br />
0,034⋅p⋅n+0,979⋅p⋅t+3,078⋅p⋅α+0,001⋅n⋅t+0,001⋅n⋅α +0,082⋅t⋅α-0,0004⋅p⋅n⋅t-0,001⋅p⋅n⋅α-<br />
0,037⋅p⋅t⋅α-0,000003⋅n⋅t⋅α+0,00002⋅p⋅n⋅t⋅α<br />
…(5)<br />
By disperse analysis <strong>of</strong> model (4) it has been shown that follow<strong>in</strong>g parameters <strong>of</strong> the<br />
model b 0, b 1 , b 2 , b 4 <strong>and</strong> b 24 (b 0 =99,57, b 1 =-1,72, b 2 =42,97, b 4 =-5,89, b 24 =-2,29) are<br />
significant, because numerical values <strong>of</strong> Student t-test (t b0 =333,46, t b1 =4,01,<br />
t b2 =100,11, t b3 =2,14, t b4 =13,73, t b24 =5,34) greater than table value or critical value t t =<br />
2,447 for α=0,05 <strong>and</strong> ν=6 degrees <strong>of</strong> freedom. Check<strong>in</strong>g <strong>of</strong> model (4) adequacy has<br />
showed that model is adequate, because numerical value <strong>of</strong> Fishers test F r =0,921 is<br />
smaller the table or critical ones F t =4,00 for the α=0,05 <strong>and</strong> ν 1 =12 <strong>and</strong> ν 2 =6 degrees <strong>of</strong><br />
freedom.<br />
Accord<strong>in</strong>gly, f<strong>in</strong>al first order polynom for proper describ<strong>in</strong>g dependence <strong>of</strong> flow capacity<br />
<strong>of</strong> exam<strong>in</strong>ed oil gear pump upon significant factors <strong>of</strong> model is:<br />
Ŷ=99,57-1,719⋅x 1 +42,969⋅x 2 -5,894⋅x 4 -2,294⋅x 2 ⋅x 4<br />
…(6)<br />
or, apply<strong>in</strong>g transformation equation (3), <strong>in</strong> natural values:<br />
Q=214,004-83,094⋅p+0,021⋅n-7,067⋅α+0,001⋅n⋅α … (7)<br />
3. ANALYSIS OF THE EXPERIMENTAL RESULTS<br />
• Flow capacity phenomena can be adequately presented by <strong>application</strong> <strong>of</strong><br />
<strong>experiment</strong> <strong>design</strong>;<br />
• Significance analysis <strong>of</strong> model (6) was shown that factors as follows: x 1<br />
(pressure), x 2 (rpm) <strong>and</strong> x 4 (normal pressure angle) are significant. Also, this<br />
analysis was shown that only factor x 3 (oil temperature) are not significant <strong>and</strong><br />
doesn’t have any significantly <strong>in</strong>fluence to flow capacity value <strong>in</strong> this case;<br />
• Adequacy analysis was shown that model (6) correctly describe researched<br />
process, <strong>and</strong> coefficient <strong>of</strong> correlation has a very high value R=0,99;<br />
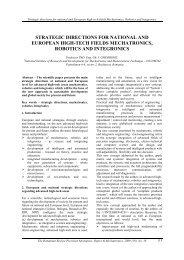
• Comparation between theoretical <strong>and</strong> model value <strong>of</strong> flow capacity are presented<br />
on figure 4. From this figure, you can see that the ma<strong>in</strong> <strong>in</strong>fluence on flow capacity<br />
has rpm value;<br />
• Optimization <strong>of</strong> dependence between flow capacity on the one h<strong>and</strong>, <strong>and</strong> rpm,<br />
pressure, <strong>and</strong> normal pressure angle on the other h<strong>and</strong>, is presented on the<br />
figure’s 5 <strong>and</strong> 6;<br />
• The importance <strong>of</strong> this <strong>experiment</strong> is <strong>in</strong> the fact that it shows how on the fast <strong>and</strong><br />
12
International Conference<br />
6th Workshop on European Scientific <strong>and</strong> Industrial Collaboration<br />
on promot<strong>in</strong>g Advanced Technologies <strong>in</strong> Manufactur<strong>in</strong>g<br />
WESIC‘08<br />
Bucharest, 25-26 September 2008<br />
ROMANIA<br />
simple way, with the use <strong>of</strong> the <strong>method</strong>s <strong>of</strong> the <strong>experiment</strong>al <strong>design</strong>, the<br />
expressions which describe more complex processes can be obta<strong>in</strong>ed with the<br />
sufficient precision.<br />
Grafical <strong>in</strong>terpretation <strong>of</strong> flow capacity dependence (oil gear pump<br />
61319 221 type) upon rpm <strong>and</strong> pressure (case where normal pressure<br />
angle is 25 degrees).<br />
200<br />
150<br />
Theoretic value <strong>of</strong><br />
flow<br />
flow<br />
100<br />
50<br />
0<br />
1000 2500<br />
Model value <strong>of</strong> flow<br />
by p=2 MPa<br />
Model value <strong>of</strong> flow<br />
by p=6 MPa<br />
rpm<br />
Figure 4. Grafical <strong>in</strong>terpretation <strong>of</strong> flow capacity dependence <strong>of</strong> gear oil pump 61319 221 type.<br />
Data: FLOW.STA 17v * 30c<br />
Data: FLOW.STA 17v * 30c<br />
50.909<br />
61.818<br />
72.727<br />
83.636<br />
94.545<br />
105.455<br />
116.364<br />
127.273<br />
138.182<br />
149.091<br />
above<br />
Figure 5. Influence optimization <strong>of</strong> rpm <strong>and</strong> normal Figure 6. Influence optimization <strong>of</strong> rpm <strong>and</strong> pressure<br />
pressure angle (α) on flow capacity.<br />
on flow capacity.<br />
53.631<br />
64.268<br />
74.905<br />
85.542<br />
96.179<br />
106.815<br />
117.452<br />
128.089<br />
138.726<br />
149.363<br />
above<br />
4. APPLICATION OF TAGUCHI METHOD<br />
The Taguchi <strong>method</strong> is based on statistical <strong>design</strong> <strong>of</strong> <strong>experiment</strong>s <strong>and</strong> is applied at the<br />
parameter <strong>design</strong> stage to establish optimum process sett<strong>in</strong>gs or <strong>design</strong> parameters.<br />
The basic concept <strong>of</strong> the Taguchi Method through <strong>application</strong> example <strong>in</strong> order to<br />
determ<strong>in</strong>e flow capacity <strong>of</strong> gear oil pump is presented <strong>in</strong> this article. This article is<br />
supplement to <strong>experiment</strong>al research <strong>of</strong> gear pump flow capacity. Comb<strong>in</strong>ation <strong>of</strong><br />
work<strong>in</strong>g pressure, revolution per speed, work<strong>in</strong>g oil temperature, normal pressure angle<br />
as <strong>design</strong> characteristic <strong>of</strong> gear pump <strong>and</strong> type <strong>of</strong> oil has essential <strong>in</strong>fluence on<br />
achievement <strong>of</strong> flow capacity as output characteristic <strong>of</strong> gear oil pump. All above five<br />
factors were used for the <strong>experiment</strong>.<br />
13
International Conference<br />
6th Workshop on European Scientific <strong>and</strong> Industrial Collaboration<br />
on promot<strong>in</strong>g Advanced Technologies <strong>in</strong> Manufactur<strong>in</strong>g<br />
WESIC‘08<br />
Bucharest, 25-26 September 2008<br />
ROMANIA<br />
The <strong>experiment</strong> was carried out us<strong>in</strong>g a st<strong>and</strong>ard Taguchi’s <strong>experiment</strong>al plan with<br />
denotation L16 (2 15 ). The S/N calculations are based on larger the better S/N ratio. The<br />
<strong>experiment</strong> was conducted on a test<strong>in</strong>g board specially <strong>design</strong>ed for gear pump<br />
performances measur<strong>in</strong>g. Application <strong>of</strong> Taguchi <strong>method</strong> <strong>in</strong> <strong>in</strong>dustrial conditions<br />
determ<strong>in</strong>ation <strong>of</strong> flow capacity <strong>of</strong> gear oil pump <strong>in</strong> company “Pobjeda”, Tešanj is shown <strong>in</strong><br />
this article. Obta<strong>in</strong>ed test results are <strong>of</strong> practical importance, especially <strong>in</strong> the field <strong>of</strong><br />
gear pumps <strong>design</strong>.<br />
The <strong>experiment</strong>al plan has two levels. There are 13 degrees <strong>of</strong> freedom regard<strong>in</strong>g the<br />
number <strong>of</strong> levels <strong>of</strong> control factors <strong>and</strong> number <strong>of</strong> desired <strong>in</strong>teractions between control<br />
factors. The <strong>experiment</strong> was performed accord<strong>in</strong>g to Taguchi <strong>experiment</strong>al plan with<br />
<strong>design</strong>ation L 16 (2 15 ). An orthogonal array with arranged control factors <strong>and</strong> their<br />
<strong>in</strong>teraction to columns is presented <strong>in</strong> table 2. Where <strong>design</strong>ations 1 <strong>and</strong> 2 mean 1 st <strong>and</strong><br />
2 nd level <strong>of</strong> each control level. Accord<strong>in</strong>g to that we have made 16 <strong>experiment</strong>al runs at<br />
control factors’ level like it is determ<strong>in</strong>ed by the orthogonal array.<br />
Table 3. The levels <strong>of</strong> the factors.<br />
Factor Designation 1 st level 2 nd level Degrees <strong>of</strong> freedom<br />
pressure, p [10 -1 MPa] A 2 6 1<br />
rpm, n [m<strong>in</strong> -1 ] B 1000 2500 1<br />
oil temperature, t [˚C] C 80 88 1<br />
normal pressure angle, α [°] D 25 29 1<br />
oil type (producer <strong>of</strong> oil) E INA Castrol 1<br />
The Larger-the-Better approach <strong>of</strong> Taguchi <strong>method</strong> has been used for analysis <strong>of</strong><br />
<strong>experiment</strong>al results. The Signal-to-Noise (S/N) ratio is calculated accord<strong>in</strong>g to the<br />
equation:<br />
n<br />
10 ∑ y i<br />
i=<br />
1<br />
2<br />
η = S / N = −10log<br />
( )<br />
… (8)<br />
Each measurement <strong>of</strong> flow capacity has been repeated three times, as can be seen from<br />
table 3.<br />
Table 4. Plan <strong>of</strong> an <strong>experiment</strong> <strong>and</strong> results based on L15 <strong>experiment</strong>al plan.<br />
No C E CxE B CxB BxE AxD A AxC AxE BxD A x B DxE CxD D Measured flow capacity,<br />
Q[dm 3 ]<br />
S/N<br />
i 1 2 3 4 5 6 7 8 9 10 11 12 13 14 15 Q 1 Q 2 Q 3 η i<br />
1 1 1 1 1 1 1 1 1 1 1 1 1 1 1 1 62,4 62,3 62,4 45,44148<br />
2 1 1 1 1 1 1 1 2 2 2 2 2 2 2 2 51,3 51,3 51,1 43,73349<br />
3 1 1 1 2 2 2 2 1 1 1 1 2 2 2 2 135,2 135,1 135,2 52,15982<br />
4 1 1 1 2 2 2 2 2 2 2 2 1 1 1 1 149,6 149,7 149,6 53,04299<br />
5 1 2 2 1 1 2 2 1 1 2 2 1 1 2 2 55,4 55,6 55,6 44,43351<br />
6 1 2 2 1 1 2 2 2 2 1 1 2 2 1 1 57,7 57,8 57,8 44,77597<br />
7 1 2 2 2 2 1 1 1 1 2 2 2 2 1 1 151,6 151,6 151,6 53,15641<br />
8 1 2 2 2 2 1 1 2 2 1 1 1 1 2 2 133,2 133,2 133,3 52,03468<br />
9 2 1 2 1 2 1 2 1 2 1 2 1 2 1 2 53,7 53,6 53,8 44,14192<br />
10 2 1 2 1 2 1 2 2 1 2 1 2 1 2 1 56,4 56,6 56,6 44,58853<br />
11 2 1 2 2 1 2 1 1 2 1 2 2 1 2 1 150,3 150,3 150,3 53,08160<br />
12 2 1 2 2 1 2 1 2 1 2 1 1 2 1 2 131,7 131,5 131,4 51,92315<br />
13 2 2 1 1 2 2 1 1 2 2 1 1 2 2 1 60,4 60,4 60,3 45,15837<br />
14 2 2 1 1 2 2 1 2 1 1 2 2 1 1 2 47,5 47,5 47,6 43,08239<br />
15 2 2 1 2 1 1 2 1 2 2 1 2 1 1 2 133,6 133,7 133,8 52,06505<br />
16 2 2 1 2 1 1 2 2 1 1 2 1 2 2 1 147,8 147,8 147,7 52,93396<br />
14
International Conference<br />
6th Workshop on European Scientific <strong>and</strong> Industrial Collaboration<br />
on promot<strong>in</strong>g Advanced Technologies <strong>in</strong> Manufactur<strong>in</strong>g<br />
WESIC‘08<br />
Bucharest, 25-26 September 2008<br />
ROMANIA<br />
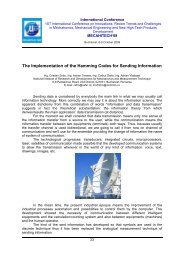
Control factors <strong>and</strong> their <strong>in</strong>teractions are sorted <strong>in</strong> relation to the difference values. The<br />
all control factors <strong>and</strong> their <strong>in</strong>teractions are shown <strong>in</strong> table 4. We can see that the<br />
strongest <strong>in</strong>fluence is exerted by control factors B (rpm), D (normal pressure angle) <strong>and</strong><br />
<strong>in</strong>teraction AxB. All other control factors <strong>and</strong> <strong>in</strong>teractions have a weak <strong>in</strong>fluence on the<br />
S/N ratio <strong>of</strong> the considered flow capacity.<br />
Factor A<br />
Factor B<br />
S/N<br />
390,000<br />
389,000<br />
388,000<br />
387,000<br />
386,000<br />
385,000<br />
0 1 2 3 4 5 6 7<br />
pressure, p (0,1 MPa)<br />
S/N<br />
440,000<br />
420,000<br />
400,000<br />
380,000<br />
360,000<br />
340,000<br />
0 500 1000 1500 2000 2500 3000<br />
rpm, n (1/m<strong>in</strong>)<br />
Factor D<br />
Interaction AxB<br />
S/N<br />
394,000<br />
392,000<br />
390,000<br />
388,000<br />
386,000<br />
384,000<br />
382,000<br />
25 25 26 26 27 27 28 28 29 29 30<br />
normal pressure angle, α [°]<br />
S/N<br />
55,000<br />
50,000<br />
45,000<br />
40,000<br />
35,000<br />
2 6<br />
pressure, p [0,1 MPa]<br />
1000<br />
2500<br />
Figure 7 Signal-to-Noise Ratio response graphs for significant control parameters <strong>and</strong> their<br />
<strong>in</strong>teractions.<br />
Table 5. Signal-to-Noise ratio response table.<br />
C E CxE B CxB BxE AxD A AxC AxE BxD AxB DxE CxD D<br />
L1 388,778 388,113 387,618 355,356 388,388 388,096 387,612 389,638 387,719 387,652 388,147 389,110 387,770 387,629 392,179<br />
L2 386,975 387,640 388,136 420,398 387,365 387,658 388,142 386,115 388,034 388,102 387,606 386,643 387,983 388,124 383,574<br />
Delta 1,803 0,473 0,518 65,042 1,023 0,438 0,530 3,523 0,315 0,450 0,541 2,467 0,213 0,495 8, 605<br />
Accord<strong>in</strong>g to the table 5, we can determ<strong>in</strong>e which control factors <strong>and</strong> their <strong>in</strong>teractions<br />
have a very strong <strong>in</strong>fluence on the flow capacity <strong>of</strong> the oil gear pump. Optimal <strong>in</strong>put<br />
work<strong>in</strong>g conditions <strong>of</strong> these control factors can be very easily determ<strong>in</strong>ed from S/N<br />
response graphs <strong>in</strong> figure 7. The best flow capacity value is at the higher S/N values <strong>in</strong><br />
the mentioned response graphs. Expected value <strong>of</strong> S/N ratio was calculated by follow<strong>in</strong>g<br />
expression:<br />
η = Q + ( B2 − Q)<br />
+ ( D1<br />
− Q)<br />
+ | ( A1<br />
B2<br />
− Q)<br />
− ( A1<br />
− Q)<br />
. − ( B2<br />
− Q)<br />
|<br />
...(9)<br />
η = A B + D − A 55,18<br />
...(10)<br />
1 2 1 1<br />
=<br />
The η value derived from expression (9) was used to calculate flow capacity Q accord<strong>in</strong>g<br />
to expression:<br />
15
International Conference<br />
6th Workshop on European Scientific <strong>and</strong> Industrial Collaboration<br />
on promot<strong>in</strong>g Advanced Technologies <strong>in</strong> Manufactur<strong>in</strong>g<br />
WESIC‘08<br />
Bucharest, 25-26 September 2008<br />
ROMANIA<br />
η<br />
55,18<br />
20 20<br />
η = 10 = 10 = 579,78 dm 3 /h … (11)<br />
The calculated flow capacity is 579,8 dm 3 /h, this value is very close to the value<br />
calculated by expression (1) Q=583,15 dm 3 /h. The analysis <strong>of</strong> variance ANOVA <strong>of</strong> S/N<br />
ratios is shown <strong>in</strong> figure 8.<br />
Figure 8. Analysis <strong>of</strong> variance us<strong>in</strong>g QI Macros.<br />
5. CONCLUSION<br />
Based on presented <strong>experiment</strong>al research <strong>and</strong> results analysis, follow<strong>in</strong>g can be<br />
concluded:<br />
• Systematically, by apply<strong>in</strong>g theory <strong>of</strong> <strong>experiment</strong>al <strong>design</strong>, dependence <strong>of</strong><br />
oil gear pump flow capacity value upon the revolution speed, pressure, oil<br />
temperature <strong>and</strong> gear normal pressure angle, has been <strong>in</strong>vestigated;<br />
• Experimental <strong>in</strong>vestigation has been performed on a test<strong>in</strong>g eng<strong>in</strong>e board<br />
specially <strong>design</strong>ed for these pumps performances measur<strong>in</strong>g <strong>in</strong> <strong>in</strong>dustrial<br />
conditions at company “Pobjeda”, Tesanj, Bosnia <strong>and</strong> Herzegov<strong>in</strong>a;<br />
• For the purpose <strong>of</strong> reliable predict<strong>in</strong>g the flow capacity value <strong>of</strong> mentioned<br />
oil gear pump can be used <strong>experiment</strong>ally obta<strong>in</strong>ed polynomial dependence <strong>of</strong> the<br />
first order:<br />
Q =ŷ= 217,004 - 83,094⋅p + 0,21⋅n - 7,067⋅α + 0,001⋅n⋅α<br />
• Theoretical value <strong>of</strong> flow capacity <strong>of</strong> oil gear pump is given by one <strong>of</strong><br />
follow<strong>in</strong>g equations [3], [4], [5], [6], [7], [8], [9], [10] :<br />
Q t =2πbnm 2 (z+1)10 -6<br />
…(12)<br />
16
International Conference<br />
6th Workshop on European Scientific <strong>and</strong> Industrial Collaboration<br />
on promot<strong>in</strong>g Advanced Technologies <strong>in</strong> Manufactur<strong>in</strong>g<br />
WESIC‘08<br />
Bucharest, 25-26 September 2008<br />
ROMANIA<br />
Q t =2πbnm 2 (z+2k 1 +0,276)10 -6<br />
Q t =6,5bnm 2 z10 -6<br />
Q t =7bndm10 -6<br />
Q t =πbna(d k -a)10 -6<br />
Q t =(π/4) bn(d 2 k -d 2 f )10 -6<br />
Q t =0,785 bn(d 2 k -d 2 f )10 -6<br />
Q t =πbnd o h10 -6<br />
Q t =0,875 bn(d 2 k -d 2 f )10 -6<br />
Q t =(31,4/60)bn(d 2 k -d 2 f )10 -6<br />
Q t =(47/60)bn(d 2 k -d 2 f )(1/cosβ o )10 -6<br />
Q t =(π/2)bn[d 2 k -a 2 -(d 2 b π 2 /3z 2 )]10 -6<br />
Q t =2A z bnz10 -6<br />
Q t =2A m bnz10 -6<br />
Q t =2πbn[r 2 k -r 2 o -k(t 0 /12)]10 -6<br />
Q t =2πbnm 2 [z+1-(π 2 cos 2 α)/12]10 -6<br />
Q t =2πbn[m 2 (z+1)-(l 2 /12)] 10 -6<br />
Q t =2πbn[[r 2 k -r 2 -m 2 cos 2 α] 10 -6<br />
…(13)<br />
…(14)<br />
…(15)<br />
…(16)<br />
…(17)<br />
…(18)<br />
…(19)<br />
…(20)<br />
…(21)<br />
…(22)<br />
…(23)<br />
…(24)<br />
…(25)<br />
…(26)<br />
…(27)<br />
…(28)<br />
…(29)<br />
Deviation limits between mentioned equations <strong>and</strong> obta<strong>in</strong>ed equation <strong>of</strong> the first order<br />
are as follows: -4% <strong>and</strong> +7%;<br />
• Based on performed <strong>experiment</strong>, can be concluded most <strong>in</strong>fluence factors on flow<br />
capacity <strong>of</strong> gear oil pump are as follows:<br />
-<strong>design</strong> <strong>of</strong> gear, hous<strong>in</strong>g <strong>of</strong> pump <strong>and</strong> cover <strong>of</strong> pump;<br />
-radial <strong>and</strong> axial clearance;<br />
-type <strong>and</strong> temperature <strong>of</strong> fluid <strong>and</strong><br />
-gear tooth pr<strong>of</strong>ile.<br />
• The <strong>experiment</strong> has been performed on oil gear pump <strong>of</strong> type 61319 221, <strong>and</strong><br />
because <strong>of</strong> that, stated conclusions can not be applied for the other types <strong>of</strong> these<br />
pumps, but the same <strong>method</strong>ology <strong>of</strong> <strong>design</strong> <strong>experiment</strong> can be used for other types <strong>of</strong><br />
these pumps.<br />
• In this article, the way <strong>of</strong> optimisation <strong>of</strong> <strong>in</strong>put work<strong>in</strong>g characteristics <strong>in</strong> order to<br />
determ<strong>in</strong>e <strong>of</strong> flow capacity <strong>of</strong> oil gear pump, us<strong>in</strong>g the Larger-the-Better Taguchi <strong>method</strong><br />
approach, is shown. Us<strong>in</strong>g the Taguchi <strong>method</strong>, the flow capacity <strong>of</strong> gear oil pump was<br />
optimised. An L16 orthogonal array was used to accommodate the <strong>experiment</strong>s. Analysis<br />
<strong>of</strong> the result <strong>of</strong> <strong>experiment</strong> obta<strong>in</strong>ed <strong>in</strong>formation regard<strong>in</strong>g the most <strong>in</strong>fluenc<strong>in</strong>g factors<br />
on flow capacity. The results revealed that the rpm, the normal pressure angle, <strong>and</strong> the<br />
<strong>in</strong>teraction between rpm <strong>and</strong> pressure could significantly affect the flow capacity. By<br />
consideration <strong>of</strong> technical effects, the optimal levels were chosen to be A1, B2, C1, D1<br />
<strong>and</strong> E1, correspond<strong>in</strong>g to pressure <strong>of</strong> 0,2 MPa, rpm <strong>of</strong> 2500 m<strong>in</strong> -1 , oil temperature <strong>of</strong><br />
80°C, normal pressure angle <strong>of</strong> 25° <strong>and</strong> oil type <strong>of</strong> INA producer.<br />
F<strong>in</strong>ally, it can be concluded that accord<strong>in</strong>g to the <strong>experiment</strong>al results, Taguchi <strong>method</strong><br />
approach used for determ<strong>in</strong>ation <strong>of</strong> flow capacity <strong>of</strong> oil gear pump, makes possible to<br />
17
International Conference<br />
6th Workshop on European Scientific <strong>and</strong> Industrial Collaboration<br />
on promot<strong>in</strong>g Advanced Technologies <strong>in</strong> Manufactur<strong>in</strong>g<br />
WESIC‘08<br />
Bucharest, 25-26 September 2008<br />
ROMANIA<br />
obta<strong>in</strong> good quality <strong>of</strong> pump output characteristic, which is very close to the value<br />
calculated by theoretical expression (1). F<strong>in</strong>ally, it can be concluded that accord<strong>in</strong>g to the<br />
<strong>experiment</strong>al results, Taguchi <strong>method</strong> approach used for determ<strong>in</strong>ation <strong>of</strong> flow capacity<br />
<strong>of</strong> oil gear pump, makes possible to obta<strong>in</strong> good quality <strong>of</strong> pump output characteristic,<br />
which is very close to the value calculated by theoretical expression (1).<br />
6. REFERENCES<br />
[1] Alagic I.: Some Approaches to Theoretical-Experimental Determ<strong>in</strong>ation Flow<br />
Capacity <strong>of</strong> Gear Pumps, 3 rd International Symposium on Revitalization <strong>and</strong><br />
Modernization <strong>of</strong> Production RIM 2001, University <strong>of</strong> Bihać, Technical Faculty<br />
Bihać, pp. 453-461, Bosnia <strong>and</strong> Herzegov<strong>in</strong>a 2001.<br />
[2] Alagic I.: Theoretical <strong>and</strong> Experimental Determ<strong>in</strong>ation <strong>of</strong> Volumetric Losses <strong>of</strong> Gear<br />
Pumps, 3 rd International Symposium on Revitalization <strong>and</strong> Modernization <strong>of</strong><br />
Production RIM 2001, University <strong>of</strong> Bihać, Technical Faculty Bihać, pp. 445-453,<br />
Bosnia <strong>and</strong> Herzegov<strong>in</strong>a, 2001.<br />
[3] Alagic I.: Theoretical <strong>and</strong> Experimental Determ<strong>in</strong>ation Flow Capacity <strong>of</strong> Oil Gear<br />
Pump <strong>in</strong> Lubrication System <strong>of</strong> Internal Combustion Eng<strong>in</strong>e, 5 th International<br />
Research/Expert Conference TMT 2000, Faculty <strong>of</strong> Mechanical Eng<strong>in</strong>eer<strong>in</strong>g <strong>in</strong><br />
Zenica, pp. 380-388, Bosnia <strong>and</strong> Herzegov<strong>in</strong>a, 2000.<br />
[4] Bašta T.M.: Maš<strong>in</strong>ostoiteljnaja givdravlika, Maš<strong>in</strong>ostoenie, Moskva, SSSR, 1986.<br />
[5] Jud<strong>in</strong> E.M.: Šesterenie nanosi, Maš<strong>in</strong>ostoenie, Moskva, SSSR, 1986.<br />
[6] Kiseljev V.J.: Nasosi kompresori i ventilatori, Metalurgiezdateljstvo, Moskow,<br />
SSSR, 1988.<br />
[7] Smirnov J.N.: Gidravličeskie turb<strong>in</strong>e i nasosi, Visšaja Škola, Moskva, SSSR, 1980.<br />
[8] Pohlenz W., Grobe H.: Pumpen fűr Flűssigkeiten, Veb Verlag Technik, Berl<strong>in</strong>,<br />
Germany, 1988.<br />
[9] Keck K.F.: Die Zahnradpraxis, Teil II, R. Oldenbourg, Műnchen, Germany, 1989.<br />
[10] Lichtenauer G., Roog O.O.: Kallhardt, Hurt Zuhnradschaben, Carl Hanser Verlag,<br />
Műnchen,Germany, 1991.<br />
18