The Health of the Maori Language in 2006 - Te Puni Kokiri
The Health of the Maori Language in 2006 - Te Puni Kokiri
The Health of the Maori Language in 2006 - Te Puni Kokiri

You also want an ePaper? Increase the reach of your titles
YUMPU automatically turns print PDFs into web optimized ePapers that Google loves.
22<br />
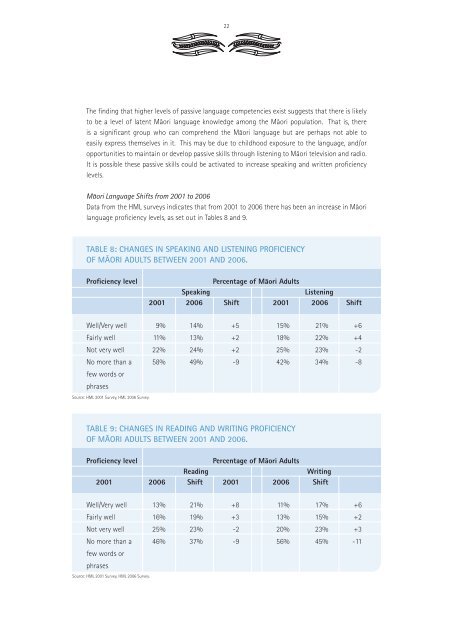
<strong>The</strong> f<strong>in</strong>d<strong>in</strong>g that higher levels <strong>of</strong> passive language competencies exist suggests that <strong>the</strong>re is likely<br />
to be a level <strong>of</strong> latent Mäori language knowledge among <strong>the</strong> Mäori population. That is, <strong>the</strong>re<br />
is a significant group who can comprehend <strong>the</strong> Mäori language but are perhaps not able to<br />
easily express <strong>the</strong>mselves <strong>in</strong> it. This may be due to childhood exposure to <strong>the</strong> language, and/or<br />
opportunities to ma<strong>in</strong>ta<strong>in</strong> or develop passive skills through listen<strong>in</strong>g to Mäori television and radio.<br />
It is possible <strong>the</strong>se passive skills could be activated to <strong>in</strong>crease speak<strong>in</strong>g and written pr<strong>of</strong>iciency<br />
levels.<br />
Mäori <strong>Language</strong> Shifts from 2001 to <strong>2006</strong><br />
Data from <strong>the</strong> HML surveys <strong>in</strong>dicates that from 2001 to <strong>2006</strong> <strong>the</strong>re has been an <strong>in</strong>crease <strong>in</strong> Mäori<br />
language pr<strong>of</strong>iciency levels, as set out <strong>in</strong> Tables 8 and 9.<br />
TABLE 8: CHANGES IN SPEAKING AND LISTENING PROFICIENCY<br />
OF MÄORI ADULTS BETWEEN 2001 AND <strong>2006</strong>.<br />
Pr<strong>of</strong>iciency level<br />
Percentage <strong>of</strong> Mäori Adults<br />
Speak<strong>in</strong>g<br />
Listen<strong>in</strong>g<br />
2001 <strong>2006</strong> Shift 2001 <strong>2006</strong> Shift<br />
Well/Very well 9% 14% +5 15% 21% +6<br />
Fairly well 11% 13% +2 18% 22% +4<br />
Not very well 22% 24% +2 25% 23% -2<br />
No more than a 58% 49% -9 42% 34% -8<br />
few words or<br />
phrases<br />
Source: HML 2001 Survey, HML <strong>2006</strong> Survey.<br />
TABLE 9: CHANGES IN READING AND WRITING PROFICIENCY<br />
OF MÄORI ADULTS BETWEEN 2001 AND <strong>2006</strong>.<br />
Pr<strong>of</strong>iciency level<br />
Percentage <strong>of</strong> Mäori Adults<br />
Read<strong>in</strong>g<br />
Writ<strong>in</strong>g<br />
2001 <strong>2006</strong> Shift 2001 <strong>2006</strong> Shift<br />
Well/Very well 13% 21% +8 11% 17% +6<br />
Fairly well 16% 19% +3 13% 15% +2<br />
Not very well 25% 23% -2 20% 23% +3<br />
No more than a 46% 37% -9 56% 45% -11<br />
few words or<br />
phrases<br />
Source: HML 2001 Survey, HML <strong>2006</strong> Survey.