Ch. 11 - (Part 1) Weather Theory - St. Louis Pilot Services
Ch. 11 - (Part 1) Weather Theory - St. Louis Pilot Services
Ch. 11 - (Part 1) Weather Theory - St. Louis Pilot Services

Create successful ePaper yourself
Turn your PDF publications into a flip-book with our unique Google optimized e-Paper software.
<strong>Ch</strong>apter <strong>11</strong><br />
<strong>Weather</strong> <strong>Theory</strong><br />
Introduction<br />
<strong>Weather</strong> is an important factor that influences aircraft<br />
performance and flying safety. It is the state of the atmosphere<br />
at a given time and place, with respect to variables such as<br />
temperature (heat or cold), moisture (wetness or dryness),<br />
wind velocity (calm or storm), visibility (clearness or<br />
cloudiness), and barometric pressure (high or low). The term<br />
weather can also apply to adverse or destructive atmospheric<br />
conditions, such as high winds.<br />
This chapter explains basic weather theory and offers pilots<br />
background knowledge of weather principles. It is designed<br />
to help them gain a good understanding of how weather<br />
affects daily flying activities. Understanding the theories<br />
behind weather helps a pilot make sound weather decisions<br />
based on the reports and forecasts obtained from a Flight<br />
Service <strong>St</strong>ation (FSS) weather specialist and other aviation<br />
weather services.<br />
Be it a local flight or a long cross-country flight, decisions<br />
based on weather can dramatically affect the safety of the<br />
flight.<br />
<strong>11</strong>-1
Atmosphere<br />
The atmosphere is a blanket of air made up of a mixture of<br />
gases that surrounds the Earth and reaches almost 350 miles<br />
from the surface of the Earth. This mixture is in constant<br />
motion. If the atmosphere were visible, it might look like<br />
an ocean with swirls and eddies, rising and falling air, and<br />
waves that travel for great distances.<br />
Life on Earth is supported by the atmosphere, solar energy,<br />
and the planet’s magnetic fields. The atmosphere absorbs<br />
energy from the Sun, recycles water and other chemicals, and<br />
works with the electrical and magnetic forces to provide a<br />
moderate climate. The atmosphere also protects life on Earth<br />
from high energy radiation and the frigid vacuum of space.<br />
1%<br />
21%<br />
78%<br />
Oxygen<br />
Nitrogen<br />
Composition of the Atmosphere<br />
In any given volume of air, nitrogen accounts for 78 percent<br />
of the gases that comprise the atmosphere, while oxygen<br />
makes up 21 percent. Argon, carbon dioxide, and traces of<br />
other gases make up the remaining one percent. This cubic<br />
foot also contains some water vapor, varying from zero to<br />
about five percent by volume. This small amount of water<br />
vapor is responsible for major changes in the weather.<br />
[Figure <strong>11</strong>-1]<br />
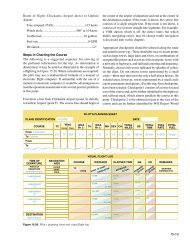
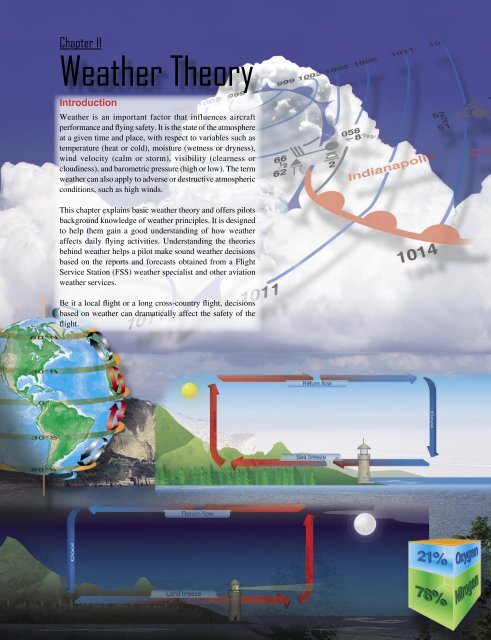
The envelope of gases surrounding the Earth changes<br />
from the ground up. Four distinct layers or spheres of the<br />
atmosphere have been identified using thermal characteristics<br />
Figure <strong>11</strong>-1. Composition of the atmosphere.<br />
(temperature changes), chemical composition, movement,<br />
and density. [Figure <strong>11</strong>-2]<br />
The first layer, known as the troposphere, extends from sea<br />
level up to 20,000 feet (8 kilometers (km)) over the northern<br />
and southern poles and up to 48,000 feet (14.5 km) over the<br />
equatorial regions. The vast majority of weather, clouds,<br />
storms, and temperature variances occur within this first layer<br />
of the atmosphere. Inside the troposphere, the temperature<br />
decreases at a rate of about 2 °Celsius (C) every 1,000 feet<br />
of altitude gain, and the pressure decreases at a rate of about<br />
one inch per 1,000 feet of altitude gain.<br />
Thermosphere<br />
Mesosphere<br />
<strong>St</strong>ratosphere<br />
Troposphere<br />
280,000 feet<br />
160,000 feet<br />
20,000 feet<br />
Figure <strong>11</strong>-2. Layers of the atmosphere.<br />
<strong>11</strong>-2
At the top of the troposphere is a boundary known as the<br />
tropopause, which traps moisture and the associated weather<br />
in the troposphere. The altitude of the tropopause varies with<br />
latitude and with the season of the year; therefore, it takes<br />
on an elliptical shape, as opposed to round. Location of the<br />
tropopause is important because it is commonly associated<br />
with the location of the jet stream and possible clear air<br />
turbulence.<br />
Above the tropopause are three more atmospheric levels. The<br />
first is the stratosphere, which extends from the tropopause to<br />
a height of about 160,000 feet (50 km). Little weather exists<br />
in this layer and the air remains stable although certain types<br />
of clouds occasionally extend in it. Above the stratosphere<br />
are the mesosphere and thermosphere which have little<br />
influence over weather.<br />
Atmospheric Circulation<br />
As noted earlier, the atmosphere is in constant motion.<br />
Certain factors combine to set the atmosphere in motion, but a<br />
major factor is the uneven heating of the Earth’s surface. This<br />
heating upsets the equilibrium of the atmosphere, creating<br />
changes in air movement and atmospheric pressure. The<br />
movement of air around the surface of the Earth is called<br />
atmospheric circulation.<br />
Heating of the Earth’s surface is accomplished by several<br />
processes, but in the simple convection-only model used for<br />
this discussion, the Earth is warmed by energy radiating from<br />
the sun. The process causes a circular motion that results<br />
when warm air rises and is replaced by cooler air.<br />
Warm air rises because heat causes air molecules to spread<br />
apart. As the air expands, it becomes less dense and lighter<br />
than the surrounding air. As air cools, the molecules pack<br />
together more closely, becoming denser and heavier than<br />
warm air. As a result, cool, heavy air tends to sink and replace<br />
warmer, rising air.<br />
Because the Earth has a curved surface that rotates on a tilted<br />
axis while orbiting the sun, the equatorial regions of the Earth<br />
receive a greater amount of heat from the sun than the polar<br />
regions. The amount of sun that heats the Earth depends on<br />
the time of year and the latitude of the specific region. All of<br />
these factors affect the length of time and the angle at which<br />
sunlight strikes the surface.<br />
Solar heating causes higher temperatures in equatorial areas<br />
which causes the air to be less dense and rise. As the warm<br />
air flows toward the poles, it cools, becoming denser, and<br />
sinks back toward the surface. [Figure <strong>11</strong>-3]<br />
Figure <strong>11</strong>-3. Circulation pattern in a static environment.<br />
Atmospheric Pressure<br />
The unequal heating of the Earth’s surface not only modifies<br />
air density and creates circulation patterns; it also causes<br />
changes in air pressure or the force exerted by the weight<br />
of air molecules. Although air molecules are invisible, they<br />
still have weight and take up space.<br />
Imagine a sealed column of air that has a footprint of one<br />
square inch and is 350 miles high. It would take 14.7 pounds<br />
of effort to lift that column. This represents the air’s weight;<br />
if the column is shortened, the pressure exerted at the bottom<br />
(and its weight) would be less.<br />
The weight of the shortened column of air at 18,000 feet is<br />
approximately 7.4 pounds; almost 50 percent that at sea level.<br />
For instance, if a bathroom scale (calibrated for sea level)<br />
were raised to 18,000 feet, the column of air weighing 14.7<br />
pounds at sea level would be 18,000 feet shorter, and would<br />
weigh approximately 7.3 pounds (50 percent) less than at<br />
sea level. [Figure <strong>11</strong>-4]<br />
The actual pressure at a given place and time differs with<br />
altitude, temperature, and density of the air. These conditions<br />
also affect aircraft performance, especially with regard to<br />
takeoff, rate of climb, and landings.<br />
Coriolis Force<br />
In general atmospheric circulation theory, areas of low<br />
pressure exist over the equatorial regions and areas of high<br />
pressure exist over the polar regions due to a difference in<br />
temperature. The resulting low pressure allows the highpressure<br />
air at the poles to flow along the planet’s surface<br />
<strong>11</strong>-3
14.7 lb<br />
1Square Inch<br />
1Square Inch<br />
1Square Inch<br />
1<br />
1Square Inch<br />
18,000 feet<br />
7.4 lb<br />
1<br />
Sea level<br />
Figure <strong>11</strong>-5. Three-cell circulation pattern due to the rotation of<br />
the Earth.<br />
Figure <strong>11</strong>-4. Atmosphere weights.<br />
toward the equator. While this pattern of air circulation is<br />
correct in theory, the circulation of air is modified by several<br />
forces, the most important of which is the rotation of the<br />
Earth.<br />
The force created by the rotation of the Earth is known as<br />
the Coriolis force. This force is not perceptible to humans as<br />
they walk around because humans move slowly and travel<br />
relatively short distances compared to the size and rotation<br />
rate of the Earth. However, the Coriolis force significantly<br />
affects bodies that move over great distances, such as an air<br />
mass or body of water.<br />
The Coriolis force deflects air to the right in the Northern<br />
Hemisphere, causing it to follow a curved path instead of a<br />
straight line. The amount of deflection differs depending on<br />
the latitude. It is greatest at the poles, and diminishes to zero<br />
at the equator. The magnitude of Coriolis force also differs<br />
with the speed of the moving body—the greater the speed,<br />
the greater the deviation. In the Northern Hemisphere, the<br />
rotation of the Earth deflects moving air to the right and<br />
changes the general circulation pattern of the air.<br />
The speed of the Earth’s rotation causes the general flow<br />
to break up into three distinct cells in each hemisphere.<br />
[Figure <strong>11</strong>-5] In the Northern Hemisphere, the warm air at<br />
the equator rises upward from the surface, travels northward,<br />
and is deflected eastward by the rotation of the Earth. By<br />
the time it has traveled one-third of the distance from the<br />
equator to the North Pole, it is no longer moving northward,<br />
but eastward. This air cools and sinks in a belt-like area at<br />
about 30° latitude, creating an area of high pressure as it<br />
sinks toward the surface. Then, it flows southward along<br />
the surface back toward the equator. Coriolis force bends<br />
the flow to the right, thus creating the northeasterly trade<br />
winds that prevail from 30° latitude to the equator. Similar<br />
forces create circulation cells that encircle the Earth between<br />
30° and 60° latitude, and between 60° and the poles. This<br />
circulation pattern results in the prevailing westerly winds<br />
in the conterminous United <strong>St</strong>ates.<br />
Circulation patterns are further complicated by seasonal<br />
changes, differences between the surfaces of continents and<br />
oceans, and other factors such as frictional forces caused<br />
by the topography of the Earth’s surface which modify the<br />
movement of the air in the atmosphere. For example, within<br />
2,000 feet of the ground, the friction between the surface and<br />
the atmosphere slows the moving air. The wind is diverted from<br />
its path because the frictional force reduces the Coriolis force.<br />
Thus, the wind direction at the surface varies somewhat from<br />
the wind direction just a few thousand feet above the Earth.<br />
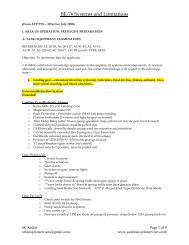
Measurement of Atmosphere Pressure<br />
Atmospheric pressure is typically measured in inches of<br />
mercury ("Hg) by a mercurial barometer. [Figure <strong>11</strong>-6] The<br />
barometer measures the height of a column of mercury inside a<br />
glass tube. A section of the mercury is exposed to the pressure<br />
of the atmosphere, which exerts a force on the mercury. An<br />
increase in pressure forces the mercury to rise inside the tube.<br />
When the pressure drops, mercury drains out of the tube,<br />
decreasing the height of the column. This type of barometer is<br />
typically used in a laboratory or weather observation station,<br />
is not easily transported, and difficult to read.<br />
<strong>11</strong>-4
Height of mercury<br />
(760 mm)<br />
29.92"<br />
At sea level in a standard<br />
atmosphere, the weight<br />
of the atmosphere<br />
(14.7 lb/in 2 ) supports<br />
a column of mercury<br />
29.92 inches high.<br />
Atmospheric pressure<br />
Sea level<br />
To provide a common reference, the International <strong>St</strong>andard<br />
Atmosphere (ISA) has been established. These standard<br />
conditions are the basis for certain flight instruments and<br />
most aircraft performance data. <strong>St</strong>andard sea level pressure<br />
is defined as 29.92 "Hg and a standard temperature of 59 °F<br />
(15 °C). Atmospheric pressure is also reported in millibars<br />
(mb), with 1 "Hg equal to approximately 34 mb. <strong>St</strong>andard sea<br />
level pressure is 1,013.2 mb. Typical mb pressure readings<br />
range from 950.0 to 1,040.0 mb. Constant pressure charts and<br />
hurricane pressure reports are written using mb.<br />
Since weather stations are located around the globe, all local<br />
barometric pressure readings are converted to a sea level<br />
pressure to provide a standard for records and reports. To<br />
achieve this, each station converts its barometric pressure by<br />
adding approximately 1 "Hg for every 1,000 feet of elevation.<br />
For example, a station at 5,000 feet above sea level, with a<br />
reading of 24.92 "Hg, reports a sea level pressure reading of<br />
29.92 "Hg. [Figure <strong>11</strong>-8] Using common sea level pressure<br />
readings helps ensure aircraft altimeters are set correctly,<br />
based on the current pressure readings.<br />
29.92 "Hg = 1,013.2 mb (hPa) = 14.7 lb/in 2<br />
Figure <strong>11</strong>-6. Mercurial barometer.<br />
An aneroid barometer is an alternative to a mercurial<br />
barometer; it is easier to read and transport. [Figure <strong>11</strong>-7] The<br />
aneroid barometer contains a closed vessel, called an aneroid<br />
cell that contracts or expands with changes in pressure. The<br />
aneroid cell attaches to a pressure indicator with a mechanical<br />
linkage to provide pressure readings. The pressure sensing<br />
part of an aircraft altimeter is essentially an aneroid<br />
barometer. It is important to note that due to the linkage<br />
mechanism of an aneroid barometer, it is not as accurate as<br />
a mercurial barometer.<br />
Higher<br />
By tracking barometric pressure trends across a large area,<br />
weather forecasters can more accurately predict movement<br />
of pressure systems and the associated weather. For example,<br />
tracking a pattern of rising pressure at a single weather station<br />
generally indicates the approach of fair weather. Conversely,<br />
decreasing or rapidly falling pressure usually indicates<br />
approaching bad weather and, possibly, severe storms.<br />
Altitude and Atmospheric Pressure<br />
As altitude increases, atmospheric pressure decreases. On<br />
average, with every 1,000 feet of increase in altitude, the<br />
atmospheric pressure decreases 1 "Hg. As pressure decreases,<br />
the air becomes less dense or “thinner.” This is the equivalent<br />
of being at a higher altitude and is referred to as density<br />
altitude (DA). As pressure decreases, DA increases and has<br />
a pronounced effect on aircraft performance.<br />
Atmospheric pressure<br />
Sealed aneroid cell<br />
Sealed aneroid cell<br />
Lower<br />
Differences in air density caused by changes in temperature<br />
result in a change in pressure. This, in turn, creates motion in<br />
the atmosphere, both vertically and horizontally, in the form<br />
of currents and wind. The atmosphere is almost constantly<br />
in motion as it strives to reach equilibrium. These neverending<br />
air movements set up chain reactions which cause a<br />
continuing variety in the weather.<br />
Sealed aneroid cell<br />
Figure <strong>11</strong>-7. Aneroid barometer.<br />
<strong>11</strong>-5
<strong>St</strong>ation Pressure<br />
Denver<br />
24.92 "Hg<br />
<strong>St</strong>andard Atmosphere<br />
<strong>St</strong>ation Pressure<br />
New Orleans<br />
29.92 "Hg<br />
Denver 29.92 "Hg<br />
New Orleans 29.92 "Hg<br />
Figure <strong>11</strong>-8. <strong>St</strong>ation pressure is converted to and reported in sea level pressure.<br />
Altitude and Flight<br />
Altitude affects every aspect of flight from aircraft<br />
performance to human performance. At higher altitudes,<br />
with a decreased atmospheric pressure, takeoff and landing<br />
distances are increased, as are climb rates.<br />
When an aircraft takes off, lift must be developed by the<br />
flow of air around the wings. If the air is thin, more speed<br />
is required to obtain enough lift for takeoff; therefore, the<br />
ground run is longer. An aircraft that requires 745 feet of<br />
ground run at sea level requires more than double that at a<br />
pressure altitude of 8,000 feet. [Figure <strong>11</strong>-9]. It is also true<br />
that at higher altitudes, due to the decreased density of the<br />
air, aircraft engines and propellers are less efficient. This<br />
leads to reduced rates of climb and a greater ground run for<br />
obstacle clearance.<br />
Altitude and the Human Body<br />
As discussed earlier, nitrogen and other trace gases make<br />
up 79 percent of the atmosphere, while the remaining 21<br />
Pressure Altitude: Sea level<br />
TAKEOFF DISTANCE<br />
MAXIMUM WEIGHT 2,400 LB<br />
Pressure<br />
altitude<br />
(feet)<br />
Ground<br />
roll<br />
(feet)<br />
0 °C<br />
Total feet<br />
to clear<br />
50 foot obstacle<br />
745 feet<br />
Pressure Altitude: 8,000 feet<br />
S.L.<br />
1,000<br />
2,000<br />
3,000<br />
4,000<br />
5,000<br />
6,000<br />
7,000<br />
8,000<br />
745<br />
815<br />
895<br />
980<br />
1,075<br />
1,185<br />
1,305<br />
1,440<br />
1,590<br />
1,320<br />
1,445<br />
1,585<br />
1,740<br />
1,920<br />
2,125<br />
2,360<br />
2,635<br />
2,960<br />
1,590 feet<br />
Figure <strong>11</strong>-9. Takeoff distances increase with increased altitude.<br />
<strong>11</strong>-6
percent is life sustaining, atmospheric oxygen. At sea level,<br />
atmospheric pressure is great enough to support normal<br />
growth, activity, and life. By 18,000 feet, the partial pressure<br />
of oxygen is reduced and adversely affects the normal<br />
activities and functions of the human body.<br />
The reactions of the average person become impaired at an<br />
altitude of about 10,000 feet, but for some people impairment<br />
can occur at an altitude as low as 5,000 feet. The physiological<br />
reactions to hypoxia or oxygen deprivation are insidious and<br />
affect people in different ways. These symptoms range from<br />
mild disorientation to total incapacitation, depending on<br />
body tolerance and altitude. Supplemental oxygen or cabin<br />
pressurization systems help pilots fly at higher altitudes and<br />
overcome the effects of oxygen deprivation.<br />
Wind and Currents<br />
Air flows from areas of high pressure into areas of low<br />
pressure because air always seeks out lower pressure. Air<br />
pressure, temperature changes, and the Coriolis force work in<br />
combination to create two kinds of motion in the atmosphere—<br />
vertical movement of ascending and descending currents,<br />
and horizontal movement in the form of wind. Currents and<br />
winds are important as they affect takeoff, landing, and cruise<br />
flight operations. Most importantly, currents and winds or<br />
atmospheric circulation cause weather changes.<br />
Wind Patterns<br />
In the Northern Hemisphere, the flow of air from areas of<br />
high to low pressure is deflected to the right and produces<br />
a clockwise circulation around an area of high pressure.<br />
This is known as anticyclonic circulation. The opposite<br />
is true of low-pressure areas; the air flows toward a low<br />
and is deflected to create a counterclockwise or cyclonic<br />
circulation. [Figure <strong>11</strong>-10]<br />
High pressure systems are generally areas of dry, stable,<br />
descending air. Good weather is typically associated with<br />
high pressure systems for this reason. Conversely, air flows<br />
into a low pressure area to replace rising air. This air tends<br />
to be unstable, and usually brings increasing cloudiness and<br />
precipitation. Thus, bad weather is commonly associated<br />
with areas of low pressure.<br />
A good understanding of high and low pressure wind patterns<br />
can be of great help when planning a flight, because a pilot<br />
can take advantage of beneficial tailwinds. [Figure <strong>11</strong>-<strong>11</strong>]<br />
When planning a flight from west to east, favorable winds<br />
would be encountered along the northern side of a high<br />
pressure system or the southern side of a low pressure system.<br />
On the return flight, the most favorable winds would be along<br />
the southern side of the same high pressure system or the<br />
northern side of a low pressure system. An added advantage<br />
Figure <strong>11</strong>-10. Circulation pattern about areas of high and low<br />
pressure.<br />
is a better understanding of what type of weather to expect<br />
in a given area along a route of flight based on the prevailing<br />
areas of highs and lows.<br />
While the theory of circulation and wind patterns is accurate<br />
for large scale atmospheric circulation, it does not take into<br />
account changes to the circulation on a local scale. Local<br />
conditions, geological features, and other anomalies can<br />
change the wind direction and speed close to the Earth’s<br />
surface.<br />
Convective Currents<br />
Different surfaces radiate heat in varying amounts. Plowed<br />
ground, rocks, sand, and barren land give off a large amount of<br />
heat; water, trees, and other areas of vegetation tend to absorb<br />
and retain heat. The resulting uneven heating of the air creates<br />
small areas of local circulation called convective currents.<br />
Convective currents cause the bumpy, turbulent air sometimes<br />
experienced when flying at lower altitudes during warmer<br />
weather. On a low altitude flight over varying surfaces,<br />
updrafts are likely to occur over pavement or barren places,<br />
and downdrafts often occur over water or expansive areas<br />
of vegetation like a group of trees. Typically, these turbulent<br />
conditions can be avoided by flying at higher altitudes, even<br />
above cumulus cloud layers. [Figure <strong>11</strong>-12]<br />
Convective currents are particularly noticeable in areas with<br />
a land mass directly adjacent to a large body of water, such<br />
as an ocean, large lake, or other appreciable area of water.<br />
During the day, land heats faster than water, so the air over the<br />
land becomes warmer and less dense. It rises and is replaced<br />
<strong>11</strong>-7
Figure <strong>11</strong>-<strong>11</strong>. Favorable winds near a high pressure system.<br />
Figure <strong>11</strong>-12. Convective turbulence avoidance.<br />
by cooler, denser air flowing in from over the water. This<br />
causes an onshore wind, called a sea breeze. Conversely, at<br />
night land cools faster than water, as does the corresponding<br />
air. In this case, the warmer air over the water rises and is<br />
replaced by the cooler, denser air from the land, creating an<br />
offshore wind called a land breeze. This reverses the local<br />
wind circulation pattern. Convective currents can occur<br />
anywhere there is an uneven heating of the Earth’s surface.<br />
[Figure <strong>11</strong>-13]<br />
Convective currents close to the ground can affect a pilot’s<br />
ability to control the aircraft. For example, on final approach,<br />
the rising air from terrain devoid of vegetation sometimes<br />
produces a ballooning effect that can cause a pilot to<br />
overshoot the intended landing spot. On the other hand,<br />
an approach over a large body of water or an area of thick<br />
vegetation tends to create a sinking effect that can cause<br />
an unwary pilot to land short of the intended landing spot.<br />
[Figure <strong>11</strong>-14]<br />
Effect of Obstructions on Wind<br />
Another atmospheric hazard exists that can create problems<br />
for pilots. Obstructions on the ground affect the flow of<br />
wind and can be an unseen danger. Ground topography and<br />
large buildings can break up the flow of the wind and create<br />
wind gusts that change rapidly in direction and speed. These<br />
obstructions range from manmade structures like hangars<br />
to large natural obstructions, such as mountains, bluffs, or<br />
canyons. It is especially important to be vigilant when flying<br />
in or out of airports that have large buildings or natural<br />
obstructions located near the runway. [Figure <strong>11</strong>-15]<br />
The intensity of the turbulence associated with ground<br />
obstructions depends on the size of the obstacle and the<br />
primary velocity of the wind. This can affect the takeoff and<br />
landing performance of any aircraft and can present a very<br />
serious hazard. During the landing phase of flight, an aircraft<br />
<strong>11</strong>-8
Return flow<br />
Cool<br />
Warm<br />
Cool<br />
Sea breeze<br />
Return flow<br />
Warm<br />
Land breeze<br />
Figure <strong>11</strong>-13. Sea breeze and land breeze wind circulation patterns.<br />
Cool<br />
sinking<br />
air<br />
Warm<br />
rising<br />
air<br />
Intended Flightpath<br />
Figure <strong>11</strong>-14. Currents generated by varying surface conditions.<br />
<strong>11</strong>-9
W I N D<br />
Figure <strong>11</strong>-15. Turbulence caused by manmade obstructions.<br />
may “drop in” due to the turbulent air and be too low to clear<br />
obstacles during the approach.<br />
This same condition is even more noticeable when flying in<br />
mountainous regions. [Figure <strong>11</strong>-16] While the wind flows<br />
smoothly up the windward side of the mountain and the<br />
upward currents help to carry an aircraft over the peak of<br />
the mountain, the wind on the leeward side does not act in<br />
a similar manner. As the air flows down the leeward side of<br />
the mountain, the air follows the contour of the terrain and<br />
is increasingly turbulent. This tends to push an aircraft into<br />
the side of a mountain. The stronger the wind, the greater the<br />
downward pressure and turbulence become.<br />
Due to the effect terrain has on the wind in valleys or canyons,<br />
downdrafts can be severe. Before conducting a flight in or<br />
near mountainous terrain, it is helpful for a pilot unfamiliar<br />
with a mountainous area to get a checkout with a mountain<br />
qualified flight instructor.<br />
Figure <strong>11</strong>-16. Turbulence in mountainous regions.<br />
<strong>11</strong>-10
Low-Level Wind Shear<br />
Wind shear is a sudden, drastic change in wind speed and/or<br />
direction over a very small area. Wind shear can subject an<br />
aircraft to violent updrafts and downdrafts, as well as abrupt<br />
changes to the horizontal movement of the aircraft. While<br />
wind shear can occur at any altitude, low-level wind shear is<br />
especially hazardous due to the proximity of an aircraft to the<br />
ground. Directional wind changes of 180° and speed changes<br />
of 50 knots or more are associated with low-level wind shear.<br />
Low-level wind shear is commonly associated with passing<br />
frontal systems, thunderstorms, and temperature inversions<br />
with strong upper level winds (greater than 25 knots).<br />
Wind shear is dangerous to an aircraft for several reasons. The<br />
rapid changes in wind direction and velocity change the wind’s<br />
relation to the aircraft disrupting the normal flight attitude and<br />
performance of the aircraft. During a wind shear situation,<br />
the effects can be subtle or very dramatic depending on wind<br />
speed and direction of change. For example, a tailwind that<br />
quickly changes to a headwind causes an increase in airspeed<br />
and performance. Conversely, when a headwind changes<br />
to a tailwind, the airspeed rapidly decreases and there is a<br />
corresponding decrease in performance. In either case, a<br />
pilot must be prepared to react immediately to the changes<br />
to maintain control of the aircraft.<br />
In general, the most severe type of low-level wind shear<br />
is associated with convective precipitation or rain from<br />
thunderstorms. One critical type of shear associated with<br />
convective precipitation is known as a microburst. A typical<br />
microburst occurs in a space of less than one mile horizontally<br />
and within 1,000 feet vertically. The lifespan of a microburst<br />
is about 15 minutes during which it can produce downdrafts<br />
of up to 6,000 feet per minute (fpm). It can also produce a<br />
hazardous wind direction change of 45 degrees or more, in<br />
a matter of seconds.<br />
When encountered close to the ground, these excessive<br />
downdrafts and rapid changes in wind direction can<br />
produce a situation in which it is difficult to control the<br />
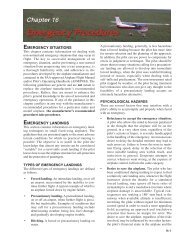
aircraft. [Figure <strong>11</strong>-17] During an inadvertent takeoff into<br />
a microburst, the plane first experiences a performanceincreasing<br />
headwind (1), followed by performance-decreasing<br />
downdrafts (2). Then, the wind rapidly shears to a tailwind<br />
(3), and can result in terrain impact or flight dangerously<br />
close to the ground (4).<br />
Microbursts are often difficult to detect because they occur<br />
in relatively confined areas. In an effort to warn pilots of<br />
low-level wind shear, alert systems have been installed at<br />
several airports around the country. A series of anemometers,<br />
placed around the airport, form a net to detect changes in<br />
wind speeds. When wind speeds differ by more than 15 knots,<br />
a warning for wind shear is given to pilots. This system is<br />
known as the low-level wind shear alert system (LLWAS).<br />
It is important to remember that wind shear can affect any<br />
flight and any pilot at any altitude. While wind shear may be<br />
reported, it often remains undetected and is a silent danger<br />
to aviation. Always be alert to the possibility of wind shear,<br />
especially when flying in and around thunderstorms and<br />
frontal systems.<br />
Wind and Pressure Representation on Surface<br />
<strong>Weather</strong> Maps<br />
Surface weather maps provide information about fronts, areas<br />
of high and low pressure, and surface winds and pressures<br />
for each station. This type of weather map allows pilots to<br />
<strong>St</strong>rong downdraft<br />
Intended Path<br />
Increasing headwind<br />
Increasing tailwind<br />
2<br />
Outflow<br />
Outflow<br />
1<br />
3<br />
4<br />
Figure <strong>11</strong>-17. Effects of a microburst wind.<br />
<strong>11</strong>-<strong>11</strong>
see the locations of fronts and pressure systems, but more<br />
importantly, it depicts the wind and pressure at the surface<br />
for each location. For more information on surface analysis<br />
and weather depiction charts, see <strong>Ch</strong>apter 12, <strong>Weather</strong><br />
Aviation <strong>Services</strong>.<br />
Wind conditions are reported by an arrow attached to the<br />
station location circle. [Figure <strong>11</strong>-18] The station circle<br />
represents the head of the arrow, with the arrow pointing<br />
in the direction from which the wind is blowing. Winds<br />
are described by the direction from which they blow, thus<br />
a northwest wind means that the wind is blowing from the<br />
northwest toward the southeast. The speed of the wind is<br />
depicted by barbs or pennants placed on the wind line. Each<br />
barb represents a speed of ten knots, while half a barb is equal<br />
to five knots, and a pennant is equal to 50 knots.<br />
Calm<br />
NW/5 kts<br />
SW/20 kts<br />
1020<br />
1024<br />
1020<br />
1016<br />
Isobars<br />
1012<br />
Isobars<br />
Widely spaced isobars<br />
mean a shallow pressure<br />
gradient and relatively<br />
light winds.<br />
Closely spaced isobars mean a steep<br />
pressure gradient and strong winds.<br />
L<br />
1008<br />
Figure <strong>11</strong>-19. Isobars reveal the pressure gradient of an area of<br />
high- or low-pressure areas.<br />
E/35 kts N/50 kts W/105 kts<br />
Figure <strong>11</strong>-18. Depiction of winds on a surface weather chart.<br />
The pressure for each station is recorded on the weather chart<br />
and is shown in mb. Isobars are lines drawn on the chart to<br />
depict areas of equal pressure. These lines result in a pattern<br />
that reveals the pressure gradient or change in pressure over<br />
distance. [Figure <strong>11</strong>-19] Isobars are similar to contour lines<br />
on a topographic map that indicate terrain altitudes and<br />
slope steepness. For example, isobars that are closely spaced<br />
indicate a steep wind gradient and strong winds prevail.<br />
Shallow gradients, on the other hand, are represented by<br />
isobars that are spaced far apart, and are indicative of light<br />
winds. Isobars help identify low and high pressure systems<br />
as well as the location of ridges, troughs, and cut-off lows<br />
(cols). A high is an area of high pressure surrounded by<br />
lower pressure; a low is an area of low pressure surrounded<br />
by higher pressure. A ridge is an elongated area of high<br />
pressure, and a trough is an elongated area of low pressure.<br />
A col is the intersection between a ridge and a trough, or an<br />
area of neutrality between two highs or two lows.<br />
Isobars furnish valuable information about winds in the first<br />
few thousand feet above the surface. Close to the ground,<br />
wind direction is modified by the surface and wind speed<br />
decreases due to friction with the surface. At levels 2,000 to<br />
3,000 feet above the surface, however, the speed is greater<br />
and the direction becomes more parallel to the isobars.<br />
Therefore, the surface winds are shown on the weather map,<br />
as well as the winds at a slightly higher altitude.<br />
Generally, the wind 2,000 feet above ground level (AGL) is<br />
20° to 40° to the right of surface winds, and the wind speed<br />
is greater. The change of wind direction is greatest over rough<br />
terrain and least over flat surfaces, such as open water. In the<br />
absence of winds aloft information, this rule of thumb allows<br />
for a rough estimate of the wind conditions a few thousand<br />
feet above the surface.<br />
Atmospheric <strong>St</strong>ability<br />
The stability of the atmosphere depends on its ability to<br />
resist vertical motion. A stable atmosphere makes vertical<br />
movement difficult, and small vertical disturbances dampen<br />
out and disappear. In an unstable atmosphere, small vertical<br />
air movements tend to become larger, resulting in turbulent<br />
airflow and convective activity. Instability can lead to<br />
significant turbulence, extensive vertical clouds, and severe<br />
weather.<br />
Rising air expands and cools due to the decrease in air<br />
pressure as altitude increases. The opposite is true of<br />
descending air; as atmospheric pressure increases, the<br />
temperature of descending air increases as it is compressed.<br />
Adiabatic heating and adiabatic cooling are terms used to<br />
describe this temperature change.<br />
<strong>11</strong>-12
The adiabatic process takes place in all upward and<br />
downward moving air. When air rises into an area of lower<br />
pressure, it expands to a larger volume. As the molecules<br />
of air expand, the temperature of the air lowers. As a result,<br />
when a parcel of air rises, pressure decreases, volume<br />
increases, and temperature decreases. When air descends,<br />
the opposite is true. The rate at which temperature decreases<br />
with an increase in altitude is referred to as its lapse rate.<br />
As air ascends through the atmosphere, the average rate of<br />
temperature change is 2 °C (3.5 °F) per 1,000 feet.<br />
Since water vapor is lighter than air, moisture decreases air<br />
density, causing it to rise. Conversely, as moisture decreases,<br />
air becomes denser and tends to sink. Since moist air cools at a<br />
slower rate, it is generally less stable than dry air since the moist<br />
air must rise higher before its temperature cools to that of the<br />
surrounding air. The dry adiabatic lapse rate (unsaturated air)<br />
is 3 °C (5.4 °F) per 1,000 feet. The moist adiabatic lapse rate<br />
varies from 1.1 °C to 2.8 °C (2 °F to 5 °F) per 1,000 feet.<br />
The combination of moisture and temperature determine the<br />
stability of the air and the resulting weather. Cool, dry air<br />
is very stable and resists vertical movement, which leads to<br />
good and generally clear weather. The greatest instability<br />
occurs when the air is moist and warm, as it is in the tropical<br />
regions in the summer. Typically, thunderstorms appear on<br />
a daily basis in these regions due to the instability of the<br />
surrounding air.<br />
Inversion<br />
As air rises and expands in the atmosphere, the temperature<br />
decreases. There is an atmospheric anomaly that can occur;<br />
however, that changes this typical pattern of atmospheric<br />
behavior. When the temperature of the air rises with altitude, a<br />
temperature inversion exists. Inversion layers are commonly<br />
shallow layers of smooth, stable air close to the ground. The<br />
temperature of the air increases with altitude to a certain<br />
point, which is the top of the inversion. The air at the top<br />
of the layer acts as a lid, keeping weather and pollutants<br />
trapped below. If the relative humidity of the air is high, it<br />
can contribute to the formation of clouds, fog, haze, or smoke,<br />
resulting in diminished visibility in the inversion layer.<br />
Surface based temperature inversions occur on clear, cool<br />
nights when the air close to the ground is cooled by the<br />
lowering temperature of the ground. The air within a few<br />
hundred feet of the surface becomes cooler than the air above<br />
it. Frontal inversions occur when warm air spreads over a<br />
layer of cooler air, or cooler air is forced under a layer of<br />
warmer air.<br />
Moisture and Temperature<br />
The atmosphere, by nature, contains moisture in the form<br />
of water vapor. The amount of moisture present in the<br />
atmosphere is dependent upon the temperature of the air.<br />
Every 20 °F increase in temperature doubles the amount of<br />
moisture the air can hold. Conversely, a decrease of 20 °F<br />
cuts the capacity in half.<br />
Water is present in the atmosphere in three states: liquid,<br />
solid, and gaseous. All three forms can readily change to<br />
another, and all are present within the temperature ranges of<br />
the atmosphere. As water changes from one state to another,<br />
an exchange of heat takes place. These changes occur through<br />
the processes of evaporation, sublimation, condensation,<br />
deposition, melting, or freezing. However, water vapor<br />
is added into the atmosphere only by the processes of<br />
evaporation and sublimation.<br />
Evaporation is the changing of liquid water to water vapor.<br />
As water vapor forms, it absorbs heat from the nearest<br />
available source. This heat exchange is known as the latent<br />
heat of evaporation. A good example is the evaporation of<br />
human perspiration. The net effect is a cooling sensation<br />
as heat is extracted from the body. Similarly, sublimation<br />
is the changing of ice directly to water vapor, completely<br />
bypassing the liquid stage. Though dry ice is not made of<br />
water, but rather carbon dioxide, it demonstrates the principle<br />
of sublimation, when a solid turns directly into vapor.<br />
Relative Humidity<br />
Humidity refers to the amount of water vapor present in the<br />
atmosphere at a given time. Relative humidity is the actual<br />
amount of moisture in the air compared to the total amount of<br />
moisture the air could hold at that temperature. For example,<br />
if the current relative humidity is 65 percent, the air is<br />
holding 65 percent of the total amount of moisture that it is<br />
capable of holding at that temperature and pressure. While<br />
much of the western United <strong>St</strong>ates rarely sees days of high<br />
humidity, relative humidity readings of 75 to 90 percent are<br />
not uncommon in the southern United <strong>St</strong>ates during warmer<br />
months. [Figure <strong>11</strong>-20]<br />
Temperature/Dew Point Relationship<br />
The relationship between dew point and temperature defines<br />
the concept of relative humidity. The dew point, given in<br />
degrees, is the temperature at which the air can hold no<br />
more moisture. When the temperature of the air is reduced<br />
to the dew point, the air is completely saturated and moisture<br />
begins to condense out of the air in the form of fog, dew,<br />
frost, clouds, rain, hail, or snow.<br />
<strong>11</strong>-13