Rietveld Refinement from Powder Diffraction Data - Max Planck ...
Rietveld Refinement from Powder Diffraction Data - Max Planck ...
Rietveld Refinement from Powder Diffraction Data - Max Planck ...

Create successful ePaper yourself
Turn your PDF publications into a flip-book with our unique Google optimized e-Paper software.
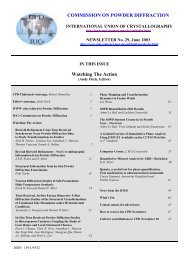
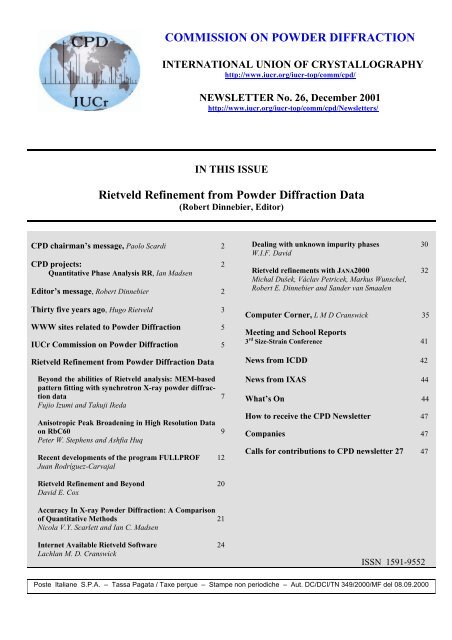
COMMISSION ON POWDER DIFFRACTION<br />
INTERNATIONAL UNION OF CRYSTALLOGRAPHY<br />
http://www.iucr.org/iucr-top/comm/cpd/<br />
NEWSLETTER No. 26, December 2001<br />
http://www.iucr.org/iucr-top/comm/cpd/Newsletters/<br />
IN THIS ISSUE<br />
<strong>Rietveld</strong> <strong>Refinement</strong> <strong>from</strong> <strong>Powder</strong> <strong>Diffraction</strong> <strong>Data</strong><br />
(Robert Dinnebier, Editor)<br />
CPD chairman’s message, Paolo Scardi 2<br />
CPD projects: 2<br />
Quantitative Phase Analysis RR, Ian Madsen<br />
Editor’s message, Robert Dinnebier 2<br />
Thirty five years ago, Hugo <strong>Rietveld</strong> 3<br />
WWW sites related to <strong>Powder</strong> <strong>Diffraction</strong> 5<br />
IUCr Commission on <strong>Powder</strong> <strong>Diffraction</strong> 5<br />
<strong>Rietveld</strong> <strong>Refinement</strong> <strong>from</strong> <strong>Powder</strong> <strong>Diffraction</strong> <strong>Data</strong><br />
Beyond the abilities of <strong>Rietveld</strong> analysis: MEM-based<br />
pattern fitting with synchrotron X-ray powder diffraction<br />
data 7<br />
Fujio Izumi and Takuji Ikeda<br />
Anisotropic Peak Broadening in High Resolution <strong>Data</strong><br />
on RbC60 9<br />
Peter W. Stephens and Ashfia Huq<br />
Recent developments of the program FULLPROF 12<br />
Juan Rodríguez-Carvajal<br />
Dealing with unknown impurity phases 30<br />
W.I.F. David<br />
<strong>Rietveld</strong> refinements with JANA2000 32<br />
Michal Dušek, Václav Petricek, Markus Wunschel,<br />
Robert E. Dinnebier and Sander van Smaalen<br />
Computer Corner, L M D Cranswick 35<br />
Meeting and School Reports<br />
3 rd Size-Strain Conference 41<br />
News <strong>from</strong> ICDD 42<br />
News <strong>from</strong> IXAS 44<br />
What’s On 44<br />
How to receive the CPD Newsletter 47<br />
Companies 47<br />
Calls for contributions to CPD newsletter 27 47<br />
<strong>Rietveld</strong> <strong>Refinement</strong> and Beyond 20<br />
David E. Cox<br />
Accuracy In X-ray <strong>Powder</strong> <strong>Diffraction</strong>: A Comparison<br />
of Quantitative Methods 21<br />
Nicola V.Y. Scarlett and Ian C. Madsen<br />
Internet Available <strong>Rietveld</strong> Software 24<br />
Lachlan M. D. Cranswick<br />
ISSN 1591-9552<br />
Poste Italiane S.P.A. – Tassa Pagata / Taxe perçue – Stampe non periodiche – Aut. DC/DCI/TN 349/2000/MF del 08.09.2000
CPD Chairman’s Message 26<br />
The international activity concerning <strong>Powder</strong> <strong>Diffraction</strong> will be quite rich in 2002. The major events are the 8 th European<br />
<strong>Powder</strong> <strong>Diffraction</strong> Conference (EPDIC 8) in Sweden (Uppsala, 20-23 May; http://www.mkem.uu.se/epdic8) and the XIX<br />
IUCr World Congress in Switzerland (Geneva, 6-14 August; http://www.kenes.com/iucr/ ). The programs of two conferences<br />
were designed following different philosophies: while the EPDIC mostly focuses on methodologies, through dedicated sessions,<br />
the IUCr conference includes several sessions (microsymposia) on different PD applications. Despite the vicinity of the<br />
two conferences, attending both is therefore an interesting perspective. Same consideration applies to the 51 st annual Denver<br />
X-ray conference (Colorado Springs, 29.7-2.8.2002, http://www.dxcicdd.com), whose PD program is rich as usual.<br />
In this frame considerable attention will be given to the <strong>Rietveld</strong> method and to the many emerging related applications. The<br />
present issue of the CPD Newsletter is mainly devoted to this broad topic and provides a sufficiently wide variety of new<br />
methods and applications, as well as revision of existing software and algorithms. Even if not exhaustive, this review of recent<br />
developments can be an useful update for experts and a valid starting point for novices; even more so since the scientific articles<br />
which compose the core of the present issue are completed by the detailed review on new software (<strong>Rietveld</strong> method and<br />
other PD software) by Lachlan Cranswick. The issue is enriched by the short introduction by Hugo <strong>Rietveld</strong> who recalls the<br />
early times when the method bearing his name was conceived.<br />
Once more, thanks to guest editor Robert Dinnebier and to the many contributors, we can expect No 26 will be an useful<br />
reading for the nearly 2000 powder diffractionists currently receiving the paper copy, and for the many other who download<br />
the electronic-format newsletter <strong>from</strong> the CPD web site.<br />
Paolo Scardi<br />
CPD projects<br />
Quantitative Phase Analysis Round Robin<br />
The International Union of Crystallography (IUCr) Commission on <strong>Powder</strong> <strong>Diffraction</strong> (CPD) has sponsored a round robin<br />
on the determination of quantitative phase abundance <strong>from</strong> diffraction data. The first of two papers detailing the outcomes of<br />
this study has now been published (Madsen et al, 2001) and the results presented and discussed at APD III (Accuracy in <strong>Powder</strong><br />
<strong>Diffraction</strong> III, 22-25 April 2001, National Institute of Standards and Technology (NIST), Gaithersburg, Maryland, USA).<br />
The aims of the round robin have been detailed in Madsen et al (2001) and summarized in Issue 22 of this newsletter. The first<br />
paper (Madsen et al., 2001) covered the results of sample 1 (a simple three-phase mixture of corundum, fluorite and zincite).<br />
The remaining samples used in the round robin covered a wide range of analytical complexity, and presented a series of different<br />
problems to the analysts. The results pertaining to these samples are discussed in the second paper which is currently in<br />
press. The analytical problems included severe preferred orientation (sample 2), the analysis of amorphous content (sample<br />
3), microabsorption (sample 4), complex synthetic bauxite and natural granodiorite mineral suites along with complex pharmaceutical<br />
mixtures with and without an amorphous component.<br />
The outcomes of the second part of the round robin support the findings of the initial study. The presence of increased analytical<br />
problems within these samples has only served to exacerbate the difficulties experienced by many operators with the<br />
sample 1 suite. The major difficulties are caused by lack of operator expertise and become more apparent with these more<br />
complex samples. Some of these samples also introduced the requirement for skill and judgement in sample preparation techniques.<br />
The second part concluded that the greatest physical obstacle to accurate QPA for X-ray based methods is the presence<br />
of absorption contrast between phases (microabsorption) and may prove to be insurmountable in many circumstances.<br />
Ian Madsen<br />
References<br />
Madsen, I.C., Scarlett, N.V.Y., Cranswick, L.M.D. and Lwin, T. (2001) “Outcomes of the International Union of Crystallography<br />
Commission on <strong>Powder</strong> <strong>Diffraction</strong> Round Robin on Quantitative Phase Analysis: Sample 1A to 1H” J. Appl. Cryst.<br />
(2001), 34, 409-426.<br />
(The paper can be freely downloaded <strong>from</strong> the CPD web-site as an annex to the CPD Newsletter No 25. Courtesy of the IUCr<br />
editorial office.)<br />
2<br />
From the Editor of Newsletter 26<br />
The basic idea behind the <strong>Rietveld</strong> method is to calculate the entire powder pattern using a variety of refinable parameters and<br />
to improve a selection of these parameters by minimizing the weighted sum of the squared differences between the observed<br />
and the calculated powder pattern using least squares methods. That way, the intrinsic problem of the powder diffraction<br />
method with systematic and accidental peak overlap is overcome in a clever way. It was the intention of Hugo <strong>Rietveld</strong>, who<br />
invented the method a few decades ago, to extract as much information as possible <strong>from</strong> a powder pattern. At the beginning<br />
this was mainly restricted to atomic positions <strong>from</strong> neutron diffraction patterns. On the other hand, there is much more information<br />
hidden in a powder pattern which may be subjected to <strong>Rietveld</strong> refinement as the scheme below may illustrate.
Sample<br />
Background<br />
Scattering <strong>from</strong><br />
sample holder,<br />
air etc.<br />
Compton scattering<br />
Thermal diffuse scattering<br />
Amorphous fraction Lattice parameters,<br />
Pair distribution function: Space group:<br />
local order/ disorder<br />
Information content of a powder pattern<br />
Position<br />
Qualitative phase<br />
analysis<br />
Reflections<br />
Intensity<br />
Profile<br />
(FWHM, peak shape)<br />
Instrument<br />
function<br />
Crystal structure<br />
Atomic positions<br />
Temperature factor<br />
Occupancy<br />
(Disorder)<br />
Quantitative<br />
phase analysis<br />
Sample<br />
broadening<br />
Real structure:<br />
Strain,<br />
Domain size,...<br />
Therefore it was only a question of time before<br />
researchers started to extract this information<br />
using <strong>Rietveld</strong>’s algorithm. Nowadays, applications<br />
of the <strong>Rietveld</strong> method range <strong>from</strong> the refinement<br />
of small protein structures to standardless<br />
quantitative phase analysis, the latter being<br />
of significant industrial importance. The availability<br />
of high resolution synchrotron and neutron<br />
radiation with little instrumental contribution<br />
to the line shape enables the analysis of<br />
microstructural properties. As an example, the<br />
special distribution of the lattice strain can be<br />
deduced <strong>from</strong> anisotropic peak broadening during<br />
a <strong>Rietveld</strong> refinement. A lot of information<br />
about defects and disorder is hidden in the background<br />
of a powder pattern and when the normalized<br />
powder diffraction data are Fourier<br />
transformed into real-space coordinates the<br />
atomic pair distribution function can be obtained<br />
which allows one to investigate the local structure<br />
in parallel to the average crystal structure.<br />
Simultaneous <strong>Rietveld</strong> refinements of several datasets can e.g. be used for full texture analysis. In general, fast detectors like<br />
image plate readers in combination with powerful microcomputers reveal a new aspect of <strong>Rietveld</strong>-refinement: time dependence.<br />
By recording full powder patterns in short time intervals, the change of the crystal structure in dependence on pressure,<br />
temperature or during a chemical reaction is monitored and dynamical processes can be visualized. Not to forget that the<br />
Rieveld decomposition formula can be iterated in a way that at the point where calculated structure factors |F| are entered a set<br />
of identical |F| is given instead. The <strong>Rietveld</strong> refinement then calculates a set of "|Fobs|" <strong>from</strong> the decomposition formula,<br />
which are then used as new |Fcalc| and so on, which is generally known as the LeBail method. This trick allows one to separate<br />
the refinement of the profile <strong>from</strong> the refinement of the crystal structure and the extracted intensities can be used for crystal<br />
structure determination. There is still a lot more potential in the method and it is my pleasure to devote an issue of the CPD<br />
newsletter to some of the various aspects of modern <strong>Rietveld</strong> refinement.<br />
Robert Dinnebier<br />
Thirty five years ago<br />
Thirty five years ago in the search for mechanically stable fuel elements for nuclear reactors, the structure of some uranates<br />
had to be determined. Because of the small crystal size only powder diffraction data were available. This restriction was an<br />
immense obstacle, because in those days only single crystal diffraction data could lead to a successful refinement. <strong>Powder</strong> diffraction<br />
was regarded to be obsolete for refining structures, because of the problem of overlap with low symmetry compounds<br />
and at high diffraction angles. Step scanning yielded a powder diagram that showed definite detail in the profile of these overlapping<br />
peaks. The information contained in this detail could however not be extracted by conventional means and one had to<br />
resort to taking the sum of these overlapping peaks as data for the least squares refinement. It was therefore clear that no full<br />
use was made of the information contained in the powder diagram.<br />
My experience with computers, built up over years of doing single crystal diffraction work, gave me a head start in tackling<br />
this problem of extracting the maximum of information <strong>from</strong> a powder diagram. My efforts ultimately led to what is now<br />
known as the <strong>Rietveld</strong> Method. When the method was first reported in Moscow in 1966 at the IUCr Congress, there was hardly<br />
any response. A few years later, when I wrote a more comprehensive computer program, first in Algol 60 and later in Fortran<br />
IV, the demand for the program and its subsequent use increased, but only for neutron powder work. When the program was<br />
adapted to X-ray diffraction by others, in the mid seventies, did the popularity of the <strong>Rietveld</strong> Method grow. I already had<br />
foreseen that it could be used for X-ray data, but due to the lack of an actual problem, I did not pursue it any further.<br />
I am totally amazed looking at the ever increasing use that is being made of the method. Yearly, hundreds of publications use<br />
or refer to the method. What began as a solution for a particular problem, turned out to be a tool of much broader value. Now it<br />
is not only applied to structure refinement, but also to such divers fields as quantitative phase analysis, measurement of strain<br />
and size and the analysis of time-resolved data. I am deeply gratified that I could have been instrumental in reviving the powder<br />
diffraction method. This in itself would have given me enough satisfaction. Receiving the Gregori Aminoff Prize in 1995<br />
<strong>from</strong> The Royal Swedish Academy of Sciences for my work gave an added lustre.<br />
Hugo <strong>Rietveld</strong><br />
3
WWW sites related to powder diffraction<br />
The Commission on <strong>Powder</strong> <strong>Diffraction</strong> (CPD): http://www.iucr.org/iucr-top/comm/cpd/<br />
The International Union of Crystallography (IUCr): http://www.iucr.org<br />
The International Centre for <strong>Diffraction</strong> <strong>Data</strong> (ICDD): http://www.icdd.com<br />
The International X-ray Analysis Society (IXAS): http://www.ixas.org<br />
CCP 14: http://www.ccp14.ac.uk/index.html<br />
Submitting a proposal for neutron diffraction or Synchrotron Radiation X-ray <strong>Diffraction</strong> is possible at many Large Scale Facilities<br />
(LSF) in the world. It represents an important and frequently unique opportunity for powder diffraction experiments. A<br />
useful guide and information can be accessed through the following web-site, maintained by R.Dinnebier:<br />
http://www.pulverdiffraktometrie.de<br />
This list is far <strong>from</strong> being complete and needs input <strong>from</strong> users and readers of the Newsletter. Please, send comments directly<br />
to R. Dinnebier (r.dinnebier@fkf.mpg.de)<br />
THE IUCR COMMISSION ON POWDER DIFFRACTION - TRIENNIUM 1999-2002<br />
Chairman: Prof. P. Scardi (Paolo)<br />
Dipartimento di Ingegneria dei Materiali, Università di<br />
Trento, 38050 Mesiano (TN), Italy;<br />
Tel: +39 0461 882417/67 | Fax: +39 (461) 881977<br />
e-mail: Paolo.Scardi@ing.unitn.it<br />
Secretary: Dr A. N. Fitch (Andy)<br />
ESRF, Grenoble France<br />
Tel: +33 476 88 25 32 | Fax: +33 476 88 25 42<br />
e-mail: fitch@esrf.fr<br />
Dr R. Delhez (Rob)<br />
Laboratory of Materials Science, Delft University of Technology,<br />
Rotterdamseweg 137 2628 AL Delft, The Netherlands<br />
Tel: +31 15 2782261 | Fax: +31 (15) 278 6730<br />
e-mail: R.Delhez@tnw.tudelft.nl<br />
Prof. S. P. Sen Gupta (Siba)<br />
Department of Materials Science, IACS, Jadavpur, Calcutta<br />
700032, India; Fax. +91 (33) 4732805<br />
e-mail: msspsg@mahendra.iacs.res.in<br />
Dr R. B. Von Dreele (Bob)<br />
LANSCE, Los Alamos National Laboratory, Los Alamos,<br />
NM 87545, USA; Fax: +1 (505) 6652676<br />
e-mail: vondreele@lanl.gov<br />
Dr D. Balzar (Davor)<br />
Department of Physics & Astronomy<br />
University of Denver<br />
2112 E Wesley Ave, Denver, CO 80208-0202<br />
Phone: 303-871-2137 | Fax: 303-871-4405<br />
Web: e-mail: balzar@du.edu<br />
Prof. G. J. Kruger (Gert)<br />
Department of Chemistry & Biochemistry, Rand Afrikaans<br />
University, P O Box 524, Aucklandpark, South Africa<br />
Tel: +27 11 489 2368 | Fax: +27 11 489 2360<br />
e-mail: gjk@na.rau.ac.za<br />
Prof. H. Fjellvåg (Helmer)<br />
Department of Chemistry, University of Oslo<br />
P O Box 1033, Blindern N0315 OSLO, Norway<br />
e-mail: helmer.fjellvag@kjemi.uio.no<br />
Prof. W. I. F. David (Bill)<br />
Rutherford Appleton Laboratory (CCLRC), Chilton, Oxon.<br />
OX11 OQX, United Kingdom<br />
Tel: +44 1235 445179 | Fax: +44 1235 445383<br />
e-mail: bill.david@rl.ac.uk<br />
Dr R. E. Dinnebier (Robert)<br />
<strong>Max</strong>-<strong>Planck</strong>-Institut für Festkörperforschung,<br />
Heisenbergstrasse 1, D-70569 Stuttgart, Germany<br />
Tel: +49-711-689-1503 | Fax: +49-711-689-1502<br />
e-mail: r.dinnebier@fkf.mpg.de<br />
------------------------------------------------------------------<br />
ICDD Representative<br />
Prof. R. L. Snyder (Bob)<br />
Department of Materials Science & Engineering, 2041 College<br />
Avenue, Ohio State University, Columbus, OH 43210-<br />
1179, USA; Fax: +1 (614) 2924668<br />
e-mail: Snyder.355@osu.edu<br />
Consultants<br />
Prof. R. J. Cernik (Bob)<br />
Daresbury Laboratory, daresbury, Warrington, WA4 4AD,<br />
UK; Fax: +44 (1925) 603 124<br />
e-mail: R.J.Cernik@daresbury.ac.uk<br />
Dr F. Izumi (Fujio)<br />
National Institute for Research in Inorganic Materials<br />
1-1 Namiki, Tsukuba, Ibaraki 305-0044, Japan<br />
TEL: +81-298-51-3354 (ext. 511); FAX: +81-298-52-7449<br />
E-mail: izumi@nirim.go.jp<br />
5
Beyond the abilities of <strong>Rietveld</strong> analysis: MEMbased<br />
pattern fitting with synchrotron X-ray<br />
powder diffraction data<br />
Fujio Izumi and Takuji Ikeda<br />
Advanced Materials Laboratory, National Institute for<br />
Materials Science, 1-1 Namiki, Tsukuba, Ibaraki 305-0044,<br />
Japan<br />
The maximum-entropy method (MEM) is a versatile<br />
approach to the estimation of a model <strong>from</strong> a limited<br />
amount of information by maximizing information entropy<br />
under constraints consistent with observed physical<br />
quantities. In recent years, Takata et al. [1] have applied it<br />
actively to the determination of electron densities, ρ, using<br />
synchrotron X-ray diffraction (XRD) data. MEM infers<br />
electron densities in such a way that they provide the<br />
maximum variance of structure factors, F c (MEM), within<br />
errors in observed structure factors, F o . Detailed structural<br />
information can effectively be extracted <strong>from</strong> the<br />
diffraction data and reflected on the resulting densities (ρ ><br />
0) by MEM if the data have been appropriately measured.<br />
Because MEM can estimate non-zero structure factors of<br />
high-Q reflections excluded in the analysis of powder<br />
diffraction data, the termination effect is less marked in<br />
MEM analysis than in Fourier synthesis. Thanks to these<br />
excellent features, MEM gives less noisy density maps<br />
than Fourier synthesis [2].<br />
Takata et al. [1] estimate observed integrated intensities<br />
on the basis of the result of <strong>Rietveld</strong> analysis when dealing<br />
with overlapping reflections. That is, the observed net<br />
intensity at each point is apportioned in the ratio of profiles<br />
calculated <strong>from</strong> final structure and profile parameters and<br />
summed up for each reflection [3]. This expedient<br />
technique is also utilized to evaluate R B and R F in <strong>Rietveld</strong><br />
analysis, integrated intensities in the Le Bail method [4],<br />
and electron/nuclear densities in Fourier synthesis.<br />
However, ‘observed’ structure factors, F o (<strong>Rietveld</strong>),<br />
estimated in this manner are doubly biased towards a<br />
structural model in the <strong>Rietveld</strong> analysis because both<br />
phases and calculated profiles used for the intensity<br />
partitioning are derived <strong>from</strong> the model [2]. This<br />
approximate nature of the procedure for extracting<br />
integrated intensities lowers the accuracy of<br />
electron/nuclear densities determined by combining<br />
<strong>Rietveld</strong> and MEM analyses, i.e., the MEM/<strong>Rietveld</strong><br />
method [1].<br />
We have integrated a versatile pattern-fitting program<br />
RIETAN-2000 and a MEM program MEED into a system<br />
named REMEDY [5–7] to overcome the serious defect in<br />
the MEM/<strong>Rietveld</strong> method. With REMEDY, the bias<br />
imposed on electron/nuclear densities can efficiently be<br />
reduced by an original technology called MEM-based<br />
Pattern Fitting (MPF). This article describes the principle<br />
of the MPF method and its applications to XRD data of<br />
three samples to demonstrate its strength relative to the<br />
MEM/<strong>Rietveld</strong> method. In contrast to our previous work<br />
[5–10] using XRD with CuKα radiation and neutron<br />
diffraction, synchrotron XRD data were analyzed to test<br />
the performance of MPF in structure refinements with the<br />
high-resolution XRD data.<br />
Figure 1 illustrates a flow chart of structure refinement by<br />
the MEM/<strong>Rietveld</strong> method (upper frame) and subsequent<br />
repetition of MPF (lower frame). F o (<strong>Rietveld</strong>) data<br />
estimated at the end of <strong>Rietveld</strong> analysis [3] are analyzed<br />
Fig 1 Structure refinement by <strong>Rietveld</strong> and MEM analyses<br />
followed by iterative pattern fitting based on MEM. A<br />
new program to visualize crystal structures and<br />
electron/nuclear densities is under development.<br />
by MEM to yield electron/nuclear densities, which may<br />
urge us to modify a structural model. <strong>Rietveld</strong> and MEM<br />
analyses are alternately carried out until a reasonable<br />
structural model is reached [1].<br />
The undesirable bias imposed by the structural model<br />
enlarges with increasing degree of overlap of reflections<br />
and lowering resolution in a powder pattern. The<br />
MEM/<strong>Rietveld</strong> method, which certainly serves to modify<br />
imperfect structural models [1,8,9], is far <strong>from</strong> perfect for<br />
determining accurate electron/nuclear densities.<br />
Nevertheless, MEM allows us to extract structural details<br />
<strong>from</strong> the F o (<strong>Rietveld</strong>) data because they contain<br />
contributions that have been neglected in the structural<br />
model. In addition, actually observed structure factors, F o ,<br />
Fig 2 Electron-density image of anthraquinone viewed along<br />
[0 1 0] with an equi-density level of 0.7 e/Å 3 and cross<br />
sections at y = 0.<br />
can be determined for isolated reflections without any<br />
approximation.<br />
To minimize the bias to the structural model,<br />
MEM/<strong>Rietveld</strong> analyses are followed by iteration of MPF.<br />
MEED evaluates F c (MEM) by the Fourier transform of<br />
electron/nuclear densities. Then, we fit the calculated<br />
pattern to the observed one by fixing structure factors at<br />
values of F c (MEM) obtained by the previous MEM<br />
analysis and refining only parameters irrelevant to the
structure. F o (MPF) data estimated after the pattern fitting<br />
according to <strong>Rietveld</strong>’s procedure [3] are analyzed again<br />
by MEM. MEM analysis and pattern fitting are alternately<br />
repeated until R factors in the pattern fitting no longer<br />
decrease. Such an iterative procedure is referred to as<br />
REMEDY cycles, as noted in Fig. 1. Repetition of MPF<br />
weakens the influence of the structural model on F o (MPF).<br />
In other words, intensity repartitioning for overlapping<br />
reflections can become more accurate with increasing<br />
capillary tubes rotated at a speed of 60 rpm. Incident<br />
beams <strong>from</strong> an undulator were monochromatized with<br />
inclined double-crystal monochromators of Si(111). An<br />
instrumental resolution at the top international level is<br />
attained in this diffractometer.<br />
We expected that anisotropic thermal vibration, subtle<br />
orientational disorder, and σ and π bonds in aromatic<br />
compounds would not satisfactorily be depicted by<br />
conventional <strong>Rietveld</strong> analysis. Then, the MPF method<br />
was applied to the XRD data (λ = 1.5496 Å) of<br />
anthraquinone (C 14 H 8 O 2 , P2 1 /c) [11] at room temperature.<br />
R wp , R B , and R F were respectively 5.37%, 3.54%, and<br />
7.13% in the final <strong>Rietveld</strong> refinement and 4.90%, 0.78%,<br />
and 1.33% after subsequent three REMEDY cycles. Figure<br />
2 shows an electron-density image resulting <strong>from</strong> the final<br />
MEM analysis. C–C and C–O bonds are visible with a<br />
Fig 3 Changes in R factors for the final <strong>Rietveld</strong> analysis and<br />
subsequent two cycles of MPF for Sr 9.3 Ni 1.2 (PO 4 ) 7 .<br />
number of cycles owing to extraction of additional<br />
structural information <strong>from</strong> observed intensities of Bragg<br />
reflections.<br />
The above sophisticated methodology achieves a<br />
significant breakthrough in adequate representations of<br />
disordered atomic configurations, chemical bonds,<br />
nonlocalized electrons, and anharmonic thermal motion.<br />
Crystal structures are expressed not by structure<br />
parameters but by three-dimensional electron/nuclear<br />
densities in MPF. Therefore, the above purposes are<br />
attainable more satisfactorily by the MPF method than by<br />
the conventional <strong>Rietveld</strong> method. The establishment of<br />
this technique leads to the availability of an ultra-highresolution<br />
‘X-ray/neutron microscope’ that enables us to<br />
visualize powder diffraction data as three-dimensional<br />
density images. X-Ray and neutron diffraction can be<br />
Fig 4 Observed, calculated, and difference patterns fo the last<br />
MPF for Sr 9.3 Ni 1.2 (PO 4 ) 7 . The patterns between 20° and<br />
48° are magnified in the inset.<br />
utilized complementarily for (a) more adequate expression<br />
of chemical bonds and (b) analysis of anharmonic thermal<br />
vibration and disordered structures [10], respectively.<br />
The synchrotron XRD data of the three samples were<br />
measured on a powder diffractometer (beam line BL15XU<br />
at SPring-8) with the Debye-Scherrer geometry using<br />
Fig 5 Observed, calculated, and difference patterns for LTL.<br />
The patterns between 10° and 60° are magnified in the<br />
inset.<br />
difference in expansion of the isosurface. H atoms bonded<br />
to C atoms in benzene rings look like mamillae.<br />
XRD data of a whitlockite-like phosphate,<br />
Sr 9.3 Ni 1.2 (PO 4 ) 7 (R3 m) [12], were taken at 100 K with a<br />
wavelength of 0.8000 Å and a Ge(111) analyzer. Most<br />
sharp profiles could be observed with FWHM ranging<br />
<strong>from</strong> 0.008° to 0.019°. In the structure of Sr 9.3 Ni 1.2 (PO 4 ) 7 ,<br />
parts of Sr 2+ and PO 4 3– ions exhibit highly disordered<br />
arrangements, which cannot be well expressed by a splitatom<br />
model in its <strong>Rietveld</strong> analysis. R wp , R B , and R F<br />
respectively decreased <strong>from</strong> 7.38%, 3.87%, and 2.88% in<br />
the final <strong>Rietveld</strong> refinement adopting a split-atom model<br />
to 6.23%, 1.25%, and 0.95% after four REMEDY cycles<br />
(Fig. 3). R B and R F dropped dramatically in the first cycle.<br />
A very excellent fit between observed and calculated<br />
patterns was attained in the final MPF (Fig. 4). These<br />
preliminary results reveals that the MPF method is<br />
effective even in the structure refinement using the XRD<br />
data measured with the very high resolution.<br />
A dehydrated zeolite LTL (K 9 Al 9 Si 27 O 72 , P6/mmm) [13],<br />
is a microporous material with a disordered structure<br />
including large one-dimensional channels parallel to the c<br />
axis. Its XRD data (λ = 1.2000 Å) were collected at room<br />
temperature with the Ge(111) analyzer. R wp , R B , and R F<br />
were respectively 4.90%, 1.60%, and 1.59% in the final<br />
<strong>Rietveld</strong> refinement and 4.46%, 0.69%, and 0.84% after<br />
two cycles of MPF. Figure 5 shows the final profile fit to<br />
be excellent. An electron-density image (Fig. 6) clearly<br />
displays a framework consisting of highly covalent<br />
(Si,Al)–O bonds. We also found that electron-density<br />
distribution around K + ions incorporated in the framework<br />
is not spherical but anisotropic.
The number of REMEDY cycles required for<br />
convergence generally increases with lowering resolution<br />
in a diffraction pattern because observed intensities of<br />
Bragg reflections are repartitioned with F c (MEM)<br />
calculated <strong>from</strong> F o (<strong>Rietveld</strong>) or F o (MPF). Even with highresolution<br />
synchrotron XRD data, at least one cycle of<br />
Fig 6 Electron-density image of LTL viewed along [00 1 ]<br />
with an equi-density level of 0.5 e/Å 3 and cross<br />
sections at z = 0.<br />
MPF proved to be indispensable for the determination of<br />
more accurate electron densities. In MPF, parameters other<br />
than structure parameters are refined, and partition of<br />
observed intensities is successively improved because of<br />
the use of F c (MEM). The MPF method is, hence, so much<br />
superior to the MEM/<strong>Rietveld</strong> method, in which the<br />
analytical method in the Fourier synthesis of F o (<strong>Rietveld</strong>)<br />
data is merely replaced with MEM [1].<br />
From the significant results presented above for the three<br />
compounds, we conclude MPF to be a powerful method of<br />
structure refinement where imperfect structural<br />
representations in conventional <strong>Rietveld</strong> analysis are<br />
supplemented with model-free MEM.<br />
REFERENCES<br />
[1] M. Takata, E. Nishibori, and M. Sakata, Z. Kristallogr.,<br />
216, 71 (2001).<br />
[2] L. B. McCusker, R. B. Von Dreele, D. E. Cox, D.<br />
Louër, and P. Scardi, J. Appl. Crystallogr., 32, 36<br />
(1999).<br />
[3] H. M. <strong>Rietveld</strong>, J. Appl. Crystallogr., 2, 65 (1969).<br />
[4] A. Le Bail, H. Duroy, and J. L. Fourquet, Mater. Res.<br />
Bull., 23, 447 (1988).<br />
[5] F. Izumi, S. Kumazawa, T. Ikeda, and T. Ida, “<strong>Powder</strong><br />
<strong>Diffraction</strong>,” ed. by S. P. Sen Gupta, Allied Publ., New<br />
Delhi (1998), pp. 24–36.<br />
[6] F. Izumi, Rigaku J., 17(1), 34 (2000).<br />
[7] F. Izumi, S. Kumazawa, T. Ikeda, W.-Z. Hu, A.<br />
Yamamoto, and K. Oikawa, Mater. Sci. Forum, 378–<br />
381, 59 (2001).<br />
[8] T. Ikeda, F. Izumi, T. Kodaira, and T. Kamiyama,<br />
Chem. Mater., 10, 3996 (1998).<br />
[9] T. Ikeda, Y. Akiyama, F. Izumi, Y. Kiyozumi, F.<br />
Mizukami, and T. Kodaira, Chem. Mater., 13, 1286<br />
(2001).<br />
[10]F. Izumi, T. Ikeda, T. Sasaki, and S. Kumazawa, Mol.<br />
Cryst. Liq. Cryst., 341, 253 (2000).<br />
[11]Y. Fu and C. P. Brock, Acta Crystallogr., Sect. B, 54,<br />
308 (1998).<br />
[12]A. A. Belik et al., unpublished data.<br />
[13]R. M. Barrer and H. Villiger, Z. Kristallogr., 128, 352<br />
(1969).<br />
Anisotropic Peak Broadening in High<br />
Resolution <strong>Data</strong> on RbC 60 .<br />
Peter W. Stephens and Ashfia Huq<br />
Department of Physics & Astronomy, Stony Brook<br />
University, Stony Brook, NY 11794-3800 USA<br />
Anyone familiar with <strong>Rietveld</strong> refinements knows that<br />
the method depends on having an accurate model for the<br />
powder diffraction profile. We wish to present a brief<br />
story about data that created some disappointment when it<br />
looked like the sample contained serious impurities, but<br />
that was eventually resolved once we recognized that we<br />
needed a lineshape model that was as good as the data.<br />
Instruments with better resolution are becoming more<br />
widely used: synchrotron radiation sources, high resolution<br />
diffractometers at pulsed neutron facilities, and parallelbeam<br />
optics in the laboratories of individual researchers.<br />
<strong>Data</strong> with improved resolution and counting statistics<br />
generally reveal more information about the sample. This<br />
is not always welcome because it demands that the user<br />
think about (or at least model) aspects of the experiment<br />
that may seem secondary to finding out where the atoms<br />
are.<br />
The one-dimensionally polymerized fullerenes AC 60 (A =<br />
K, Rb, Cs) are interesting and incompletely understood.<br />
All three are thermodynamically stable at room<br />
temperature and below, and have a structure consisting of<br />
chains of fullerenes linked by [2+2] cycloaddition, but<br />
there are significant differences both in their structures and<br />
in their physical properties. This observation cries out for<br />
clarification <strong>from</strong> structural studies. They were thought to<br />
be isostructural (orthorhombic) when first discovered, but<br />
the fact that RbC 60 is monoclinic was later discovered<br />
independently by Lanois et al. [1] and by us [2]. The real<br />
importance of our high resolution structure solution lies in<br />
the fact that it is the first analysis of a fulleride with lower<br />
than cubic symmetry in which the position of every atom is<br />
measured. Substantial deformations <strong>from</strong> icosahedral<br />
symmetry are observed throughout the buckyball. Indeed,<br />
there is an overlap of the distances seen in nominally<br />
single and double sp 2 bonds. The interested reader is<br />
referred to our full results in Reference 2; we only remark<br />
here that it requires a very high quality refinement to have<br />
confidence in such unexpected results.<br />
When we first collected data in 1998 on approximately 1<br />
gm of material at the High Resolution <strong>Powder</strong><br />
Diffractometer of the ISIS pulsed neutron source, it was<br />
obvious that the orthorhombic cell would not work, and we<br />
quickly found that a monoclinic lattice distortion of only<br />
0.3° was required to fit the data. We quickly found a good<br />
starting structure, but when we got home and worked to<br />
refine it, there were several strong, sharp peaks that<br />
appeared in the difference plot (Fig. 1a). Did our carefully<br />
prepared sample contain impurities? Scouring the<br />
databases, we found some Rb oxides, hydroxides, etc.,<br />
with some d-spacings close to our peaks, but no positive
Fig 2 Distribution of strain broadening, δd/d, <strong>from</strong> the<br />
anisotropically broadened lineshape model in the<br />
<strong>Rietveld</strong> refinement of RbC 60 discussed in the text.<br />
Fig 1 <strong>Rietveld</strong> refinements of data on RbC 60 at 200K, taken<br />
at the time-of-flight neutron diffractometer HRPD at<br />
ISIS. (top panel): Fit using standard <strong>Rietveld</strong> lineshape<br />
method, with Gaussian and Lorentzian widths a<br />
smooth (parameterized) function of reflection spacing<br />
d. This fit has. (bottom panel): Fit with anisotropic<br />
broadening model <strong>from</strong> Ref. 3; R wp = 1.48%, χ 2 = 4.33.<br />
identification. It’s painful to recall the efforts we made to<br />
find out what new phase was in our sample, and how many<br />
old samples we rechecked with x-rays and found to be<br />
significantly contaminated by the same phase. This had no<br />
peaks observable in the raw data, and only overlapped with<br />
measurable RbC 60 data. The last straw was the discovery<br />
that the impurity phase disappeared when we heated a test<br />
sample to 200°C, where the fulleride transforms into a<br />
cubic rock-salt structure. Actually, we probably should<br />
have noticed earlier that all of the peaks in the difference<br />
curve actually coincided with allowed diffraction peaks<br />
<strong>from</strong> the polymeric fulleride structure, and indeed that they<br />
are reflections on or very close to the polymeric chain axis.<br />
So if these extra-sharp peaks are intrinsic to the structure,<br />
we need to ask two questions: Why? What can be done<br />
about it? Tackling the second one first, we should<br />
remember that the premise of <strong>Rietveld</strong> refinement is to<br />
parameterize the diffraction lineshape in some meaningful<br />
way, so that the data can help to do an optimal job of<br />
assigning the intensity at a given observed point in the<br />
spectrum to the appropriate Bragg reflections. If the peaks<br />
widths do not follow a smooth dependence on d-spacing,<br />
that can be modeled just like any other set of refineable<br />
parameters. There have been numerous observations of the<br />
problem, and attempts to deal with it. However, it is<br />
important that any such phenomenological account of<br />
lineshape broadening should respect the symmetry of the<br />
problem, e.g., so that peaks with symmetry equivalent<br />
Miller indices should have the same width. Several<br />
authors, including one of us (PWS) had previously shown<br />
that certain kinds of anisotropic strain broadening can be<br />
described by a model incorporating quartic combinations<br />
of Miller indices [3]. This was originally justified as the<br />
most general joint distribution of lattice metric parameters,<br />
but has been more recently tied to distributions of elastic<br />
strains caused by defects, at least for cubic and hexagonal<br />
systems, and can be used to determine density and<br />
arrangement of dislocations [4].<br />
A <strong>Rietveld</strong> refinement with the nine anisotropic<br />
broadening coefficients is shown in Fig. 1b. Clearly, the<br />
model has taken care of the family of extraordinarily sharp<br />
peaks that were so upsetting in Fig. 1a. It is interesting to<br />
look at the microstrain distribution that results <strong>from</strong> this<br />
refinement. That is illustrated in Fig. 2, which shows the<br />
width of the distribution in microstrain, δd/d, as a function<br />
of direction in reciprocal space. The cusp facing the<br />
viewer is in the direction of the monoclinic b axis, which is<br />
the chain axis. This agrees with intuition that the structure<br />
should be most rigid along the chains of covalently linked<br />
buckyballs, and would have more flexibility in other<br />
directions, where the bonding is van der Waals. We<br />
emphasize that the parameters all have a physical meaning<br />
(albeit somewhat obscure), compatible with the structural<br />
symmetry of the material. This is not the case with other<br />
approaches, which, e.g., model microstrain as an<br />
ellipsoidal function of direction of the Bragg diffraction<br />
direction relative to the crystalline translation axes.<br />
In this example, we have seen that a reassessment of the<br />
diffraction lineshape led to a qualitative change in the<br />
evaluation of the experiment: there is nothing wrong with
the sample and the result is a valid solution of the<br />
structure. However there is also a less dramatic, but<br />
quantitatively important improvement in the quality of the<br />
refined parameters. The statistical esd’s are smaller,<br />
generally by a factor of two, with the anisotropic lineshape<br />
model. One expects this because χ 2 is smaller by a factor<br />
of about four, due to the improved fit. But we also see that<br />
the refined bond lengths shift, typically by twice the esd<br />
<strong>from</strong> the <strong>Rietveld</strong> of the isotropic lineshape model. That<br />
shift is probably significant, and is a real benefit of the<br />
improved fit. More broadly, we would like to point out<br />
that about half of the samples that we have recently<br />
investigated by high resolution powder diffracometry have<br />
shown significant anisotropic strain broadening.<br />
Clearly it is imporant to include this effect in any<br />
analysis of high resolution data. Currently, it is<br />
implemented and documented in only one <strong>Rietveld</strong><br />
program, GSAS.<br />
REFERENCES<br />
[1] P. Launois, R. Moret, J. Hone, and A. Zettl, Phys. Rev.<br />
Lett. 81, 4420 (1998).<br />
[2] A. Huq, P.W. Stephens, G.M. Bendele, and R.M.<br />
Ibberson, Chem. Phys. Lett. 347, 13 (2001).<br />
[3] P.W. Stephens, J. Appl. Cryst. 32, 281 (1999); see also<br />
C. Popa, J. Appl. Cryst. 31, 176 (1998).<br />
[4] G.Ribarik, T. Ungar, and J. Gubicza, J. Appl. Cryst. 34,<br />
669 (2001).<br />
8th European <strong>Powder</strong> <strong>Diffraction</strong> Conference<br />
Uppsala, Sweden<br />
23 - 26 May 2002<br />
Information and application forms:<br />
Internet: http://www.mkem.uu.se/epdic8<br />
e-mail: epdic8@mkem.uu.se<br />
Tel/Fax: +46-18-4713733 / +46-18-513548
Recent developments of the program FULLPROF<br />
J. Rodríguez-Carvajal<br />
Laboratoire Léon Brillouin (CEA-CNRS), 91191 Gif<br />
sur Yvette, FRANCE. and<br />
Service de Physique Statistique, Magnétisme et Supraconductivité,<br />
CENG (CEA), 38400 Grenoble Cedex 9,<br />
FRANCE<br />
In these notes some of the most recent developments of<br />
the program FullProf are presented. After an introduction<br />
summarizing the most important changes we present, in<br />
more detail, few examples selected among those of more<br />
usefulness for a majority of people: a) the introduction of<br />
special form factors for treating nearly free rotating<br />
molecules, b) the use of the simulated annealing procedure<br />
for solving crystal and magnetic structures and c) the new<br />
features related to microstructural effects. The notes finish<br />
enumerating some of the projects already in course that<br />
will be publicly available soon in 2002.<br />
to the user of the program. In particular automatic<br />
calculation of the multiplicity of each site is now<br />
performed after reading the atoms as well as the<br />
calculation of the appropriate coefficients for automatic<br />
quantitative analysis of mixture of phases.<br />
2. The calculation of distances and angles, as well as<br />
bond valence sums can now be done automatically, without<br />
using external programs. Output files with extension dis<br />
contain all the relevant information for the different phases<br />
if the user is asking for this option. A byproduct of these<br />
calculations is the generation of the output files of names<br />
dconstr"n".hlp (n stands for the number of the phase)<br />
containing lines that can be directly pasted to PCR files for<br />
soft constraints on distances and angles. This makes the<br />
use of distance and angle constraints extremely easy in<br />
appropriate cases.<br />
3. Another important modification is the handling of<br />
refinement codes. Now the user may select between the<br />
traditional mode changing by hand the numbering of<br />
F m 3 m RF2-factor : 3.49<br />
=> RF -factor : 3.01<br />
Fig 2: Plot of the observed (red) versus calculated (black) square<br />
structure factors in a region of sinθ/λ, after refining the C60<br />
molecule using a SASH form factor.
4. A new mode for refining magnetic structures has also<br />
been included. The free parameters are then the<br />
coefficients of the basis functions of the irreducible<br />
representations of the propagation vector group. This mode<br />
can also be used with the simulated annealing<br />
optimization.<br />
5. New functions for refinement of the background have<br />
been included. In particular the height of the linear<br />
interpolated background points that was fixed in previous<br />
versions of the program can now be refined.<br />
Other improvements concerning special form-factors,<br />
simulated annealing and microstructural effect are<br />
discussed below in more detail.<br />
SPECIAL FORM-FACTORS<br />
Several types of special form factors are included in<br />
FullProf, among them the Symmetry Adapted Spherical<br />
Harmonics (SASH) as special form-factors are now fully<br />
implemented. The case of C 60 is provided as an example<br />
using cubic harmonics in Figure 1.<br />
The program knows that the user is giving a special formfactor<br />
by putting the value N_t=4 in the same line of giving<br />
the chemical species, the keyword of the form-factor and<br />
the fractional coordinates. The user must provide the type<br />
X-ray scattering factor). The angles used as arguments in<br />
the above expressions correspond to the spherical<br />
coordinates of the scattering vector Q with respect to a<br />
local Cartesian frame that may be the same or different as<br />
the default Cartesian frame connected with the<br />
crystallographic unit cell. In the last case a transformation<br />
matrix should be given.<br />
The coefficients<br />
c and<br />
s<br />
lj<br />
s<br />
c<br />
lmp<br />
are free parameters. In<br />
FullProf the form-factor corresponds to just one shell (a<br />
particular value of s). For a complete molecule the user<br />
must provide a number of SASH objects equal to the<br />
number of spherical shells characterizing the molecule.<br />
The first parameter in the list (f1, f2, f3, …) corresponds to<br />
the value of the spherical shell radius: f1=r s , the second<br />
parameter is the number of atoms of the chemical species<br />
given by the chemical symbol, within the spherical shell.<br />
The coefficients (f3, f4, f5, …f14) correspond to the free<br />
parameters<br />
c or<br />
s<br />
lj<br />
c of the current shell in the order<br />
s<br />
lmp<br />
specified by the list. The first coefficient f3 corresponds to<br />
the free rotator term l = m = 0 (or l = j = 0) and should,<br />
normally, be fixed to 1. The user must provide the list (l,<br />
m, p), or (l, j), in ascending order on l according to the local<br />
Para-di-Iodo-Benzene (Sim.Annealing)<br />
!<br />
!Nat Dis Ang Pr1 Pr2 Pr3 Jbt Irf Isy Str Furth ATZ Nvk Npr More<br />
6 0 0 1.0 0.0 0.0 4 4 0 0 0 0.00 0 0 0<br />
!<br />
P b c a
and the implementation in FullProf may be found in<br />
reference [5], here we show just some examples of using<br />
the method .<br />
To solve a crystal or a magnetic structure a complete list<br />
of atoms with all their attributes (thermal parameters,<br />
magnetic moments, etc) should be given as if everything<br />
were known. An example of simulating annealing PCR file<br />
is given in Figure 3.<br />
The use of codewords is totally supported so that any<br />
usual constraint may be used in the search. Of course the<br />
initial values of the parameters are arbitrary provided the<br />
hard constraints through the codewords are respected. In<br />
fact the meaning of the codewords is the same as in least<br />
square refinements, the multipliers and signs are applied to<br />
the shifts with respect to the previous values of the<br />
parameters. The scale factor may be treated automatically<br />
so that no codeword should be given to this parameter.<br />
The program recognizes the use of simulated annealing<br />
by putting NRELL equal to the number of parameters to be<br />
eventually varied, and ICRYG=3 in the beginning of the<br />
PCR file (see appendix of the manual for details).<br />
In the example above the three angles (in radians)<br />
defining the orientation of the molecule are selected as<br />
parameters 1, 2 and 3. The admissible range of values are<br />
given in a list followed by an indicator telling to the<br />
program how to treat the boundaries. The number “1”<br />
following the value of the initial step (0.5 radians)<br />
indicates that periodic boundary conditions are applied.<br />
The flag InitConf is important for selecting the treatment<br />
of the initial configuration. If InitConf = 0 the initial<br />
configuration is totally random. If InitConf =1, the initial<br />
configuration is the one given by the values of the<br />
parameters in the PCR-file. This last option is useful when<br />
one tries to optimize an already good starting<br />
configuration, by controlling the box limits and the steps.<br />
The other critical point is to select between the two<br />
algorithms. This is controlled by the value of the variable<br />
Nalgor. If its value is zero, the Corana algorithm is<br />
selected. This algorithm does not use fixed steps for<br />
moving the parameters defining the configuration, instead<br />
the program starts by using then whole admissible interval<br />
as initial step for all parameters and then adapt<br />
progressively their values in order to maintain an<br />
approximate rate of accepted configurations between 40%<br />
and 60%. If Nalgor =1 the same algorithm is used but the<br />
starting steps are those given in the file. For Nalgor =2, the<br />
normal SA algorithm (fixed steps) is used. The last<br />
method, used with appropriate boundary box for<br />
parameters and InitConf =1, is better when one tries to<br />
refine a configuration without destroying the starting<br />
configuration.<br />
=> **** SIMULATED ANNEALING SEARCH FOR STARTING CONFIGURATION ****<br />
=> Initial configuration cost: 77.53<br />
=> Initial configuration state vector:<br />
=> Theta Phi Chi<br />
=> 1 2 3<br />
=> 1.3807 2.4672 -3.0110<br />
=> NT: 1 Temp: 8.00 (%Acc): 23.50 : 5.2360 : 44.4302<br />
. . . . . . .<br />
=> NT: 6 Temp: 4.72 (%Acc): 30.50 : 0.3496 : 23.8774<br />
. . . . . . . .<br />
=> NT: 11 Temp: 2.79 (%Acc): 39.33 : 0.1440 : 13.4990<br />
. . . . . . . .<br />
=> NT: 21 Temp: 0.97 (%Acc): 38.50 : 0.0530 : 6.3417<br />
. . . . . . . .<br />
=> NT: 33 Temp: 0.27 (%Acc): 36.17 : 0.0179 : 4.3854<br />
=>BEST CONFIGURATIONS FOUND BY Simulated Annealing FOR PHASE: 1<br />
=> -> Configuration parameters ( 71 reflections):<br />
=> Sol#: 1 RF2= 3.928 ::<br />
=> Theta Phi Chi<br />
=> 1 2 3<br />
=> 0.9401 0.1464 2.7477<br />
=> CPU Time: 25.177 seconds<br />
ð 0.420 minutes<br />
ð<br />
Fig 4: Simplified screen capture of the FullProf output when running in the simulating annealing mode for the example of figure 3. The<br />
first picture of the structure corresponds to the starting configuration. The final result is also displayed.
Fig 5: Different stages of the trajectories of configurations (projections in the ab plane) in a simulated annealing run for the<br />
determination of the structure of PbSO 4 <strong>from</strong> neutron powder diffraction data using overlapped integrated intensities. Lead atoms<br />
(b= 0.94 ) are found first (at 40% of the total run time), oxygen atoms (b= 0.58) in a second stage and finally (at about 54% ) the<br />
sulphur atoms (b= 0.285) start to remain into their oxygen tetrahedra.<br />
Within the distribution of FullProf there is a simple<br />
example of simulating annealing work using neutron<br />
diffraction data <strong>from</strong> D1A on lead sulfate PbSO 4 . In this<br />
example the atoms are treated independently using the<br />
correct space group and an artificial constraint is used:<br />
several atoms are constrained to have the same y fractional<br />
coordinate. We know that all these atoms are in a special<br />
position of the Pnma space group (y should be ¼ or ¾), but<br />
the file is prepared in such a way as to illustrate the use of<br />
constraints. Starting <strong>from</strong> a random configuration for all<br />
the free parameters (including the special y’s) the program<br />
finds progressively the good atom positions when the<br />
appropriate values of the control parameters are used (see<br />
figure 5).<br />
The user should experiment for each own case in order to<br />
select good control parameters. For instance the<br />
appropriate starting temperature depends strongly on the<br />
number of free parameters, the step sizes and the<br />
constraints. For solving a structure (crystallographic or<br />
magnetic) <strong>from</strong> the scratch it is important to select a<br />
temperature for which the percentage of accepted<br />
configurations is high (or the order of 80%) in order to let<br />
the procedure explore a large set of configurations. The<br />
<strong>Rietveld</strong> refinement cycles together with Fourier synthesis.<br />
For using the GFourier program [3], distributed in the<br />
same site that FullProf , it is important to use the value<br />
Jfou=4 in the PCR-file, to output an appropriate set of<br />
structure factors and an input file (extension inp) for<br />
GFourier.
MICROSTRUCTURAL EFFECTS<br />
The microstructural effects within FullProf are treated<br />
using the Voigt approximation: both instrumental and<br />
sample intrinsic profile are supposed to be described<br />
approximately by a convolution of Lorentzian and<br />
Gaussian components. The TCH pseudo-Voigt profile<br />
function [6] is used to mimic the exact Voigt function and<br />
it includes the Finger‘s treatment of the axial divergence<br />
[7]. The integral breadth method to obtain volume averages<br />
of sizes and strains is used to output a microstructural file<br />
where an analysis of the size and strain contribution to<br />
each reflection is written. No physical interpretation is<br />
given by the program, only a phenomenological treatment<br />
of line broadening in terms of coherent domain size and<br />
strains due to structural defects is performed. The user<br />
should consult the existing broad literature to go further<br />
in the interpretation of the results. A recent book [8],<br />
σ<br />
combination) are considered as stochastic variables with a<br />
correlations between metric parameters [9].<br />
1 2 2 2<br />
Mhkl<br />
= = Ah + Bk + Cl + Dkl+ Ehl+ Fhk = M α ;<br />
2<br />
i<br />
hkl<br />
dhkl<br />
The metric parameters α<br />
i<br />
(direct, reciprocal or any<br />
combination) are considered as stochastic variables with a<br />
Gaussian distribution characterized by the mean α and<br />
the variance-covariance matrix<br />
set: { } { ABCDEF<br />
, , , , , }<br />
i<br />
i<br />
( )<br />
C<br />
ij<br />
. Here we consider the<br />
α = .The position of the peaks<br />
is obtained <strong>from</strong> the average value of<br />
hkl<br />
( αi<br />
; )<br />
M M hkl<br />
M<br />
hkl<br />
given by:<br />
= . The broadening of the<br />
reflections is governed by the variance of<br />
M<br />
hkl<br />
:<br />
⎛ S C C C C C ⎞⎛h<br />
⎞<br />
⎜ ⎟⎜ ⎟<br />
⎜ ⎟⎜ ⎟<br />
⎜ ⎟⎜ ⎟<br />
= = ⎜ ⎟⎜ ⎟<br />
∂ ∂ ⎜ ⎟⎜ ⎟<br />
⎜ ⎟⎜ ⎟<br />
⎜<br />
⎟⎜ ⎟ ⎟<br />
⎝<br />
⎠⎝<br />
⎠<br />
2 2<br />
A AB AC AD AE AF<br />
2 2<br />
CAB SB CBC CBD CBE CBF<br />
k<br />
2 2<br />
2 ∂M<br />
∂M<br />
2 2 2<br />
CAC CBC SC CCD CCE CCF<br />
l<br />
( M<br />
hkl) ∑ Cij<br />
( h k l kl hl hk )<br />
2<br />
i,<br />
j αi α<br />
j CAD CBD CCD SD CDE CDF<br />
kl<br />
2<br />
CAE CBE CCE CDE SE CEF<br />
hl<br />
2<br />
CAF CBF CCF CDF CEF S ⎜<br />
F<br />
hk<br />
gathering different articles, is a good introduction to<br />
microstructural problems.<br />
The new file containing information about the<br />
microstructure is output only if the user provides an input<br />
file containing the instrumental resolution function (IRF,<br />
see manual for the different ways of giving resolution<br />
parameters). At present, this option works only for<br />
constant wavelength mode.<br />
The FWHM of the Gaussian ( H ) and Lorentzian<br />
( H<br />
L<br />
) components of the peak profile have an angular<br />
dependence given by:<br />
2 2 2 2<br />
IG<br />
HG = ( U + (1 − ξ) DST( a<br />
D))tan θ + V tanθ<br />
+ W +<br />
2<br />
cos θ<br />
[ Y + F( a<br />
Z<br />
)]<br />
HL = ( X + ξDST( a<br />
D))tanθ<br />
+<br />
cosθ<br />
If the user provides a file with the IRF, the user should<br />
fix V and W to zero, then the rest of parameters in the<br />
above formula have a meaning in terms of strains<br />
( U, a , X ) or size ( Y, I , a ).<br />
D<br />
The functions D ( a ) and ( )<br />
ST<br />
G<br />
D<br />
Z<br />
G<br />
F a have different<br />
expressions depending on the particular model used of<br />
strain and size contribution to broadening. The parameter<br />
ξ is a mixing coefficient to mimic Lorentzian contribution<br />
to strains.<br />
The anisotropic strain broadening is modeled using a<br />
quartic form in reciprocal space. This correspond to an<br />
interpretation of the strains as due to static fluctuations and<br />
correlations between metric parameters [9].<br />
1<br />
Z<br />
( α ; )<br />
2 2 2<br />
Mhkl<br />
= = Ah + Bk + Cl + Dkl+ Ehl+ Fhk = M<br />
2<br />
i<br />
hkl<br />
dhkl<br />
The metric parameters<br />
α<br />
i<br />
(direct, reciprocal or any<br />
where the non diagonal terms may be written as product of<br />
standard deviations multiplied by correlation terms:<br />
C = SScorr(, i j)<br />
. This original formulation can be<br />
ij i j<br />
used with a total control of the correlation terms that must<br />
belong to the interval [-1, 1].<br />
A-strain h k l<br />
43.4585 0 1 2<br />
48.1172 1 0 2<br />
7.1018 1 1 0<br />
5.9724 1 1 1<br />
4.1383 1 1 2<br />
9.7952 0 0 4<br />
4.0162 1 1 3<br />
79.5271 0 2 0<br />
87.5578 2 0 0<br />
Nd 2<br />
NiO 4<br />
, LT<br />
S_400 S_040 S_004 S_220<br />
22.04(78) 17.74(57) 0.016(2) -38.8(1.2)<br />
Lorentzian Parameter: 0.093(2)<br />
Fig 6: High angle part of the neutron powder diffraction pattern<br />
(D2B, ILL) of the low temperature phase of Nd 2 NiO 4 [11]. (top)<br />
Comparison of the observed pattern with the calculated pattern<br />
using the resolution function of the diffractometer. (bottom)<br />
Observed and calculated pattern using an anisotropic model of<br />
strains with non-null values given in the panel. A list of apparent<br />
strains (x 10 -4 ), extracted <strong>from</strong> the microstructure file, for a selected<br />
number of reflections is also given.
When using this formulation the user cannot refine all<br />
parameters (up to 21) because some of them contributes to<br />
the same term in the quartic form in reciprocal space,<br />
however this allows a better interpretation of the final<br />
results. Taking the appropriate caution one can test<br />
different degrees of correlation between metric parameters.<br />
There are several special formulations, within FullProf, for<br />
working with direct cell parameters instead of using<br />
reciprocal parameters.<br />
Another formulation and a useful notation corresponding<br />
to a grouping of terms was proposed by Stephens [10] who<br />
also included a phenomenological Lorentzian contribution<br />
to the microstrains (the parameter ξ ). The final grouping<br />
of terms simplifies to:<br />
2<br />
2 2 2 2<br />
H K L<br />
( Mhkl) = ( h k l kl hl hk) [ C]<br />
⎜ ⎟=<br />
∑ SHKLh k l<br />
⎜kl<br />
⎟ HKL<br />
{ H+ K+ L=<br />
4}<br />
σ<br />
2<br />
⎛h<br />
⎞<br />
⎜ 2 ⎟<br />
⎜k<br />
⎟<br />
⎜l<br />
⎟<br />
⎜hl<br />
⎟<br />
⎜<br />
hk ⎟<br />
⎝ ⎠<br />
The Stephens’ notation can also be used within FullProf.<br />
A maximum of 15 parameters can be refined for the<br />
triclinic case. Whatever the model used for microstrains<br />
the mixing Lorentzian parameter, ξ , may be used. In<br />
FullProf the function<br />
parameters<br />
D<br />
Cij<br />
or<br />
2 8<br />
ST D<br />
D 2 ST( a<br />
D)<br />
, being<br />
D<br />
S<br />
HKL<br />
, is given by:<br />
2 2<br />
− ⎛180<br />
⎞ σ<br />
( a ) = 10 8Ln2 ⎜ ⎟<br />
⎝ π ⎠<br />
a the set of<br />
( M )<br />
M<br />
hkl<br />
2<br />
hkl<br />
Fig 7: Portion of the neutron diffraction pattern of Pd 3 MnD 0.8 at<br />
room temperature obtained on 3T2 (LLB, λ = 1.22 Å). On top, the<br />
comparison with the calculated profile using the resolution<br />
function of the instrument. Below fit using IsizeModel=-14.<br />
Notice that only the reflections with indices of different parity are<br />
strongly broadened. An isotropic strain, due to the disorder of<br />
deuterium atoms, is also included for all kind of reflections.<br />
An example of anisotropic strain refined using this<br />
formulation is shown in Figure 6, where the neutron<br />
diffraction pattern of the low temperature phase of<br />
Nd 2 NiO 4 is refined using the diffractometer D2B at ILL<br />
[11].<br />
Concerning anisotropic size broadening it is possible to<br />
use a very general phenomenological model, using the<br />
Scherrer formula, that considers the size broadening can be<br />
written as a linear combination of spherical harmonics<br />
(SPH). At present the anisotropic size is supposed to<br />
contribute to the Lorentzian component of the total Voigt<br />
function. A Gaussian contribution will be introduced using<br />
a mixing parameter similar to that used for anisotropic<br />
strain. The explicit formula for the SPH treatment of size<br />
broadening is the following:<br />
β<br />
= λ λ<br />
almpylmp<br />
D cosθ<br />
= ∑<br />
cosθ<br />
Θ Φ<br />
( , )<br />
h h h<br />
h<br />
lmp<br />
where β h<br />
is the size contribution to the integral breadth of<br />
reflection h, y ( Θ , Φ )<br />
lmp h h<br />
are the real spherical<br />
harmonics with normalization as in [12]. The arguments<br />
are the polar angles of the vector h with respect to the<br />
Cartesian crystallographic frame. After refinement of the<br />
coefficients a the program calculates the apparent size<br />
lmp<br />
(in angstroms) along each reciprocal lattice vectors if the<br />
IRF is provided in a separate file.<br />
An important type of defects that give rise to size-like<br />
peak broadening is the presence of anti-phase domains and<br />
stacking faults. These defects produce selective peak<br />
broadening that cannot be accounted using a small number<br />
of coefficients in a SPH expansion. In fact only a family of<br />
reflections verifying particular rules suffers <strong>from</strong><br />
broadening. For such cases there is a number of size<br />
models built into FullProf corresponding to particular sets<br />
of reflections that are affected <strong>from</strong> broadening. In figure 7<br />
it is represented the case of Pd 3 MnD 0.8 [13] of structure<br />
similar to Au 3 Mn and showing the same kind of defects:<br />
anti-phase domains [14]. In figure 8 a portion of the final<br />
microstructural file is shown.<br />
Other models for size broadening in FullProf following<br />
particular rules for each (hkl) are available. Moreover an<br />
anisotropic size broadening modeled with a quadratic form<br />
in reciprocal space is also available. The expression<br />
presently used in FullProf is the following:<br />
( α α α α α α )<br />
F( a ) = k d h + k + l + kl + hl + hk<br />
Z<br />
2 2 2 2<br />
s 1 2 3 4 5 6<br />
where k s is defined as k s =360/π 2 × λ 10 -3 for the 2θ space<br />
and k s =2/π × Dtt1 10 -3 for TOF and Energy space. Simple<br />
crystallite shapes as infinite platelets and needles<br />
(IsizeModel = 1, -1 respectively) are also available.<br />
Together with the size broadening models built into<br />
FullProf and described above, there is another way of<br />
fitting independent size-like parameters for different sets of<br />
reflections. The user may introduce his(her) own rule to be<br />
satisfied by the indices of reflections provided the rule can<br />
be written as a linear equality of the form:<br />
nh+ nk + nl = nn+ n . Where n is an arbitrary<br />
1 2 3 4 5<br />
integer and ni<br />
( i = 1,2,...5) are integers given by the<br />
user. A size parameter is associated to each rule (a<br />
maximum of nine rules may be given per phase) that may<br />
be refined freely or constrained using the codewords<br />
appropriately.<br />
To access this option in FullProf the value of IsizeModel<br />
should be in the interval [-2,-9]. The absolute value of<br />
IsizeModel corresponds to the number of rules<br />
(independent parameters) to be given. If all n i =0 the rule is
! MICRO-STRUCTURAL ANALYSIS FROM FULLPROF (still under development!)<br />
! ==================================================================<br />
! Pattern No: 1 Phase No: 1 Pd3MnD.8 - CFC<br />
... ... ... ... ... ... ... ... ... ... ... ... ... ... ... ... ... ... ...<br />
! Integral breadths are given in reciprocal lattice units (1/angstroms)x 1000<br />
! Apparent sizes are given in the same units as lambda (angstroms) …<br />
! Apparent strains are given in %% (x 10000) (Strain= 1/2 * beta * d)<br />
! An apparent size equal to 99999 means no size broadening<br />
! The following items are output:<br />
... ... ... ... ... ... ... ... ... ... ... ... ... ... ... ... ... ... ...<br />
! The apparent sizes/strains are calculated for each reflection using the formula:<br />
!<br />
! App-size (Angstroms) = 1/(Beta-size)<br />
! App-strain (%%) = 1/2 (Beta-strain) * d(hkl)<br />
!<br />
! (Beta-size) is obtained <strong>from</strong> the size parameters contributing to the FWHM:<br />
! FWHM^2 (G-size) = Hgz^2 = IG/cos^2(theta)<br />
! FWHM (L-size) = Hlz = ( Y + F(Sz))/cos(theta)<br />
!(Beta-strain) is obtained <strong>from</strong> the strain parameters contributing to the FWHM:<br />
! FWHM^2 (G-strain) = Hgs^2 = = (U+[(1-z)DST]^2) tan^2(theta)<br />
! FWHM (L-strain) = Hls = (X+ z DST) tan(theta)<br />
!<br />
! In both cases (H,eta) are calculated <strong>from</strong> TCH formula and then<br />
! Beta-pV is calculated <strong>from</strong>:<br />
!<br />
! beta-pV= 0.5*H/( eta/pi+(1.0-eta)/sqrt(pi/Ln2))<br />
!<br />
! The standard deviations appearing in the global average apparent size and<br />
! strain is calculated using the different reciprocal lattice directions.<br />
! It is a measure of the degree of anisotropy, not of the estimated error<br />
... betaG betaL ... App-size App-strain h k l twtet ...<br />
... 1.4817 11.5859 ... 93.58 41.6395 1 0 0 17.7931 ...<br />
... 2.0954 11.9584 ... 93.58 41.6395 1 1 0 25.2665 ...<br />
... 2.5664 1.5573 ... 99999.00 41.6395 1 1 1 31.0743 ...<br />
... 2.9634 1.7982 ... 99999.00 41.6395 2 0 0 36.0343 ...<br />
... 3.3132 12.6973 ... 93.58 41.6395 2 1 0 40.4625 ...<br />
... 3.6294 12.8892 ... 93.58 41.6395 2 1 1 44.5207 ...<br />
... 4.1909 2.5431 ... 99999.00 41.6395 2 2 0 51.8786 ...<br />
... 4.4451 13.3842 ... 93.58 41.6395 3 0 0 55.2849 ...<br />
... 4.4451 13.3842 ... 93.58 41.6395 2 2 1 55.2850 ...<br />
... 4.6855 13.5301 ... 93.58 41.6395 3 1 0 58.5562 ...<br />
... 4.9142 2.9820 ... 99999.00 41.6395 3 1 1 61.7169 ...<br />
... 5.1327 3.1146 ... 99999.00 41.6395 2 2 2 64.7864 ...<br />
... 5.3423 13.9286 ... 93.58 41.6395 3 2 0 67.7802 ...<br />
... 5.5440 14.0510 ... 93.58 41.6395 3 2 1 70.7114 ...<br />
Fig 8: Portion of the microstructural file (extension mic) corresponding to the fitting of the neutron diffraction pattern in figure 7.<br />
not used. To give a single rule one must put IsizeModel=-2<br />
and put zeros for the last condition. This is needed in order<br />
to avoid the confusion with the case of an infinite needle.<br />
In Figure 10 we give an example using IsizeModel = -2<br />
and in Figure 9 the relevant part of the PCR file is written.<br />
Finally, a general formulation for peak shifts, due to<br />
defects or to residual stresses, has also been implemented.<br />
For JSOL„0, the lines corresponding to shift parameters<br />
are read in the PCR file. Selective shifts can be selected<br />
when IShif
The model is implemented for IShif = 100+NumLaue<br />
(with NumLaue the number of the Laue class according to<br />
FullProf manual) , and a set of parameters corresponding<br />
up to quartic form in hkl can be refined. The position of a<br />
reflection is displaced according to the expressions:<br />
2θ S =2θ B + 2 S h d 2 tanθ × 10 -2<br />
TOF S =TOF B − S h d 3 Dtt1 × 10 -2<br />
(2θ space)<br />
(T.O.F. space)<br />
E S =E B − S h /(2d) Dtt1 × 10 -2 (Energy space)<br />
The expression used for calculating the scalar S h for<br />
reflection h is given by:<br />
S = D2 h k l + D4<br />
h k l<br />
h<br />
∑<br />
∑<br />
H K L H K L<br />
HKL<br />
HKL<br />
{ H+ K+ L= 2} { H+ K+ L=<br />
4}<br />
The free parameters for this option are the sets<br />
D<br />
4 HKL<br />
D2 HKL<br />
and<br />
. To refine these parameters the average cell<br />
parameters of the non-stressed material should be fixed<br />
during the refinement.<br />
NEAR FUTURE OPTIONS IN FULLPROF.<br />
Within these notes I have given a flavor of what can be<br />
done using FullProf in some fields of diffraction<br />
applications. The program is in continuous change and<br />
development. Of course the future developments depend<br />
on the particular field of Science I’m personally interested:<br />
some of the forthcoming options in FullProf reflect my<br />
current interests.<br />
- Treatment of polarized neutrons in the single crystal<br />
option. The refinement of coefficients to model the<br />
spin density, in terms of multipoles (linear<br />
combinations of radial functions and spherical<br />
harmonics), <strong>from</strong> flipping ratio measurements is<br />
already available and under testing but it is not<br />
documented yet.<br />
- Extension of the above formulation for general<br />
electron density modeling and refinement.<br />
- Size parameters corresponding to particular shape of<br />
crystallites.<br />
(4 1 13)<br />
(2 1 21)(4 3 3)<br />
(4 1 15)<br />
(4 3 9)<br />
(5 2 3), (2 1 23)<br />
(4 1 17)<br />
(4 3 11)<br />
Ca 2<br />
MnO 4<br />
(I 4 1<br />
/acd), RT<br />
a=5.187 Å, c=24.123 Å<br />
Broadening: (hkl), l=2n+3<br />
Fig 10: Selective size broadening observed by neutron diffraction at<br />
- room Complete temperature handling (3T2, LLB) for of superstructure crystallographic reflections in<br />
Ca<br />
incommensurate 2 MnO 4 [15]. (top) Size parameter fixed to zero. (bottom) Single<br />
structures. The refinement of<br />
size parameter according to the rule (hkl), l=2n+3. Indices of most<br />
commensurate superstructures in terms of Additional<br />
intense Bragg reflections affected by size broadening are also given.<br />
(4 1 19)<br />
(4 3 15)<br />
Additional linear and quadratic soft constraints<br />
(restrains) defined by the user for arbitrary parameters.<br />
- Complete handling of crystallographic<br />
incommensurate structures. The refinement of<br />
commensurate superstructures in terms of<br />
displacements (modulation) functions is already<br />
available but no totally documented.<br />
- New cost functions in simulated annealing mode:<br />
bond valence sums, potentials, etc.<br />
- New description of rigid bodies and molecular<br />
geometry.<br />
A part <strong>from</strong> these development, a new GUI interface<br />
(EdPCR) for working with the PCR file is being prepared<br />
by Javier González-Platas and myself. This program will<br />
be useful for beginners to prepare a correct PCR file as<br />
well as for everybody to perform all kind of<br />
crystallographic calculations. The program will be working<br />
in Windows and Linux. We hope to provide a first version<br />
of this program before the summer of this year (2002).<br />
ACKNOWLEDGEMENTS<br />
It is a pleasure to thank here all my colleagues that have<br />
contributed with discussions, writing pieces of code, or are<br />
presently contributing with companion programs to<br />
FullProf: Thierry Roisnel, Javier González-Platas, Aziz<br />
Daoud-Aladine, Carlos Frontera, Vincent Rodriguez and<br />
Robert Papoular. I would like to thank many users for<br />
giving me a feedback without which the program could not<br />
be improved.<br />
REFERENCES:<br />
[1] Juan Rodríguez-Carvajal and Thierry Roisnel<br />
“FullProf.98 and WinPLOTR New Windows 95/NT<br />
Applications for <strong>Diffraction</strong>. ”, CPD Newsletter 20,<br />
May-August (1998).<br />
[2] Juan Rodríguez-Carvajal and Javier González-Platas<br />
“Crystallographic library of Fortran 95 modules”<br />
(unpublished)<br />
[3] Javier González-Platas and Juan Rodríguez-Carvajal<br />
“GFourier: a Windows/Linux program to calculate and<br />
display Fourier maps ” (unpublished)<br />
[4] M. Kara, K. Kurki-Suonio, Acta Cryst 37, 201 (1981)<br />
[5] Juan Rodríguez-Carvajal, Materials Science Forum<br />
(2001) ; see also Proceedings of the XVIII Conference<br />
on Applied Crystallography, Ed. Henryk Morawiec and<br />
Danuta Stróz, World Scientific, London 2001, pp 30-36<br />
[6] Thompson, Cox, Hastings, J. Appl. Cryst. 20, 79 (1987)<br />
[7] L.W. Finger, J. Appl. Cryst. 31, 111 (1998)<br />
[8] Microstructure Analysis <strong>from</strong> <strong>Diffraction</strong>, edited by R.<br />
L. Snyder, H. J. Bunge, and J. Fiala, International<br />
Union of Crystallography, 1999.<br />
[9] J. Rodríguez-Carvajal, M.T. Fernández-Díaz and J.L.<br />
Martínez, J. Phys: Condensed Matter 3, 3215 (1991)<br />
[10] P. W. Stephens, J. Appl. Cryst. 32, 281 (1999)<br />
[11] M. T. Fernández-Díaz, M. Medarde and J. Rodríguez-<br />
Carvajal (unpublished).<br />
[12] M. Jarvinen, J. Appl. Cryst. 26, 527 (1993)<br />
[13] P.Onnerud, Y. Andersson, R. Tellgren, P. Norblad, F.<br />
Bourée, G. André, Solid State Comm. 101, 433 (1997)<br />
[14] B.E. Warren, “X-ray <strong>Diffraction</strong>”, Dover Publications,<br />
Inc., New York, 1990.<br />
[15] C. Autret et al. (unpublished).
<strong>Rietveld</strong> <strong>Refinement</strong> and Beyond<br />
D. E. Cox<br />
Physics Department (Emeritus), Brookhaven National<br />
Laboratory, Upton, USA<br />
In the past few years, there has been a distinct trend away<br />
<strong>from</strong> the “classical” applications of the <strong>Rietveld</strong> technique<br />
towards structure solution and determination. By<br />
“classical”, I mean the types of problem typically<br />
encountered in traditional areas of materials science such<br />
as superconductors, magnetic systems, ferroelectrics and<br />
battery materials, in which the structure determination part<br />
of the project is frequently straightforward or even trivial,<br />
but the precise details of the refinement are all-important.<br />
It is clear that this trend has been accentuated both by the<br />
development of very elegant real-space methods of<br />
structure solution and by the availability of more userfriendly<br />
and sophisticated software for traditional methods<br />
of structure solution, especially as applied to small (and<br />
not-so-small) organic molecules, as described in the July<br />
issue of the CPD Newsletter. Another powerful driving<br />
force in my opinion has been the superb quality of the data<br />
that can be collected at second- and third-generation<br />
synchrotron sources (although this is perhaps a more<br />
controversial viewpoint not shared by everyone), but<br />
unfortunately, there still appears to be some reluctance<br />
within the powder diffraction community to exploit these<br />
sources.<br />
In the present article, I will argue that <strong>Rietveld</strong><br />
refinement still has an important role to play in materials<br />
science, but with a number of caveats which were<br />
previously not so apparent in the analysis of laboratory x-<br />
ray and neutron data sets, but which can no longer be<br />
ignored under the harsh glare of a high-resolution<br />
synchrotron x-ray experiment. I will focus on some of<br />
these caveats and possible pitfalls, especially in the context<br />
of some recent diffraction studies of the piezoelectric<br />
perovskite-type system PbZr 1-x Ti x O 3 (commonly known as<br />
PZT) carried out by my colleagues Beatriz Noheda and<br />
Gen Shirane at Brookhaven, together with a number of<br />
collaborators at other institutions. PZT is well-known to<br />
exhibit very desirable piezoelectric properties under an<br />
applied electric field and is the backbone of many<br />
commercial electromechanical devices. For almost four<br />
decades, these properties have been associated with the<br />
coexistence of rhombohedral and tetragonal phases in the<br />
vicinity of the so-called “morphotropic phase boundary”<br />
(an almost vertical line on the temperature-composition<br />
phase diagram at x ˜ 0.48 separating regions with<br />
rhombohedral and tetragonal symmetry, usually called the<br />
MPB), as described in numerous laboratory x-ray and<br />
neutron powder diffraction studies. However, a surprise<br />
was in store, for in 1999 a high-resolution synchrotron x-<br />
ray study of this composition revealed the presence of a<br />
new phase with a slightly-distorted monoclinic<br />
structure[1]. Subsequent <strong>Rietveld</strong> refinement showed that<br />
the polar axis in the new phase was rotated away <strong>from</strong> the<br />
tetragonal [001] axis towards the rhombohedral [111] axis,<br />
and that the monoclinic structure could therefore be<br />
viewed microscopically as a “bridge” between these two<br />
higher-symmetry structures[2]. Since then there have been<br />
numerous experimental and theoretical studies of PZT and<br />
related systems which have provided much new insight<br />
into the relationship between this and other lowersymmetry<br />
phases and their electrical properties.<br />
The optimization of physical properties in temperaturecomposition<br />
phase space is of course a very common<br />
objective in materials science, but as in the case of PZT,<br />
the problems of pseudosymmetry and phase coexistence<br />
are not always recognized, and then <strong>Rietveld</strong> refinement<br />
can at best give only some kind of average structure and at<br />
worst erroneous results. How can such pitfalls best be<br />
avoided? Clearly, high-quality samples and high-resolution<br />
synchrotron data are an excellent starting point. If, as is<br />
often advantageous, Debye-Scherrer diffraction geometry<br />
with a capillary specimen is chosen, it is important not to<br />
degrade the sample by excessive grinding, which can result<br />
in broadened peaks. To this end we routinely adopt the<br />
procedure of lightly crushing ceramic samples (or even<br />
small single crystals) and only using the fraction retained<br />
between 325 and 400 mesh sieves - large boulders by<br />
normal powder diffraction standards!<br />
In an ideal world, a small distortion would be uniquely<br />
revealed by a definite splitting of certain types of peaks,<br />
but unfortunately the situation is often complicated by<br />
anisotropic peak broadening, which is discussed in more<br />
detail by Peter Stephens in another article in this issue.<br />
Such anisotropic broadening has a number of possible<br />
origins; in mixed systems one common cause is the<br />
sensitivity of some of the lattice parameters to the presence<br />
of small long-range fluctuations in composition. Under<br />
these circumstances, we have found that fits to selected<br />
clumps of peaks (preferably with unconstrained individual<br />
peak widths and mixing parameters) prior to <strong>Rietveld</strong><br />
refinement is the best way to unequivocally establish the<br />
presence of a lower-symmetry distortion and/or phase<br />
coexistence. Although pattern-matching techniques<br />
(refinement without a structural model) are frequently<br />
employed for this purpose, it is important to remember that<br />
if anisotropic peak broadening is neglected, the choice of a<br />
lower-symmetry cell will very likely result in an improved<br />
fit, but not necessarily any better than the fit obtained with<br />
a higher-symmetry cell and a generalized model of<br />
anisotropic broadening.<br />
It frequently happens in materials science studies that one<br />
is confronted with the problem of discriminating between<br />
less- and more-constrained structural models, involving<br />
pseudosymmetry, non-stoichiometry, mixed cation<br />
distribution and highly-anisotropic temperature factors<br />
related to static or dynamic cation disorder, to name a few.<br />
In such a situation, is it possible to make any kind of<br />
objective choice between the models? This is not a trivial<br />
question, since the existence of subtle features of this sort<br />
may have an important bearing on understanding the<br />
physical properties, but it is one that statisticians appear<br />
reluctant to address. For want of anything better, one can<br />
use to the Hamilton significance tests [3]. Of course, these<br />
require an estimate of the number of independent<br />
observations (integrated intensities or F 2 ’s), but several<br />
reasonable algorithms have been proposed in the literature<br />
(for example, the number of peaks or clumps of peaks<br />
separated by = 0.5 FWHM). In my experience, these tests<br />
generally work quite well if applied conservatively, even if<br />
they do not meet with the approval of the statisticians. This<br />
type of approach also allows a more realistic estimate of<br />
standard errors [4], but that is another story.<br />
Our ability to extract accurate structural information <strong>from</strong><br />
powder data is now further enhanced by another powerful<br />
and elegant tool, namely the combination of <strong>Rietveld</strong><br />
refinement with <strong>Max</strong>imum Entropy Methods (MEM),
which has been exploited very effectively in the past few<br />
years by Masaki Takata, Matt Sakata and colleagues at<br />
Nagoya University. This is an iterative procedure in which<br />
the features observed in the MEM electron density<br />
distribution at each step are incorporated into an improved<br />
structural model for the next stage of <strong>Rietveld</strong> refinement<br />
until the final distribution is compatible with the structural<br />
model. The application of this technique to materials<br />
science is described for a number of systems in a recent<br />
review article by Takata et al.[5], one beautiful example<br />
being the direct observation of orbital order in the<br />
manganite compound NdSr 2 Mn 2 O 7 . This procedure avoids<br />
the guesswork involved in fine-tuning the structural model<br />
in an unbiased way, and hopefully will become standard<br />
practice in the future.<br />
It is interesting to recall that <strong>Rietveld</strong> refinement was<br />
originally developed for structure analysis based on<br />
neutron powder data, and the powder diffraction<br />
community has a long and distinguished track-record of<br />
using neutron facilities for materials science studies. With<br />
new synchrotron sources being built or planned around the<br />
world, there are rapidly expanding opportunities to exploit<br />
high-resolution synchrotron techniques in the same way.<br />
At the same time, as outlined above, there will be many<br />
new challenges along the way.<br />
REFERENCES<br />
[1] B. Noheda, D. E. Cox, G. Shirane, J. A. Gonzalo, L. E.<br />
Cross and S-E. Park, Appl. Phys. Lett. 74, 2059 (1999).<br />
[2] B. Noheda, J. A. Gonzalo, L. E. Cross, R. Guo, S-E.<br />
Park, D. E. Cox and G. Shirane, Phys. Rev. B 61,<br />
8687 (2000).<br />
[3] W. C. Hamilton, Acta Cryst. 18, 502 (1965).<br />
[4] D. E. Cox and R. J. Papoular, Mater. Science Forum,<br />
228-231, 233 (1996).<br />
[5] M. Takata, E. Nishibori and M. Sakat, Z. Kristallogr.<br />
216, 71 (2001).<br />
Accuracy In X-ray <strong>Powder</strong> <strong>Diffraction</strong>:<br />
A Comparison of Quantitative Methods<br />
Nicola V.Y. Scarlett & Ian C. Madsen<br />
CSIRO Minerals, Bayview Ave, Clayton, VIC 3168,<br />
Australia<br />
nicola.scarlett@csiro.au<br />
The following paper is the summary of a poster<br />
presentation made at “Accuracy in <strong>Powder</strong> <strong>Diffraction</strong><br />
III” (APD III), National Institute of Standards and<br />
Technology, Gaithersburg, Maryland, USA in April 2001.<br />
It is a detailed comparison of different quantitative phase<br />
analysis (QPA) techniques using the IUCr-CPD QPA<br />
round robin sample 1 as the test material. This study was<br />
prompted by the large spread of returns received <strong>from</strong> the<br />
round robin participants which lead to uncertainty in<br />
knowing whether the variability was due to the analytical<br />
methods or their application. In this work, different<br />
analytical methods were tested by the same operators<br />
using the same data sets thus reducing the number of<br />
variables for consideration.<br />
INTRODUCTION<br />
A comparison of commonly used methods of<br />
quantitative phase analysis (QPA) using powder X-ray<br />
diffraction (XRD) methods has been carried out. The<br />
sample mixture used for this study was that distributed by<br />
the IUCr-CPD as sample 1 in its recent round robin on<br />
QPA via diffraction methods 1 . Figure 1 shows the<br />
experimental design of the eight mixtures comprising<br />
sample 1. Figures 2 and 3 show the results returned <strong>from</strong><br />
the round robin for CPD-supplied and participantcollected<br />
data respectively.<br />
QUANTITATIVE METHODS USED<br />
X-ray Fluorescence (XRF) - included as a “standard”<br />
method which in the case of these samples should be the<br />
most accurate and reproducible.<br />
Reference Intensity Ratio 2 (RIR) - single peak (RIR1) or<br />
multi-peak (RIR2) method where RIR (I/I c ) is defined as<br />
the ratio of the strongest peak of any phase j to the<br />
80<br />
Corundum (wt%)<br />
70<br />
60<br />
50<br />
40<br />
30<br />
e<br />
20<br />
10<br />
0<br />
90<br />
10<br />
b<br />
100 a<br />
0<br />
0 10 20 30 40 50 60 70 80 90 100<br />
Fluorite (wt%)<br />
100<br />
90<br />
80<br />
70<br />
60<br />
Zincite (wt%)<br />
Fig. 1 Experimental design for IUCr-CPD round robin<br />
Sample 1 suite.<br />
100<br />
90<br />
80<br />
Corundum (wt%)<br />
70<br />
60<br />
50<br />
1a<br />
1b<br />
1c<br />
1d<br />
1e<br />
1f<br />
1g<br />
1h<br />
40<br />
30<br />
20<br />
10<br />
f<br />
c<br />
h<br />
0<br />
g<br />
0 10 20 30 40 50 60 70 80 90 100<br />
Fluorite (wt%)<br />
100<br />
90<br />
d<br />
80<br />
70<br />
50<br />
60<br />
40<br />
50<br />
30<br />
40<br />
20<br />
Zincite (wt%)<br />
Fig 2 Analysis results - IUCr round robin, CPD-supplied<br />
data. Note the spread of results.<br />
30<br />
20<br />
10<br />
0
strongest corundum peak (113) in a 1:1 mixture (by<br />
weight). In this instance the matrix flushing method of<br />
Chung 3 has been employed thus producing a result<br />
normalised to 100wt%.<br />
Iterative Least Squares (ILS) - single peak (Zevin1) or<br />
multi-peak (Zevin2) method where a series of<br />
simultaneous equations based upon the basic quantitative<br />
phase analysis equation (Eqn 1) are derived using all<br />
samples in the suite. In this instance, the modification of<br />
Zevin 2 has been used where the constant term K<br />
incorporates the mass absorption coefficient of the sample<br />
(µ m ) and the density of the phase and µ m is iteratively<br />
calculated <strong>from</strong> the concentrations using an MS-EXCEL<br />
spreadsheet.<br />
c = K<br />
k<br />
k<br />
I<br />
ik<br />
Eqn 1: Quantitative phase analysis equation of Knudsen 7<br />
where c k is the concentration of phase k, K k is a constant<br />
and I ik is the intensity of the i th peak of phase k.<br />
Mean Normalised Intensity 4 (MNI) - multi peak method<br />
similar to RIR where the mean normalised intensity of all<br />
peaks for a particular phase is used in place of the<br />
intensity of the strongest peak.<br />
<strong>Rietveld</strong> <strong>Refinement</strong> - Whole pattern method where the<br />
refined scale factor of each phase is related to phase<br />
concentration via Eqn 2. This study used two software<br />
packages: Koalariet 6 (<strong>Rietveld</strong>1) and SR5 5 (<strong>Rietveld</strong>2).<br />
c<br />
k<br />
=<br />
sk<br />
( ZMV )<br />
k<br />
s ( ZMV )<br />
∑<br />
i<br />
i<br />
Eqn 2: <strong>Rietveld</strong> equation where c k is the concentration of<br />
phase k, s is the phase dependent, refinable <strong>Rietveld</strong> scale<br />
factor and ZMV are the number, mass and volume<br />
respectively of the formula units in each phase 5 .<br />
RESULTS AND DISCUSSION<br />
Results have been assessed according to a statistic based<br />
on the Kullback-Leibler distance (KLD )8 . This value is<br />
weighted according to the concentration of a phase (Eqn 3)<br />
and may be summed to provide a single numerical<br />
assessment of the accuracy of a determination (Eqn 4).<br />
90<br />
80<br />
60<br />
50<br />
Corundum (wt%)<br />
70<br />
40<br />
1a<br />
1b<br />
1c<br />
1d<br />
1e<br />
1f<br />
1g<br />
1h<br />
30<br />
20<br />
10<br />
0<br />
100<br />
0<br />
0 10 20 30 40 50 60 70 80 90 100<br />
100<br />
90<br />
Fluorite (wt%)<br />
80<br />
70<br />
60<br />
Zincite (wt%)<br />
Fig. 3 Analysis results - IUCr round robin, participantcollected<br />
data. Note that the spread of results is<br />
greater than for the CPD-supplied data.<br />
50<br />
40<br />
30<br />
20<br />
10<br />
Absolute values of this figure (AKLD) have been used to<br />
provide a general estimate of the magnitude of the error.<br />
Averages of these AKLD sum values provide an estimate of<br />
the accuracy of analysis across a particular group, which is<br />
in this case, analytical method. Small values of AKLD sum<br />
represent the most accurate analyses. To assess the<br />
variation of AKLD within a group, an approximate estimate<br />
of the 95% confidence limits can be obtained by first<br />
determining the standard deviation (SD) of all values of<br />
AKLD in the group and calculating the uncertainty<br />
according to Eqn 5. The significance of differences<br />
between groups is based on their combined uncertainties.<br />
KLD = 0.01×<br />
wt%<br />
True<br />
⎛ wt%<br />
× ln<br />
⎜<br />
⎝ wt%<br />
True<br />
Measured<br />
Eqn 3: Kullback-Leibler distance weighted for phase<br />
concentration.<br />
AKLD = AKLD + AKLD + AKLD<br />
sum<br />
corundum<br />
fluorite<br />
Eqn 4: Sum of absolute values of Kullback-Leibler<br />
distance<br />
2*SD of AKLD<br />
Uncertaint y =<br />
N<br />
Eqn 5: Calculation of the uncertainty of the AKLD values<br />
where SD is the standard deviation of the group and N is<br />
the number of values in the group.<br />
Table 1 shows the assessment of the analytical methods<br />
considered here via the calculation of AKLD sum values.<br />
There is little significant difference between any of the<br />
methods and all returned a very low average AKLD sum<br />
value representing accurate analyses. This is borne out in<br />
Figure 4 which shows graphically the results of all<br />
analyses performed using all methods and should be<br />
compared with the spread of returns <strong>from</strong> the IUCr-CPD<br />
round robin (Figures 2 and 3). It is noteworthy that each<br />
group in Figure 4 represents 24 separate analyses (8<br />
analytical methods, three replicates of each).<br />
Analysis<br />
AKLD sum<br />
Method Authors IUCr Round Robin<br />
Participants<br />
CPD<br />
<strong>Data</strong><br />
Participant<br />
<strong>Data</strong><br />
XRF* 0.008(1) 0.008(1) 0.008(1)<br />
MNI 0.016(3) - -<br />
<strong>Rietveld</strong> 1 0.010(3) 0.044(9) 0.044(4)<br />
<strong>Rietveld</strong> 2 0.012(4)<br />
RIR 1 0.009(2) 0.046(32 0.089(19)<br />
RIR 2 0.011(2) )<br />
Zevin 1 0.016(3) - -<br />
Zevin 2 0.015(3) - -<br />
All Methods 0.013(1) 0.044(9) 0.050(2)<br />
Table 1. Assessment of analytical methods via<br />
measurement of AKLD sum .<br />
*XRF value not included in calculation of “All Methods”<br />
AKLD sum<br />
⎞<br />
⎟<br />
⎠<br />
zincite
100<br />
90<br />
80<br />
Corundum (wt%)<br />
70<br />
60<br />
50<br />
40<br />
1a<br />
1b<br />
1c<br />
1d<br />
1e<br />
1f<br />
1g<br />
1h<br />
0 10 20 30 40 50 60 70 80 90 100<br />
Fluorite (wt%)<br />
Fig 4: Analytical results - authors.<br />
CONCLUSION<br />
30<br />
20<br />
10<br />
0<br />
100<br />
90<br />
80<br />
70<br />
60<br />
Zincite (wt%)<br />
The errors reported in the IUCr-CPD round robin returns<br />
for sample 1 are largely operator induced. This study has<br />
shown that, for a simple crystalline system such as this<br />
one, many common methods of quantitative phase analysis<br />
using XRD are adequate. Differences in applicability of<br />
these methods may arise in more complex analytical<br />
systems where problems such as preferred orientation,<br />
microabsorption and presence of amorphous material may<br />
occur.<br />
50<br />
40<br />
30<br />
20<br />
10<br />
0<br />
REFERENCES<br />
1. Madsen, I.C., Scarlett, N.V.Y., Cranswick, L.M.D. and<br />
Lwin, T. (2001) “Outcomes of the International Union<br />
of Crystallography Commission on <strong>Powder</strong> <strong>Diffraction</strong><br />
Round Robin on Quantitative Phase Analysis: Samples<br />
1A to 1H” J. Appl. Cryst. (2001), 34, 409-426.<br />
2. Zevin, L.S. and Kimmel, G. (1995) “Quantitative X-ray<br />
Diffractometry” Springer-Verlag New York, Inc.<br />
3. Chung, F.H. (1974) “Quantitative Interpretation of X-<br />
ray <strong>Diffraction</strong> Patterns of Mixtures II. Adiabatic<br />
Principle of X-ray <strong>Diffraction</strong> Analysis of Mixtures” J.<br />
Appl. Cryst. 7, 526.<br />
4. Li, De Y. and O’Connor, B.H. (1998) “Mean-<br />
Normalized-Intensity (MNI) Method For X-ray <strong>Powder</strong><br />
<strong>Diffraction</strong> Phase Composition Analysis” Material<br />
Science Forum Vol278-281, 57-62 Trans-Tech<br />
Publications Ltd.<br />
5. Hill R.J. and Howard C.J. (1986) “A Computer<br />
Programme for <strong>Rietveld</strong> Analysis of Fixed Wavelength<br />
X-ray and Neutron <strong>Powder</strong> <strong>Diffraction</strong> Patterns”,<br />
AAEC (now ANSTO) Report AAEC/M112.<br />
6. Coelho A.A., Madsen I.C. and Cheary R.W. (1997),<br />
“A New <strong>Rietveld</strong> <strong>Refinement</strong> Program Using a<br />
Fundamental Parameters Approach to Synthesizing<br />
Line Profiles”, Abstract D1-PM2, Proceedings of the<br />
20 th Conference of the Society of Crystallographers in<br />
Australia, April 2 nd -5 th , Queenstown, New Zealand.<br />
7. Knudsen, T. (1981) “Quantitative X-ray <strong>Diffraction</strong><br />
Analysis With Qualitative Control Of Calibration<br />
Samples”, X-ray Spectrometry, 10(2), 54-56.<br />
8. Kullback, S. (1968), “Information Theory and<br />
Statistics”, Dover Publications, 1-11<br />
Internet Available <strong>Rietveld</strong> Software<br />
Lachlan M. D. Cranswick<br />
Collaborative Computational Project No 14 (CCP14)<br />
for Single Crystal and <strong>Powder</strong> <strong>Diffraction</strong><br />
CCP14 - School of Crystallography,<br />
Birkbeck College,<br />
Malet Street, Bloomsbury,<br />
WC1E 7HX, London, UK<br />
Tel: (+44) 020 7631 6849<br />
Fax: (+44) 020 7631 6803<br />
E-mail: l.m.d.cranswick@dl.ac.uk<br />
WWW: http://www.ccp14.ac.uk -<br />
http://ccp14.sims.nrc.ca - http://ccp14.semo.edu<br />
There exists at present a wide genetic diversity of<br />
<strong>Rietveld</strong> programs expressing a range of ideas and<br />
approaches. Many of these software packages are also<br />
available via the Internet for the benefit of the scientific<br />
community. When up against a new structure refinement<br />
of powder diffraction data, it can be worth while exploring<br />
the available <strong>Rietveld</strong> programs to determine which may<br />
be the most appropriate to use with particular problems.<br />
Most can be immediately downloaded, tested and run. The<br />
following represents a non-comprehensive list of what can<br />
be found on the Internet, mentioning some of the<br />
functionality that is available (to exhaustively mention the<br />
.<br />
entire functionality of a single <strong>Rietveld</strong> program could take<br />
quite a few pages). Nearly all the following software can<br />
be obtained via the CCP14 mirrors viewable at<br />
http://www.ccp14.ac.uk/mirror/. Suggestions on additions,<br />
missing information, corrections and elaboration on the<br />
following would be appreciated by sending an E_mail to<br />
the author so it can be included in the next edition of the<br />
CPD newsletter.<br />
<strong>Rietveld</strong> Code of Historical Interest<br />
Some <strong>Rietveld</strong> codes of historical interest are available<br />
on the internet. This includes the original Hugo <strong>Rietveld</strong><br />
report containing Algol source code (H. M. <strong>Rietveld</strong>, “An<br />
ALGOL Program for the <strong>Refinement</strong> of Nuclear and<br />
Magnetic Structures by the Profile Method by H. M.<br />
<strong>Rietveld</strong>”, Reactor Centrum Nederland, April 1969; RCN<br />
104.) at http://www.ccp14.ac.uk/ccp/web-mirrors/-<br />
hugorietveld/riet-report/. This webpage also links to online<br />
versions of the seminal <strong>Rietveld</strong> Method papers.<br />
Another example is the Hugo <strong>Rietveld</strong> & Alan Hewat<br />
Fortran source code for <strong>Rietveld</strong>/Profile <strong>Refinement</strong><br />
viewable at http://www.ccp14.ac.uk/ccp/web-mirrors/-<br />
hewat-rietveld/.<br />
A range of <strong>Rietveld</strong> programs available via the internet<br />
BGMN<br />
Fundamental parameters <strong>Rietveld</strong> for structure<br />
refinement, size-strain and quantitative analysis
Contact: Joerg Bergmann<br />
Email: support@bgmn.de<br />
WWW: http://www.bgmn.de<br />
References: J. Bergmann, R. Kleeberg, and T. Taut “A<br />
new structure refinement and quantitative phase analysis<br />
method basing on predetermined true peak profiles” Z. f.<br />
Kristallographie, Supplement issue No. 8, Europ. Cryst.<br />
Meeting 15 (1994), Book of Abstracts p. 580<br />
While a Graphical User Interface (GUI) version of<br />
BGMN is commercially available <strong>from</strong> Siefert, academics<br />
and student can download a free non-GUI version <strong>from</strong> the<br />
BGMN website which uses an ASCII control file. BGMN<br />
makes use of “fundamental parameters”; high stability<br />
algorithms in modeling the diffraction profile; and a macro<br />
based equation editor. This makes BGMN effective in<br />
obtaining accurate size-strain, structural and quantitative<br />
analysis results.<br />
<strong>Rietveld</strong> refinement program DBWS” (2000). J. Appl.<br />
Cryst. 33, 1189.<br />
DBWS is a <strong>Rietveld</strong> program whose source code has<br />
spawned a number of variants (Fullprof, LHPM, SR5,<br />
Riet7, Rietica, etc), but still has a free-standing active<br />
existence. Applications of DBWS include structure<br />
refinement of colossal magnetoresistance materials,<br />
thermoelectrics and negative thermal expansion ceramics,<br />
quantitative analysis and crystallite size and microstrain<br />
analysis. While DBWS is normally controlled via an<br />
ASCII input file, the recently written DBWSTool can act<br />
as a Graphical User Interface (GUI) for setting up a<br />
starting ASCII input file and controlling the refinement.<br />
Fig 1: BGMN quantitative analysis fit to reference sample<br />
Metashale Böhlscheiben, “Bergmann, J., Kleeberg,<br />
R.,Taut, T., Haase, A., 1997: Quantitative Phase<br />
Analysis Using a New <strong>Rietveld</strong> Algorithm -<br />
Assisted by Improved Stability and Convergence<br />
Behavior. Adv. X-Ray Analysis 40 (1997).”<br />
DBWS<br />
<strong>Rietveld</strong> <strong>Refinement</strong>, quantitative phase analysis<br />
and size-strain analysis.<br />
OS: DOS/MS-Windows, SUN Solaris and Linux<br />
Contact: Ray Young<br />
Email: r.young@physics.gatech.edu<br />
WWW:http://www.physics.gatech.edu/downloads/youn<br />
g/DBWS.html<br />
References: R. A. Young, A. Sakthivel, T. S. Moss and C.<br />
O. Paiva-Santos, “DBWS-9411 - an upgrade of the DBWS<br />
programs for <strong>Rietveld</strong> <strong>Refinement</strong> with PC and mainframe<br />
computers”, J. Appl. Cryst., Vol. 28, 366-7; 1995<br />
DBWSTOOL<br />
Graphical User Interface for creating and controling<br />
DBWS input files<br />
OS: MS-Windows<br />
Contact: Lucas Bleicher<br />
Email: sasaki@fisica.ufc.br<br />
WWW: http://www.fisica.ufc.br/raiosx/DBWS.htm<br />
Download FTP: http://www.ccp14.ac.uk/ccp/ccp14/ftpmirror/dbwsgui/pub/<br />
References: L. Bleicher, J. M. Sasaki and C. O. Paiva<br />
Santos. “Development of a graphical interface for the<br />
Fig 2: Starting screen for DBWSTools; a graphical user<br />
interface for DBWS <strong>Rietveld</strong>.<br />
Fullprof<br />
Single crystal and powder diffraction refinement<br />
software<br />
OS: MS-Windows, DOS, SUN Solaris and Linux<br />
Contact: Juan Rodriguez-Carvajal<br />
Email: juan@bali.saclay.cea.fr<br />
WWW: http://www-llb.cea.fr/fullweb/powder.htm<br />
Download FTP:<br />
ftp://charybde.saclay.cea.fr/pub/divers/fullprof.2k/<br />
References: J. Rodriguez-Carvajal, Abstr. 15 th Conf. Int.<br />
Union Crystallogr. (Toulouse, France) 1990, p. 127,<br />
Satellite Meeting on <strong>Powder</strong> <strong>Diffraction</strong>.<br />
The Fullprof <strong>Rietveld</strong> software can perform a variety of<br />
refinement types, including combined X-ray / Neutron;<br />
TOF neutron; fixed angle INEL PSD data, incommensurate<br />
refinement, magnetic refinement. Fullprof is normally<br />
controlled via an ASCII input file and links to a number of<br />
utility programs such as Winplotr utility software (by<br />
Thierry Roisnel and Juan Rodriguez-Carvajal), JfullProf<br />
GUI for Fullprof (by Alain Bouvet) and GFOUR Fourier<br />
software (by Javier Gonzalez-Platas and Juan Rodriguez-<br />
Carvajal). As Fullprof is the subject of a separate article in<br />
this issue of the CPD newsletter, the following will<br />
concentrate on the Winplotr software provided with<br />
Fullprof.<br />
Winplotr for MS-Windows by Thierry Roisnel and Juan<br />
Rodriguez-Carvajal provides a wide range of functionality.<br />
This includes the ability to plot Fullprof PRF, Jana2000<br />
PRF, Rietian2000 PAT and Debvin GRA <strong>Rietveld</strong> plot<br />
files; not only in 2-theta/TOF space, but also Q (Å -1 ), d<br />
(Å), sinTheta/Lambda and “s” (= 1/d). Winplotr will open<br />
Fullprof, GSAS, CPI and other raw data file formats. <strong>Data</strong><br />
analysis includes background selection, peak find (manual<br />
and automatic), peak profiling, integration, summation,<br />
averaging, background subtraction and passing peak<br />
positions to various indexing programs included with the
Winplotr distribution (WinIto, WinDicvol, WinTreor and<br />
supercel). At the termination of a successful powder<br />
indexing session, Winplotr can also create starting Fullprof<br />
PCR files.<br />
EXPGUI<br />
Graphical User Interface for GSAS running on Windows<br />
and UNIX<br />
OS: MS-Windows, SGI IRIX and Linux<br />
Contact: Brian Toby<br />
Email: Brian.Toby@nist.gov<br />
WWW:<br />
http://www.ncnr.nist.gov/programs/crystallography/softwar<br />
e/expgui/<br />
References: B. H. Toby, EXPGUI, a graphical user<br />
interface for GSAS, J. Appl. Cryst. (2001). 34, 210-213.<br />
EXPGUI allows people familiar with Windows style<br />
graphical user interfaces to quickly and intuitively start<br />
using GSAS. EXPGUI also has extra functionality not<br />
available in the standard GSAS package. This includes the<br />
ability to graphically select a manual background<br />
(BKGEDIT) and fit it to a Chebyshev function; graphically<br />
exclude regions (EXCLEDT); and the display of<br />
“cumulative chi squared plots” [W.I.F. David, "Beyond<br />
least-squares analysis in profile refinement"; Accuracy in<br />
<strong>Powder</strong> <strong>Diffraction</strong>-III, 2001]. The latest versions also<br />
include the ability to set up dummy histograms and<br />
enable/disable histograms (diffraction patterns).<br />
Fig 3: Winplotr (supplied with Fullprof) a) viewing a<br />
<strong>Rietveld</strong> plot file while also showing the variety of<br />
raw data file formats in can open; and b)<br />
displaying diffraction patterns in a pseudo 3D plot<br />
as described in the Winplotr tutorials at :<br />
http://www-llb.cea.fr/fullweb/winplotr/wpl_demo.htm.<br />
GSAS<br />
Single crystal and powder diffraction refinement<br />
software<br />
OS: MS-Windows, SGI IRIX and Linux<br />
Contact: Bob Von Dreele and Alan Larson<br />
Email: vondreele@lanl.gov<br />
Download FTP: ftp://ftp.lanl.gov/public/gsas/<br />
References: A.C. Larson and R.B. Von Dreele, "General<br />
Structure Analysis System (GSAS)", Los Alamos National<br />
Laboratory Report LAUR 86-748 (1994).<br />
The GSAS structure refinement suite is controlled by a<br />
menu based system, and can handle a range of structures<br />
including proteins. GSAS has a large number of restraint<br />
types; the ability to refine on single crystal and powder<br />
diffraction data. Combined refinement of X-ray / Neutron<br />
data can be performed, including TOF Neutron and Energy<br />
Dispersive X-ray data. A large number of utilities plug<br />
into GSAS or can make use of GSAS files and a list of<br />
these is available via the CCP14 website at<br />
http://www.ccp14.ac.uk/solution/gsas/. As GSAS is the<br />
subject of a separate article in this issue of the CPD<br />
newsletter, the following will concentrate on Brian Toby’s<br />
EXPGUI software, which is a Graphical User Interface<br />
(GUI) for GSAS running on UNIX and Windows.<br />
Fig 4: The new BKGEDT function in Brian Toby’s<br />
EXPGUI for manually defining the background<br />
(triangles) which can then be fitted by a<br />
Chebyshev function and saved in the GSAS EXP<br />
file. The poor difference curve is <strong>from</strong> the<br />
previous “refined” background during Le Bail<br />
fitting.<br />
Jana2000<br />
Single crystal and powder diffraction refinement of<br />
Standard, Modulated and Composite Structures<br />
OS: Windows and UNIX (IRIX, Linux, etc)<br />
Contact: Vaclav Petricek & Michal Dusek<br />
Email: petricek@fzu.cz or dusek@fzu.cz<br />
WWW: http://www-xray.fzu.cz/jana/jana.html
FTP Download: ftp://ftp.fzu.cz/pub/cryst/jana2000<br />
References: Dusek, M., Petricek, V., Wunschel, M.,<br />
Dinnebier, R.E. and Smaalen, S. van (2001),<br />
J.Appl.Cryst.34, 398-404, <strong>Refinement</strong> of modulated<br />
structures against X-ray powder diffraction data with<br />
Jana2000 and Petricek,V. & Dusek,M.(2000). The<br />
crystallographic computing system JANA2000. Institute of<br />
Physics, Praha, Czech Republic.<br />
A recent change in the Jana single crystal suite is the<br />
ability to now refine on powder diffraction data via an<br />
extension to the Jana Graphical User Interface (GUI). This<br />
was made possible using source code and implementation<br />
details provided by Bob von Dreele. As well as reading its<br />
own data format, Jana2000 can also read GSAS and<br />
RIETAN data file formats. In the latest beta version,<br />
Jana2000 can handle multiple phases. Other features<br />
include Le Bail fitting, modelling peak asymmetry via the<br />
Finger, Cox, Jephcoat method; and anisotropic peak<br />
broadening via the Stephens method (J. Appl. Cryst. 32,<br />
281 (1999)). As information on powder refinement has not<br />
made it into the Jana manual, there is a web tutorial at<br />
http://www-xray.fzu.cz/jana/Jana2000/powders.html ;<br />
again with mirrors via the CCP14 websites:<br />
UK: http://www.ccp14.ac.uk/ccp/webmirrors/jana/jana/Jana2000/powders.html<br />
Canada:<br />
http://ccp14.sims.nrc.ca/ccp/webmirrors/jana/jana/Jana2000/powders.html<br />
US:<br />
http://ccp14.semo.edu/ccp/webmirrors/jana/jana/Jana2000/powders.html<br />
more.", Proceeding of the Twelfth International Conference<br />
on Textures of Materials (ICOTOM-12), edited by Szpunar<br />
J. A., August 9-13, 1999, Montreal, Canada. Vol. 2, 1599.<br />
MAUD (Material Analysis Using <strong>Diffraction</strong>) for Java is<br />
optimised for materials analysis and runs controlled by a<br />
Graphical User Interface (GUI). Capabilities include<br />
quantitative analysis (with the new ability to import an<br />
HKL file if the structure is lacking); size-strain-shape<br />
analysis; pole-figure analysis, and other materials analysis.<br />
New developments in MAUD are also being implemented<br />
to assist in structure solution <strong>from</strong> powder diffraction using<br />
genetic algorithms. Web tutorials are available via the<br />
MAUD webpage at http://www.ing.unitn.it/~luttero/-<br />
maud/tutorial/, showing how techniques such as<br />
quantitative analysis; digitising a diffraction image; and<br />
texture analysis <strong>from</strong> traditional pole figures. MAUD is<br />
distributed under the GNU Public Licence such that its<br />
source code can be freely modified. For information on the<br />
GNU General Public License, refer to<br />
http://www.gnu.org/copyleft/gpl.html.<br />
Fig 5: Fourier contour map viewing as part of Jana 2000.<br />
<strong>Powder</strong> refined structures have access to all the<br />
relevant facilities of the Jana2000 software;<br />
including Fourier map generation and viewing;<br />
charge density analysis; etc.<br />
MAUD for Java<br />
GPL’d materials science <strong>Rietveld</strong> for structure<br />
refinement, crystallite size-strain-shape, polefigure<br />
and quantitative analysis.<br />
OS: Any Java enabled platform (Mac, Windows, UNIX)<br />
as well as GPL’d source code<br />
Contact: Luca Lutterotti<br />
Email: Luca.Lutterotti@ing.unitn.it<br />
WWW: http://www.ing.unitn.it/~luttero/maud/<br />
References: L. Lutterotti, S. Matthies and H. -R. Wenk,<br />
“MAUD (Material Analysis Using <strong>Diffraction</strong>): a user<br />
friendly Java program for <strong>Rietveld</strong> Texture Analysis and<br />
Fig 6: Screen images of MAUD for Java <strong>Rietveld</strong><br />
software in action while performing texture / pole<br />
figure analysis as described in the tutorial at<br />
http://www.ing.unitn.it/~luttero/maud/tutorial/OD<br />
F<strong>from</strong>PF/<br />
Prodd<br />
<strong>Powder</strong> diffraction refinement with the source code<br />
bundled up in the CCSL (Cambridge Crystallography<br />
Subroutine Library)<br />
OS: DOS executable and source code available <strong>from</strong> the<br />
authors<br />
Contact: Jon Wright and Bruce Forsyth<br />
Email: wright@esrf.fr
WWW:<br />
http://www.ccp14.ac.uk/ccp/web-mirrors/prodd/~jpw22/<br />
CCSL WWW: http://www.ill.fr/dif/ccsl/<br />
References: J P Wright & J B Forsyth “Profile<br />
<strong>Refinement</strong> of <strong>Diffraction</strong> <strong>Data</strong> using the Cambridge<br />
Crystallographic Subroutine Library (CCSL)”; Rutherford<br />
Appleton Laboratory Report RAL-TR-2000-012; Version<br />
1.0; May 2000.<br />
Prodd is a new “hackers” <strong>Rietveld</strong> for those who may<br />
have structure refinement problems that are not doable in<br />
existing <strong>Rietveld</strong> binaries (thus requiring custom coding).<br />
An extra advantage is that Prodd is based around the CCSL<br />
(Cambridge Crystallography Subroutine Library). Though<br />
to learn the rest of the CCSL would result in a higher<br />
learning curve. Prodd is controlled by editing an ASCII file<br />
and supports time of flight and constant wavelength<br />
neutron data as well as synchrotron X-ray; but not (at<br />
present) laboratory X-ray data.<br />
Profil is controlled by an ASCII input file, and has<br />
features relevant to complex <strong>Rietveld</strong> refinement;<br />
including the refinement of molecular compounds.<br />
Features include automatic constraints with respect to<br />
atoms on special positions and swapping between isotropic<br />
and anisotropic thermal formats. Available bond restraints<br />
include bond angle, bond length and “same” restraints.<br />
There is a newly added “multiple site chemical<br />
composition restraint” which, like the similar GSAS “total<br />
chemistry restraint”, can be used as a charge balance<br />
restraint. Spacegroups are defined by symmetry operators,<br />
which Profil interprets and outputs the spacegroup symbol<br />
to the user (or an error if the symmetry operators do not<br />
describe a complete set). Thus Profil can handle quite<br />
complex (and useful) commensurate non-standard cell<br />
types relevant to materials science (e.g., F2/d monoclinic).<br />
(Refer: J. K. Cockcroft, A. Simon, H. Borrmann, & A.<br />
Obeymeyer. “The crystal structures of the low-temperature<br />
modifications of deuterium iodide - A neutron study.”;<br />
European Journal of Solid State Inorganic Chemistry 1988,<br />
25, 471-481.).<br />
Fig 7: Two fits for FeAsO4 on POLARIS (3 detector<br />
banks, <strong>from</strong> J.P.Wright, PhD Thesis, Univ. of<br />
Cambridge). One fit has magnetic peaks, the other<br />
does not. Description of the magnetic structure in<br />
in Forsyth JB, Wright JP, Marcos MD, Attfield JP,<br />
Wilkinson C; "Helimagnetic order in ferric<br />
arsenate, FeAsO4"; Journal of Physics-Condensed<br />
Matter, 11 (6): 1473-1478 Feb 15 1999.<br />
Profil<br />
<strong>Rietveld</strong> that automatically handles atomic and<br />
anisotropic symmetry; and with restraints suitable for<br />
refinement of molecular compounds.<br />
OS: DOS/Windows and VMS<br />
Contact: Jeremy Cockcroft<br />
Email: cockcroft@gordon.cryst.bbk.ac.uk<br />
WWW: http://img.cryst.bbk.ac.uk/www/cockcroft/-<br />
profil.htm<br />
FTP Download: ftp://img.cryst.bbk.ac.uk/pdpl/<br />
References: J. K. Cockcroft & A. N. Fitch. “The solid<br />
phases of sulphur hexafluoride by powder neutron<br />
diffraction.” Zeitschrift fur Kristallographie 1988, 184,<br />
123-145.<br />
Fig 8: Structure of SF6. The Profil refinement involved<br />
making liberal use of the “same” bond-length<br />
restraint (required due to pseudo-symmetry). Cited in<br />
J. K. Cockcroft & A. N. Fitch. “The solid phases of<br />
sulphur hexafluoride by powder neutron diffraction.”<br />
Zeitschrift fur Kristallographie 1988, 184, 123-145.<br />
Rietan<br />
GPL’d powder diffraction refinement with MEM-based<br />
whole-pattern fitting<br />
OS: Mac OS, MS-Windows and GPL’d source code<br />
Contact: Fujio Izumi<br />
Email: IZUMI.Fujio@nims.go.jp<br />
WWW:<br />
http://homepage.mac.com/fujioizumi/rietan/angle_dispersi<br />
ve/angle_dispersive.html<br />
References: F. Izumi and T. Ikeda, Mater. Sci. Forum,<br />
321-324 (2000) 198-203 and F. Izumi, S. Kumazawa, T.<br />
Ikeda, W.-Z. Hu, A. Yamamoto, and K. Oikawa, Mater.Sci.<br />
Forum, 371-381 (2001) 59-64.<br />
As one of its features, Rietan2000 is presently the only<br />
<strong>Rietveld</strong> program which implements MEM (maximumentropy<br />
method)-based whole-pattern fitting; making it<br />
possible to represent a crystal structure with<br />
electron/nuclear densities. It is controlled by an ASCII
input file and is provided as executables and source code<br />
under the GNU Public Licence. For information on the<br />
GNU General Public License, refer to<br />
http://www.gnu.org/copyleft/gpl.html. As Rietan2000 is<br />
the subject of a separate article in this issue of the CPD<br />
newsletter, its features will not be elaborated here.<br />
Fig 9: Example <strong>Rietveld</strong> plot and structure refined with<br />
Rietan2000.<br />
Rietica<br />
Sequel to the LHPM <strong>Rietveld</strong> with a complete graphical<br />
user interface<br />
OS: MS-Windows<br />
Contact: Brett Hunter<br />
Email: bah@ansto.gov.au<br />
WWW: http://www.rietica.org<br />
FTP<br />
Download:<br />
ftp://ftp.ansto.gov.au/pub/physics/neutron/rietveld/Rietica_<br />
LHPM95/<br />
References: Hunter B. (1998) Rietica - A visual <strong>Rietveld</strong><br />
program, International Union of Crystallography<br />
Commission on <strong>Powder</strong> <strong>Diffraction</strong> Newsletter No. 20,<br />
(Summer) http://www.rietica.org<br />
Rietica is the sequel to the LHPM <strong>Rietveld</strong> software and<br />
has a complete Graphical User Interface (while still<br />
retaining the traditional ability to edit an ASCII control<br />
file). Combined refinement can be performed on X-ray<br />
and neutron data (constant wavelength and TOF) as well as<br />
easy point and click mass Le Bail fitting. As well as the<br />
ability to import GSAS EXP and Fullprof PCR refinement<br />
files, it also includes an implementation of I. D. Brown’s<br />
method for bond-valence calculation that can be used to<br />
check refined structures at the click of a menu option.<br />
WinMprof<br />
<strong>Rietveld</strong> refinement with bond restraints (including the<br />
“same” restraint) and features suitable for restrained<br />
refinement of molecular structures.<br />
OS: MS-Windows<br />
Contact: Alain Jouanneaux<br />
Email: jouanneaux@univ-lemans.fr<br />
WWW: http://lpec.univ-lemans.fr/WinMProf/<br />
References: A. Jouanneaux, X. Le Gonidec and A.N.<br />
Fitch "WinMProf : a visual <strong>Rietveld</strong> software" EPDIC7 :<br />
Materials Science Forum vols 378-381 (2001), pp 112-117.<br />
WinMprof for MS-Windows includes such functionality<br />
as: Le Bail fitting; peak asymmetry correction using the<br />
Finger, Cox, Jephcoat method ((1994) J. Appl. Cryst. 27,<br />
892) or the Bérar & Baldinozzi function ((1993) J. Appl.<br />
Cryst. 26, 128); anisotropic peak profiling via the<br />
Anisotropic Variable method (A. Le Bail & A. Jouanneaux<br />
(1997) J. Appl. Cryst. 30, 265) and the Stephens<br />
Phenomenological method (J. Appl. Cryst. 32, 281<br />
(1999)); as well as in-built difference Fourier calculation;<br />
and in-built bond length and angle calculation. Another<br />
feature (besides standard distance and angle bond<br />
restraints) is the ability to perform “same” bond-length<br />
restraints; which can be very useful for refinement of<br />
molecular organic structures. Other features include the<br />
ability to output to a wide variety of third party programs<br />
such as Shelxs/Shelxl, Platon WinOrtep, EXPO, Struvir,<br />
WinStruplo, WinPlotr and GFOUR Fourier software. A<br />
graphical shell for Windows, displaying <strong>Rietveld</strong> plot files<br />
and calling the various ASCII input files is included with<br />
the distribution.<br />
Fig 11: Example of a Norbornene <strong>Rietveld</strong> goodness of fit<br />
plot in the WinMprof MS-Windows interface<br />
overlaid with the structure of Norbornene. The<br />
refinement included the use of anisotropic pseudo-<br />
Voigt PSF (P.W. Stephens (1999) J. Appl. Cryst. 32,<br />
281) and Bayesian constraints on distances and<br />
angles in the molecules. As cited in M. Brunelli,<br />
A.N. Fitch, A. Jouanneaux and A.J. Mora “Crystal<br />
and molecular structures of norbornene” Zeitschrift<br />
fur Kristallographie vol 216, p 51-55 (2001).<br />
Fig 10: Screen image of Rietica running a multi-dataset<br />
refinement involving 22 powder histograms.
XND<br />
<strong>Rietveld</strong> structure refinement on normal and<br />
incommensurate structures and real-time powder<br />
diffraction refinement<br />
OS:<br />
PC Windows, UNIX, Linux, SunOS SGI IRIX, HP-UX<br />
(“c” source code included)<br />
Contact: Jean-Francois Berar<br />
Email: berar@polycnrs-gre.fr<br />
WWW:<br />
http://www-cristallo.polycnrs-gre.fr/xnd/xnd.html<br />
Download: ftp://ftp.polycnrs-gre.fr/pub/xnd/<br />
References: G. Baldinozzi, D. Grebille and J-F. Bérar,<br />
Proceedings of Aperiodic' 97, World Scientific (1999)<br />
p297-301.<br />
The major abilities of the XND <strong>Rietveld</strong> includes the<br />
refinement of incommensurate structures; refinement of<br />
multiple datasets (Bragg-Brentano X-ray, neutron,<br />
synchrotron); and of combined refinement of a range of<br />
powder diffraction patterns changing by a parameter (such<br />
as temperature, pressure, magnetic field, electric field,<br />
time, etc). If the structure is unknown, the lattice can be<br />
modelled by the Le Bail method; and if the lattice is<br />
unknown, d-spacings can be modelled. XND can handle<br />
anomalous scattering for the analysis of multi-wavelength<br />
experiments (such as distinguishing the valences of ions in<br />
complex ferrites).<br />
Control of the refinement is performed via the editing of<br />
an ASCII control file. Other features include the ability to<br />
handle variable step scans; modelling of parasitic<br />
wavelengths (Tungsten, K-beta, etc); and setting up<br />
equations linking together various parameters. Besides the<br />
main XND documentation, some tips on using XND are<br />
available at http://www.ccp14.ac.uk/tutorial/xnd/.<br />
XRS-82/DLS<br />
<strong>Rietveld</strong> structure refinement (with restraints) and<br />
distance least squares refinement<br />
OS: UNIX, Linux, VMS, DOS, OS/2<br />
Contact: Christian Baerlocher<br />
Email: ch.baerlocher@kristall.erdw.ethz.ch<br />
WWW: http://www.kristall.ethz.ch/LFK/software/<br />
Download: http://www.kristall.ethz.ch/LFK/software/xrs/<br />
References: Ch. Baerlocher: The X-ray <strong>Rietveld</strong> System,<br />
XRS-82, Version of September 1982. Institut fuer<br />
Kristallographie und Petrographie, ETH Zuerich and Ch.<br />
Baerlocher, A. Hepp, W.M. Meier: DLS-76, a program for<br />
the simulation of crystal structures by geometric<br />
refinement. Institut fuer Kristallographie und<br />
Petrographie, ETH Zuerich.<br />
XRS-82/DLS is a <strong>Rietveld</strong> system primarily associated<br />
with the modelling and refinement of complex zeolitic<br />
structures. The primary interface in controlling the<br />
program is a series of ASCII files. In principle, there is no<br />
limit to the number of atoms that XRD-82/DLS can<br />
handle; as long as there are more restraints (bonds/angles)<br />
than there are variable atom co-ordinates.<br />
For assistance in generating DLS and XRS-82 control<br />
files, Kriber by Roland Bialek can be used<br />
(http://www.kristall.ethz.ch/LFK/software/kriber/).<br />
Fig 12: Example of an XND refined structure; an idealised<br />
view of the incommensurate Sr 14 Cu 24 O 41 type<br />
structure as cited in : S. Pachot, C. Darie, J.F. Berar,<br />
P. Bordet, C. Bougerol-Chaillout; “<strong>Refinement</strong> of<br />
incommensurate misfit compounds : Sr 14-<br />
xCa x Cu 24 O 41 ” EPDIC 7, Barcelona; to appear in<br />
Material Sciences Forum.<br />
Fig 13: A 117 atom zeolite structure refined with<br />
XRS82/DLS as published in: Wessels, T.,<br />
Baerlocher, Ch., McCusker L.B. and Creyghton,<br />
E.J. "An ordered form of the extra-large-pore<br />
zeolite UTD-1: its synthesis and structure analysis<br />
<strong>from</strong> powder diffraction data" (1999) J. Am. Chem.<br />
Soc., 121, 6242-6247
Dealing with unknown impurity phases<br />
W I F David,<br />
ISIS Facility, Rutherford Appleton Laboratory,<br />
Chilton, Oxon., OX11 0QX, UK<br />
INTRODUCTION<br />
What do you do when you want to perform a <strong>Rietveld</strong><br />
analysis of a particular material but have a substantial<br />
impurity phase and despite all your best attempts you can<br />
neither remove it <strong>from</strong> your sample nor index it <strong>from</strong> your<br />
diffraction pattern? Conventional wisdom would state that<br />
your chances of obtaining unbiased structural parameters<br />
are poor and that the best you can do is to manually<br />
exclude the offending impurity peaks. Standard <strong>Rietveld</strong><br />
programs that are based upon a least-squares refinement<br />
algorithm cannot cope in an unbiased manner with an<br />
incomplete model description of the data. This is just the<br />
situation where Bayesian probability theory can come to<br />
the rescue. We can ask the question, “How do I perform a<br />
refinement on a powder diffraction pattern when I know<br />
that there is an impurity phase present but have no idea<br />
what that impurity phase may be?” This question is<br />
equivalent to stating that my diffraction pattern contains a<br />
component that I can model (known phases + background)<br />
and an additional positive, unknown contribution. It turns<br />
out that enforcing the positivity of the unknown<br />
component as an additive contribution is sufficient to<br />
produce excellent results [1].<br />
The mathematical development of these ideas has<br />
been presented elsewhere [1,2] and results in a modified χ 2<br />
goodness of fit function that is shown in Fig. 1. For<br />
observed data that are less than the model function, the<br />
new goodness of fit behaves essentially identically to the<br />
standard χ 2 . This is to be expected since such points are<br />
unlikely to be associated with an impurity contribution. On<br />
the other hand, when the observed data value is<br />
substantially greater than the fitted model value, then the<br />
new goodness of fit brings a substantially smaller penalty<br />
(the function varies logarithmically) than the quadratic<br />
behaviour of the standard χ 2 . Again this is just what is<br />
required to minimise the impact of any impurity phase.<br />
Note also that the curvature of the new goodness of fit is<br />
shallower than the standard χ 2 . This means that quoted<br />
standard deviations will be higher for refinements using<br />
the new goodness of fit. This is to be expected as the<br />
allowance for an impurity phase brings a greater<br />
uncertainty into the model parameter values.<br />
EXPERIMENTAL<br />
<strong>Diffraction</strong> patterns of yttria and rutile were collected on<br />
HRPD at ISIS. Results <strong>from</strong> the 5% yttria : 95% rutile are<br />
shown in Fig 3. (The fitted diffraction pattern of pure yttria<br />
is shown in Fig 2 for comparison.) In order to accentuate<br />
the difference between the new goodness of fit function<br />
and standard least-squares analysis, we have chosen to<br />
refine the minority yttria phase treating the majority phase<br />
as the impurity (see Fig 3a). The excellent fit to the data<br />
for the modified χ 2 is shown in Fig 3b where we have<br />
graphically downweighted the observed points, which<br />
contribute least to the goodness of fit. This emphasizes<br />
Fig. 1 The modified robust goodness of fit function<br />
(solid line) compared with the standard quadratic<br />
least-squares function.<br />
Fig. 2. The observed and calculated diffraction<br />
patterns for pure yttria determined on HRPD at<br />
ISIS.<br />
what the algorithm is effectively doing – large positive<br />
(obs-calc)/esd values are essentially ignored. In effect, the<br />
algorithm is optimally excluding those regions that do not<br />
contribute to the model. The relative calculated peak<br />
intensities agree very well with the results for pure yttria<br />
(Fig 2).<br />
Least squares analysis (Fig 3c) produces a completely<br />
different result – all points are considered with no<br />
downweighting for possible impurities. The first obvious<br />
effect is that the refined background is too high. The<br />
reason for this is obvious since the strong impurity peaks<br />
lift up the model fit. The relative peak intensities are<br />
however also very different <strong>from</strong> the correct values<br />
suggesting that the refined structural parameters are<br />
substantially in error. This is indeed the case and is borne<br />
out by analysis of the refined zirconium and oxygen<br />
coordinates, which are shown graphically in Fig 4 as a<br />
function of yttia content. We briefly consider the other<br />
refined parameters (a fuller analysis is given in [1]). The<br />
scale factor is correct within estimated standard deviation<br />
(esd’s) for the robust analysis but behaves wildly for the<br />
standard least squares, exceeding 1000% for 25% yttria<br />
content. The least-squares analysis of the lattice constant<br />
also becomes increasingly unreliable as the refinement<br />
locks into peaks associated with rutile as well as yttria. On<br />
the other hand, the lattice constant <strong>from</strong> the robust<br />
refinement is satisfyingly stable; the esd’s increase as the<br />
yttria content decreases (the 5% e.s.d. is some five times<br />
larger than the 100% value) but all results lie within a<br />
standard deviation of the correct result.
CONCLUSIONS<br />
Least-squares <strong>Rietveld</strong> analysis is the best and leastbiased<br />
method of structure refinement <strong>from</strong> a powder<br />
diffraction pattern when the data can be fully modeled.<br />
However, when there is an unmodeled impurity<br />
contribution in the diffraction pattern, least-squares<br />
analysis gives biased results. In the example discussed in<br />
this contribution, significant deviations <strong>from</strong> the correct<br />
parameter values occur when there is as little as a 10%<br />
impurity contribution. At higher impurity levels, leastsquares<br />
analysis is completely unreliable. These problems<br />
may, however, be overcome if the existence of an<br />
unknown impurity contribution is built into the refinement<br />
Fig 4. The refined atomic coordinates of yttria plotted as a function<br />
of yttria composition. Open circles and filled squares<br />
correspond to the least-squares and robust analyses,<br />
respectively. (a) The yttrium x coordinate. (b), (c), (d) The<br />
oxygen x, y and z coordinates. The dotted lines correspond to<br />
the correct values obtained <strong>from</strong> least-squares refinement of<br />
the pure-yttria diffraction<br />
algorithm. While it might seem to be a logical<br />
inconsistency to build in information about an unknown<br />
contribution, Bayesian probability theory provides a<br />
framework for doing just this. Only two broad assumptions<br />
are necessary to derive an appropriate modified probability<br />
distribution function. These are (i) that the impurity<br />
contribution must be intrinsically positive and (ii) that its<br />
magnitude, A, is unknown and thus best modeled by a<br />
Jeffreys' prior, given by p(A|I) 1/A for A > 0 and p(A|I) =<br />
0 for A 0. This produces a modified `<br />
2 ' function (see<br />
Fig. 1) that effectively excludes the impact of impurity<br />
peaks.<br />
The results discussed in briefly in this contribution and<br />
more extensively in [1] show that the improvement over<br />
conventional least-squares analysis is dramatic. Indeed,<br />
even in the presence of very substantial impurity<br />
contributions (see Fig. 4) the refined structural parameters<br />
are within a standard deviation of their correct values.<br />
It must, however, be stated as a final caveat that care<br />
should be taken with this approach and the use of an<br />
algorithm that can cope with the presence of impurities<br />
should be seen as a last resort. Indeed, every effort should<br />
be made to determine all the phases in a sample. It is much<br />
more desirable to include the impurity phase in a standard<br />
<strong>Rietveld</strong> refinement.<br />
REFERENCES<br />
[1] David, W. I. F. (2001). J. Appl. Cryst. 34 691-698.<br />
[2] David, W. I. F. & Sivia, D. S. (2001). J. Appl. Cryst.<br />
34, 318-324.<br />
Fig 3. Observed and calculated diffraction patterns for the<br />
composition 5% yttria : 95% rutile: (a) robust analysis<br />
showing the full observed data range (the grey scale<br />
described in the text not used in this figure); (b)<br />
expanded region highlighting the successful robust<br />
refinement (the down-weighting grey scale is used in<br />
this figure); (c) the least-squares analysis showing the<br />
poor agreement between the observed and calculated<br />
patterns.
<strong>Rietveld</strong> refinements with JANA2000<br />
M. Dusek 1 , V. Petricek 1 , M. Wunschel 2 , R. Dinnebier 3 and<br />
Sander van Smaalen 2<br />
1 Institute of Physics, Academy of Sciences of the Czech<br />
Republic, Praha, Czech Republic,<br />
2 Laboratory of Crystallography, University of Bayreuth,<br />
Universitätsstrasse 30, D-95440 Bayreuth, Germany,<br />
3 <strong>Max</strong> <strong>Planck</strong> Institute for Solid State Research,<br />
Heisenbergstrasse 1, D-70569 Stuttgart, Germany.<br />
E-mail: smash@uni-bayreuth.de<br />
The system of computer programs JANA2000 is designed<br />
for the refinement and analysis of incommensurately<br />
modulated structures and composite crystals as well as<br />
periodic crystals. It incorporates many different<br />
possibilities to use restrictions on the parameters, like the<br />
use of non-crystallographic site symmetry and the direct<br />
refinement of temperature factors in the TLS formalism.<br />
Here we describe the powder module of JANA2000, that<br />
allows <strong>Rietveld</strong> refinements and the LeBail fits of powder<br />
diffraction data with the full functionality of the JANA2000<br />
system, including <strong>Rietveld</strong> refinement of incommensurate<br />
structures.<br />
INTRODUCTION<br />
<strong>Rietveld</strong> refinement of crystal structures against powder<br />
diffraction data has become a standard technique for the<br />
structural analysis of compounds with small unit cells.<br />
Synchrotron radiation is responsible for a very small<br />
instrumental line width. The increased resolution has<br />
pushed the limits of powder diffraction towards the<br />
analysis of more complex compounds. The much better<br />
signal to noise ratio of diffractometers based on<br />
synchrotron radiation has allowed the study of weak<br />
superlattice effects. Concomitantly, the past decade has<br />
seen the development of profile functions, that accurately<br />
describe the peculiar shapes of these high-resolution<br />
reflections. These developments are available in several<br />
extensive software packages like GSAS [1].<br />
Incommensurately modulated structures and<br />
incommensurate composite crystals have been studied by<br />
quantitative single-crystal x-ray diffraction for the past 25<br />
years [2]. The description of their structures and<br />
symmetries requires the superspace theory [3]. Presently,<br />
the system of computer programs JANA2000 provides the<br />
most extensive set of tools for the analysis of<br />
incommensurate structures [4]. JANA2000 has several<br />
unique features, including a great flexibility in the choice<br />
of the types of modulation functions. Many options in<br />
JANA2000 are useful for the analysis of periodic crystals<br />
too. Examples are the possibility to refine the temperature<br />
parameters in terms of rigid-body motions (TLS<br />
formalism), anharmonic temperature parameters and their<br />
modulations [5], and the possibility to apply restrictions<br />
according to non-crystallographic symmetries of molecules<br />
[6].<br />
A powder module was introduced into JANA2000, in order<br />
to make all its features available for <strong>Rietveld</strong> refinement<br />
[4]. In this contribution we give a short introduction to<br />
incommensurate structures and we discus the specific<br />
problems that arise for the analysis of powder diffraction<br />
of aperiodic crystal structures. In the second part the<br />
importance is shown of the use of restrictions according to<br />
non-crystallographic symmetries.<br />
INCOMMENSURATE CRYSTALS<br />
Incommensurately modulated crystals lack 3-dimensional<br />
translation symmetry [2]. Yet their structures have perfect<br />
long-range order, as it is reflected by a diffraction pattern<br />
consisting of sharp Bragg reflections. All Bragg reflections<br />
can be indexed with four or more integers according to<br />
1<br />
H = ha*<br />
+ k b*<br />
+ l c*<br />
+ m q + L+<br />
{ *, b*,<br />
c*}<br />
1<br />
m d<br />
a form the reciprocal lattice of the basic or<br />
j<br />
average structure. The modulation wave vectors q are<br />
given as a linear combination of the 3 basis vectors of<br />
reciprocal lattice of the average structure:<br />
q<br />
j<br />
= σ<br />
j1a* + σ<br />
j2b*<br />
+ σ<br />
j3c*<br />
d is the dimension of the modulation; usually it is restricted<br />
to 1 or 2.<br />
The main reflections (h, k, l, 0) form a reciprocal lattice. If<br />
satellites (h, k, l, m) of all orders |m| would be present, then<br />
they would lie dense on a line through reciprocal space.<br />
For the powder diffraction this implies, that there would be<br />
a dense set of reflections along the 2θ axis. Obviously, a<br />
full profile analysis with an infinite number of reflections<br />
is not possible. In real structures non-zero intensities are<br />
only observed up to a maximum order of the satellite<br />
index, usually up to |m| = 2. For applications of the<br />
<strong>Rietveld</strong> method to modulated structures it is thus required<br />
to restrict the maximum possible m-index to some value<br />
|m| max . This option has been included into the <strong>Rietveld</strong><br />
module of JANA2000.<br />
Figure 1 shows a screenshot of JANA2000 displaying the<br />
result of a <strong>Rietveld</strong> refinement of the incommensurately<br />
modulated structure of NbTe 4 . The graphical user interface<br />
is visible, and the figure shows that JANA2000 offers many<br />
possibilities to vary and analyze the plot. With |m| max = 2<br />
the reflections within this region of 2θ are all isolated. In<br />
Figure 2 the regions around 2θ = 31 deg. and around<br />
2θ = 42 deg. are displayed. They show the good fit to the<br />
measured data, including relatively large intensities for<br />
some first-order satellites.<br />
Fig. 1 Screenshot of JANA2000 displaying the <strong>Rietveld</strong> plot of the<br />
incommensurately modulated structure of NbTe 4 . With the<br />
"Plot <strong>Powder</strong> Profile" module the <strong>Rietveld</strong> plot or the result<br />
of the LeBail fit can be displayed in a great variety of ways.<br />
Information about the refinements and resulting parameters<br />
is available as a printable file.<br />
q<br />
d
Fig. 3 The structure of C 60 molecule in CO X C 60 after refinement<br />
with (left:) rigid bodies in gsas, and (right:) icosahedral site<br />
symmetry in JANA2000. Thermal ellipsoids are shown.<br />
Fig. 2 .Two excerpts of the <strong>Rietveld</strong> plot of NbTe 4 . Satellite<br />
reflections up to order |m| max = 2 are shown.<br />
Indeed, the <strong>Rietveld</strong> refinement resulted in basic structure<br />
parameters and modulation parameters that were equal to<br />
but less accurate than those obtained <strong>from</strong> the singlecrystal<br />
refinement [4,7]. Composite crystals or<br />
incommensurate intergrowth compounds can be considered<br />
as the intergrowth of two incommensurately modulated<br />
structures. In the simplest example the first subsystem has<br />
main reflections (h, k, l, 0) while the second subsystem has<br />
main reflections (h, k, 0, m). The main reflections<br />
(h, k, 0, 0) are common to the two subsystems, while the<br />
remaining main reflections of one subsystem are satellites<br />
of the other subsystem. Reflections (h, k, l, m) with both l<br />
and m non zero are satellites of both subsystems. In order<br />
to describe all reflections with non-zero intensities, it is<br />
now necessary to restrict the minimum value of the pair<br />
(|l|, |m|) to some maximum value m max . This option has<br />
been included into the powder module, and it is thus<br />
possible to perform <strong>Rietveld</strong> refinements of composite<br />
crystals with JANA2000.<br />
NON-CRYSTALLOGRAPHIC SITE SYMMETRY<br />
Because modulated structures are described as the sum of a<br />
basic structure with 3D translation symmetry and<br />
modulation functions, any computer program for<br />
modulated structures can also handle ordinary 3D periodic<br />
structures. In addition JANA2000 can treat many special<br />
structural features, like anharmonic temperature factors,<br />
the TLS formalism, rigid-bodies, and the noncrystallographic<br />
site symmetries. The crystal structure of<br />
CO X C 60 has been solved by synchrotron radiation x-ray<br />
powder diffraction at T = 25 K [8]. The C 60 molecules<br />
form a cubic closed packed crystal with the CO molecules<br />
on the octahedral sites (space group Pa 3 ). <strong>Rietveld</strong><br />
refinements using all 10 crystallographically independent<br />
atoms of the C 60 molecule are not possible, because of the<br />
high correlations between these parameters. In the previous<br />
study <strong>Rietveld</strong> refinements were performed using a rigid<br />
body for the C 60 molecule. Although anisotropic<br />
temperature parameters were used for this rigid body, the<br />
refinement led to an almost isotropic temperature tensor<br />
(Fig. 3a). The reason is, that this tensor can only describe<br />
displacements of the rigid body, and the latter are expected<br />
to be equal in all directions. Alternatively, the C 60<br />
molecule can be described as a molecule with icosahedral<br />
symmetry. Then there is only one independent atom.<br />
<strong>Refinement</strong> of its coordinates allows for the variation of<br />
the size of the molecule and the ratio of the long and short<br />
bonds. This refinement with JANA2000 lead to virtually the<br />
same geometry of the molecule as the rigid body.<br />
However, the temperature parameters were now a single<br />
temperature tensor for the independent atom. The<br />
icosahedral symmetry transplants this tensor towards all<br />
other 59 atoms, whereby the directions of the principal<br />
axes are transformed according to the point symmetry. As<br />
it follows <strong>from</strong> the refinement this description leads to an<br />
anisotropic temperature movement, that clearly reflects<br />
librations of the molecules that are larger than their<br />
translations, in accordance with the expectations (Fig. 3b).<br />
The consequence of this improved description of the<br />
electron density was a significant change in the position of<br />
the CO molecule, and a significant change in occupancy of<br />
this site <strong>from</strong> x = 0.67 to x = 0.85 in the new refinement.<br />
CONCLUSIONS<br />
The system of computer programs JANA2000 can be used<br />
for the LeBail fit of powder diffraction data as well as for<br />
<strong>Rietveld</strong> refinements. JANA2000 incorporates parameters<br />
for the description of modulated and composite crystals<br />
and for atypical structural features of ordinary crystals, like<br />
anharmonic temperature tensors and non-crystallographic<br />
site symmetries. All these options are available for the<br />
<strong>Rietveld</strong> refinement.<br />
Financial support was obtained <strong>from</strong> the German Science<br />
Foundation (DFG), the FCI, and the Grant Agency of the<br />
Czech Republic (grant 202/00/0645).}<br />
REFERENCES<br />
[1] Larson, A. C. & Von Dreele, R. B. (1995). GSAS --<br />
General Structure Analysis System.} Los Alamos<br />
National Laboratory Report LAUR 86-748.<br />
[2] Van Smaalen, S. (1995). Cryst. Rev. 4, 79-202.<br />
[3] De Wolff, P. M., Janssen, T. & Janner, A. (1981). Acta<br />
Cryst. A37, 625.<br />
[4] Dusek, M., Petricek, V., Wunschel, M., Dinnebier, R.<br />
E. & van Smaalen, S. (2001). J. Appl. Cryst. 34, 398.<br />
[5] Pfitzner, A., Evain, M. & Petricek, V. (1997). Acta<br />
Cryst. B53, 337.<br />
[6] Van Smaalen, S., Petricek, V., De Boer, J. L., Dusek,<br />
M., Verheijen, M. A. & Meijer, G. (1994). Chem. Phys.<br />
Lett. 223, 323.<br />
[7] Van Smaalen, S., Bronsema, K. D. & Mahy, J. (1986).<br />
Acta Cryst. B42, 43.<br />
[8] Van Smaalen, S., Dinnebier, R. E., Holleman, I., Von<br />
Helden, G. \& Meijer, G. (1998). Phys. Rev. B57,<br />
6321.
No<br />
Internet access? No<br />
OCTOBER 2001 EDITION<br />
OUT NOW!<br />
problem<br />
If you’re working in the<br />
developing world and<br />
have limited or no access<br />
to the Internet, then the<br />
Xtal Nexus CD-ROM is<br />
here to help.<br />
Packed with a host of crystallographic<br />
software packages and resources, these<br />
virtual Internet CD-ROMs have been produced<br />
with the permission of software and website custodians. The organizer of the Nexus project, the<br />
IUCr Committee on Electronic Publishing, Dissemination and Storage of Information, invites<br />
academics and students in crystallography working in laboratories in developing countries that are<br />
isolated <strong>from</strong> the Internet to register their interest. The CD-ROMs are free of charge and available<br />
while stocks last.<br />
The CD-ROM is sponsored by the IUCr and the Collaborative Computational Project No. 14<br />
(CCP14) for Single Crystal and <strong>Powder</strong> <strong>Diffraction</strong>.<br />
Contents<br />
Multiple software packages and suites relevant to single-crystal, powder diffraction,<br />
crystallographic structure validation and crystallographic teaching, including<br />
• single-crystal structure solution and refinement suites for PC<br />
• crystallographic structure visualization programs<br />
• powder diffraction pattern visualization, peak profiling and indexing software<br />
• powder diffraction structure solution<br />
• classic and modern crystallographic program source code<br />
• <strong>Rietveld</strong> refinement packages<br />
• structure validation and checking software<br />
• powder pattern simulation and journal-quality structure plotting and photorealistic<br />
rendering programs<br />
• educational websites dealing with crystallographic teaching<br />
• webpage-based tutorials on how to use many of the programs within the CD-ROM<br />
• part of the IUCr website including IUCr Commissions.<br />
Send your request for a free<br />
Xtal Nexus CD-ROM (preferably via<br />
e-mail or by conventional mail) to<br />
Lachlan M. D. Cranswick<br />
CCP14 – School of Crystallography,<br />
Birkbeck College, Malet Street,<br />
Bloomsbury, London WC1E 7HX, UK<br />
E-mail: l.m.d.cranswick@dl.ac.uk<br />
Tel: +44 20 7631 6849<br />
Fax: +44 20 7631 6803<br />
WWW: www.ccp14.ac.uk<br />
The CD-ROMs, and regular updates,<br />
will be sent by airmail.
Computer Corner<br />
Updates on Freely Available Crystallographic and <strong>Powder</strong><br />
<strong>Diffraction</strong> Software<br />
(Suggestions, corrections, comments appreciated;<br />
especially if you know of new program features, program<br />
updates and announcements that should be mentioned<br />
here).<br />
outputs files in a suitable format (the latest WinMprof<br />
<strong>Rietveld</strong> outputs GFOUR input and reflection files).<br />
GFOUR also includes the ability to define the format of<br />
the reflection file via a Graphical User Interface (GUI)<br />
anduses flexible, free format input files which will<br />
pleasantly surprise people used to programs such as the<br />
1960’s/1970’s/1980’s/1990’s vintage Fordap input files of<br />
ones and zeros.<br />
Lachlan M. D. Cranswick<br />
Collaborative Computational Project No 14 (CCP14) for<br />
Single Crystal and <strong>Powder</strong> <strong>Diffraction</strong><br />
CCP14 - School of Crystallography,<br />
Birkbeck College,<br />
Malet Street, Bloomsbury,<br />
WC1E 7HX, London, UK<br />
Tel: (+44) 020 7631 6849<br />
Fax: (+44) 020 7631 6803<br />
E-mail: l.m.d.cranswick@dl.ac.uk<br />
WWW: http://www.ccp14.ac.uk - http://ccp14.sims.nrc.ca<br />
- http://ccp14.semo.edu<br />
CCP14 US and Canadian full Software mirrors<br />
Thanks to Ronald Rogge and Ian Swainson of the NRC,<br />
Chalk River, Ontaria, Canada and Marcus Bond of<br />
Southeast Missouri State University, USA, the CCP14<br />
(Collaborative Computational Project No 14 for Single<br />
Crystal and <strong>Powder</strong> <strong>Diffraction</strong>) now has full mirrors of<br />
the main UK website in Canada and the USA.<br />
UK: http://www.ccp14.ac.uk/<br />
US: http://ccp14.semo.edu/<br />
CA: http://ccp14.sims.nrc.ca/<br />
If you find the links to the following (and other) mentioned<br />
software are slow or unavailable <strong>from</strong> their original web or<br />
FTP sites, go to the CCP14 mirrors / “download software”<br />
page, do a “text find” on the name of the software you are<br />
seeking and go to what looks likes the fastest local mirror<br />
<strong>from</strong> your region of the world.<br />
CCP14 main “Mirror” / “Download Programs” pages:<br />
UK: http://www.ccp14.ac.uk /mirror/<br />
US: http://ccp14.semo.edu /mirror/<br />
CA: http://ccp14.sims.nrc.ca /mirror/<br />
Another alternative is use the “CCP14 search” page; or a<br />
Google search (http://www.google.com). Though if any<br />
doubt, or if you feel slightly lost or confused about how to<br />
start, feel free to contact the CCP14 via E-mail at<br />
ccp14@dl.ac.uk.<br />
Fig 1: a) example of the GFOUR menu system and b)<br />
example of the “File, New” menu option including the<br />
ability to define the format of the reflection file via the<br />
GFOUR Graphical User Interface (GUI)<br />
GFOUR for Windows Fourier Map Software by Javier<br />
Gonzalez-Platas and Juan Rodriguez-Carvajal<br />
The latest GFOUR Fourier Map generation, peak find and<br />
contour map display software (updated 25 th September<br />
2001) is now available at<br />
ftp://charybde.saclay.cea.fr/pub/divers/fullprof.2k/Window<br />
s/ and CCP14 mirrors. This includes new additions and<br />
features to the Graphical User Interface (GUI) such as the<br />
ability to animate through the Fourier contour map.<br />
While GFOUR interlinks with the Fullprof <strong>Rietveld</strong><br />
software; it can be used by any <strong>Rietveld</strong> program that<br />
Fig 2: GFOUR displaying a Fourier map; including the<br />
automatic labelling of atoms near the plane being<br />
displayed.
Computational Crystallography Toolbox (CCTBX) by<br />
the Computational Crystallography Initiative (CCI)<br />
The CCTBX is an Open Source project for those interested<br />
in crystallographic software development. Organized as a<br />
set of ANSI C++ classes with Python bindings, it presently<br />
has a unit cell toolbox (uctbx), a space group toolbox<br />
(sgtbx) and an element toolbox (eltbx) for the handling of<br />
scattering factors and other element properties. The<br />
CCTBX can be downloaded at its homesite at:<br />
http://cctbx.sourceforge.net/ or CCP14 mirrors.<br />
Fig 3: Example GFOUR input file viewed via the freeware<br />
PFE (Programmer’s File Editor) for Windows<br />
(http://www.lancs.ac.uk/people/cpaap/pfe/).<br />
Ross Angel Equation of State software (EOSFIT, P-V<br />
Calculator) software<br />
Software for Equation of State analysis by Ross Angel at<br />
Virginia Tech is now available on the web at<br />
http://vtso.geol.vt.edu/rja/soft/. EosFit5.2 for DOS (it also<br />
runs under a DOS box in MS-Windows) handles Pressure-<br />
Volume-Temperature data; Pressure-Volume data; and fits<br />
Murnaghan, Birch-Murnaghan, natural strain and Vinet<br />
equations of state. The P-V Calculator version 6 for<br />
Windows performs Pressure-Volume calculations, and<br />
provides f, F, and K and K' at pressure. This software can<br />
be useful during these types of experiments during<br />
diffraction beamtime at synchrotron facilities.<br />
Fig 5: CCTBX web interface for determining spacegroups<br />
<strong>from</strong> symmetry operators and visa-versa at:<br />
http://cci.lbl.gov/servers/cctbx/explore_symmetry.html.<br />
It can also handle Shelx style input for discovering the<br />
spacegroup <strong>from</strong> symmetry operators. Refer "Algorithms<br />
for deriving crystallographic space-group information", R.<br />
W. Grosse-Kunstleve Acta Cryst. 1999, A55:383-395<br />
ObjCryst++ “open source” crystallographic source<br />
code library and FOX “real space” structure solution<br />
software byVincent Favre-Nicolin<br />
A new resource for crystallography and powder diffraction<br />
software development is Vincent Favre-Nicolin’s<br />
ObjCryst++ crystallographic source code library whose<br />
homesite is at http://objcryst.sourceforge.net/ (with mirrors<br />
at the CCP14). The library presently concentrates on<br />
source code for the global optimisation of crystal structures<br />
<strong>from</strong> diffraction data. This has been released under the<br />
“The Artistic License” (described at:<br />
http://www.gnu.org/philosophy/licenselist.html#ArtisticLicense).<br />
Fig 4: Screen images of P-V (Pressure, Volume)<br />
Calculator 6.0 for Windows by Ross Angel<br />
A further development <strong>from</strong> ObjCryst++ is FOX (Free<br />
Objects for Xtallography) for Linux, MS-Windows and<br />
source code. FOX can be used both for educational<br />
purposes as well as to solve crystal structures <strong>from</strong> powder<br />
diffraction data using global optimisation methods. Objects<br />
or components of a crystal structure can be described as a)
atoms, b) organic molecules using a Z-Matrix description,<br />
c) or inorganic polyhedra.<br />
Of the many notable FOX attributes, one is the ability to<br />
overpopulate your cell with atoms or polyhedral objects<br />
combined with a “Dynamical Occupancy Correction”.<br />
Thus during global optimisation, FOX can merge atoms on<br />
shared and special positions using “Dynamical Occupancy<br />
Correction”. These features make FOX attractive for<br />
solving inorganic structures where it is not known (or not<br />
possible to guess) which atoms are on general or special<br />
positions; and/or you are not sure of the connectivity<br />
between different polyhedral objects. A step-by-step<br />
HOWTO web tutorial on using FOX to solve structures is<br />
viewable at<br />
http://objcryst.sourceforge.net/Fox/quickstart.html<br />
and CCP14 mirrors.<br />
Balls and Sticks for Windows by Sung J. Kang &<br />
Tadashi C. Ozawa<br />
A newly announced program for the visualisation and<br />
animation of crystal structures including polyhedral<br />
structures and a mixture of polyhedral and ball and stick<br />
structures (with the emphasis on “ease of use”) is the<br />
“Balls and Sticks” software by Sung J. Kang and Tadashi<br />
C. Ozawa. Its website is viewable via<br />
http://www.toycrate.org/. “Balls and Sticks” will import<br />
CIF files, then polyhedra and bonds can be defined using<br />
point and click on the mouse. All options are implemented<br />
via the Graphical User Interface (GUI)<br />
Because FOX is supplied with source code as part of it<br />
being an “open source” project, it is possible for users to<br />
build on the existing algorithms in FOX and expand its<br />
functionality and optimisation criteria.<br />
Fig 7: “Balls and Sticks” interface where new polyhedra<br />
are defined by pointing and clicking on the vertices atoms<br />
([CONTROL] button is used to select multiple atoms).<br />
Ball atom display can be resized individually or en-masse<br />
by right clicking in the Atoms dialog and selecting<br />
properties.<br />
Fig 6: Screen image of FOX solving an inorganic<br />
structure (Lead Sulphate) by simultaneous fitting to<br />
Neutron and X_ray diffraction data. The data and<br />
structure are being simultaneously displayed and updated<br />
in real time during the structure solution process. In the<br />
crystal structure display (top right), you can visually see<br />
the “Dynamical Occupancy Correction” combining atoms<br />
and sulphate groups (defined as tetrahedra) at the special<br />
positions.<br />
Freely available polyhedral structure viewing software<br />
There are many programs are available for generating<br />
ORTEP structure diagrams and ball and stick structure<br />
drawing suitable for chemical crystallography. However,<br />
as freely available polyhedral structure drawing software is<br />
not so obvious to find, following is a list of software. It<br />
should be noted that commercial programs exist with this<br />
functionality; including Atoms for Windows<br />
(http://www.shapesoftware.com), Carine for Mac and<br />
Windows (http://www.esm-software.com/carine/)<br />
CrystalMaker for Mac (http://www.crystalmaker.com/) and<br />
Diamond for Windows<br />
(http://www.crystalimpact.com/diamond/).<br />
Fig 8: Static screen capture of crystal structure GIF<br />
animations generated by Balls and Sticks as viewable on<br />
the Balls and Sticks website via http://www.toycrate.org/.
DrawXTL for Windows, Mac, UNIX and C source code<br />
by Larry Finger and Martin Kroeker<br />
DrawXTL version 3 is downloadable off the web at<br />
http://www.lwfinger.net/drawxtl/ and CCP14 mirrors. It<br />
will render ball and stick structures; ORTEPs, and<br />
structures in polyhedra of any desired shape. Besides its<br />
own native format, DrawXTL can read CIF, CSD, GSAS,<br />
SCHAKAL, and SHELX formats. Structures can be<br />
rendered in VRML1, and structure animations created in<br />
VRML 2 format (requiring a VRML2 viewer to see the<br />
animations)<br />
traditional HPGL and Postscript (via the PSPLOT program<br />
included with the distribution). Traditional Struplo91<br />
ASCII files are used for input.<br />
GUI WinStruplo by Louis Farrugia<br />
GUI WinStruplo is a port of Armel Le Bails Struvir code<br />
implemented by Louis Farrugia. Louis has added a<br />
graphical user interface with point and click operation, and<br />
the ability to import a large variety of file formats. File<br />
formats include CIF, Shelx, GSAS, Fullprof and GSAS<br />
and it is available via Louis Farrugia’s site at Glasgow<br />
University, http://www.chem.gla.ac.uk/~louis/software/.<br />
Fig 9: Drawxtl Shell for Windows on the left overlaid with<br />
VRML structure displayed in the interactive COSMO<br />
VRML viewer (installed as a “plugin” within Netscape).<br />
Struvir by Armel Le Bail<br />
Struvir is an Armel Le Bail port of the original Reinhard<br />
Fischer’s Struplo code (R.X. Fischer, J. Appl. Cryst. 18<br />
(1985) 258-262). The software modification history is<br />
somewhat more complicated, involving modifications or<br />
documentation by: A. Le Lirzin, D. Kassner, Tim<br />
McCarthy, Donald L. Ward, Donald L. Ward, W. H. Baur<br />
and Mark Koennecke. Structures can be outputted in<br />
VRML format (Virtual Reality Modelling Language),<br />
Povray files (http://www.povray.org), as well as the<br />
Fig 11: a) GUI WinSTRUPLO importing a structure ready<br />
for output to supported formats such as HPGL, Postscript,<br />
VRML or Povray (freeware photorealistical rendering<br />
software – http://www.povray.org). b) Structure rendered<br />
by Porvay.<br />
Glassvir by Armel Le Bail for polyhedral viewing of glass<br />
models generated by RMC (Reverse Monte Carlo)<br />
Glassvir by Armel Le Bail is available at http://sdpd.univlemans.fr/glasses/glassvir.html<br />
and is designed for the<br />
generation of interactive wire-frame and polyhedral<br />
VRML views of glasses modelled by RMC; with the input<br />
being that of the RMC config file (.cfg). Some available<br />
RMC (Reverse Monte Carlo) modelling software includes<br />
that of Robert McGreevy’s; described at<br />
http://www.studsvik.uu.se/software/rmc/rmc.htm<br />
and downloadable via<br />
ftp://www.studsvik.uu.se/pub/rmc_mcgr/.<br />
Fig 10: VRML Structure generated by Struvir and<br />
displayed in the interactive COSMO VRML viewer<br />
(installed as a “plugin” within Netscape).
Xtal-3d by Marcus Hewat (also part of Alan Hewat’s<br />
ICSD for WWW)<br />
Xtal3D by Marcus Hewat is available at<br />
http://barns.ill.fr/dif/icsd/xtal-3d.html and will render the<br />
structure into the interactive VRML (Virtual Reality<br />
Modelling Language). It can be used as a standalone<br />
command line or GUI based program; as well as via a web<br />
interface. Xtal3D is also included with Alan Hewat’s<br />
“ICSD for Web” which has its master website at<br />
http://barns.ill.fr/dif/icsd/.<br />
Fig 12: a) Glassvir generated “wireframe” structure of a<br />
RMC modelled glass in VRML format as viewed<br />
interactively in the COSMO VRML viewer (in this case<br />
installed as a Netscape plugin) and b) polyhedral view of<br />
an RMC modelled glass in VRML format.<br />
Xtaldraw (Shareware) by Kurt L. Bartelmehs and Bob<br />
Downs<br />
The Xtaldraw shareware software has its webpage at<br />
http://www.infotech.ns.utexas.edu/crystal/ and CCP14<br />
mirrors. Crystal structure information is entered into a free<br />
format ASCII control file followed by running Xtaldraw.<br />
Keyboard and mouse control can then be used to generate<br />
the required view for rendering as a GIF file. Spheres,<br />
ellipsoids, bonds and polyhedra can be rendered by<br />
Xtaldraw.<br />
Fig 14: A polyhedral view of rutile as rendered into VRML<br />
by Xtal3D within the ICSD for WWW database.<br />
Updated Gretep (Grenoble Thermal Ellipsoids Plot<br />
Program) by Jean Laugier and Bernard Bochu<br />
The latest version of Gretep for ball and stick structure<br />
plotting allows for i) creating Metal-Ring bonds ii) bond<br />
labels horizontal or oblique to the bond and iii) custom<br />
bond colours. While using these features are quite<br />
elementary via the Gretep Graphical User Interface (GUI),<br />
there are also web tutorials via the Gretep website at<br />
http://www.ccp14.ac.uk/tutorial/lmgp/#gretep and can be<br />
downloaded at:<br />
http://www.ccp14.ac.uk/ccp/web-mirrors/lmgp-laugierbochu/.<br />
Fig 13: Silicate as rendered by XtalDraw.<br />
Fig 15: Gretep screen image showing Metal-atom bonds;<br />
bond labels and custom bond colours (not evident in a<br />
black and white newsletter).
Crysfire by Robin Shirley and Chekcell by Jean<br />
Laugier and Bernard Bochu powder indexing software<br />
updates<br />
It can be useful to regularly check for software updates,<br />
bug fixes and new features; Crysfire and Chekcell being no<br />
exceptions. Both the Crysfire powder indexing suite and<br />
Chekcell have had miscellaneous bug fix updates since the<br />
time of the last CPD newsletter. The Crysfire webpage is<br />
at http://www.ccp14.ac.uk/tutorial/crys/ and with the<br />
Chekcell homepage at<br />
http://www.ccp14.ac.uk/tutorial/lmgp/#chekcell.<br />
Updates in the “EFLECH” automatic fundamental<br />
parameters peak hunting and profile fitting program<br />
and “Index” powder indexing software by Jörg<br />
Bergmann<br />
Eflech and Index have undergone miscellaneous<br />
improvements and are available at<br />
http://www.bgmn.de/related.html and CCP14 mirrors.<br />
Traditionally, Eflech will automatically hunt for peaks in a<br />
powder diffraction pattern using the fundamental<br />
parameters peak profiling model to generate a peak listing<br />
with a covariance matrix. As using “fundamental<br />
parameters” fitting is almost akin to running the sample on<br />
an “ideal” diffractometer, properly modelled peak<br />
positions can be of very high accuracy. The “Index”<br />
program will then attempt to index the Eflech determined<br />
powder peaks while making use of the covariance matrix<br />
also generated by Eflech. Recent improvements include<br />
fixing a bug for the triclinic search algorithm; changing<br />
some internal searching algorithm constants; and a new<br />
feature which will output a variety of trial cells (in cases<br />
where the information is not sufficient for a lone<br />
unambiguous solution). The latest EFLECH/Index<br />
combination is also distributed for Linux (compiled on<br />
SuSE Linux 7.2), as well as the traditional DOS, Windows<br />
and OS/2 binaries.<br />
<strong>Rietveld</strong> Software Updates (as of late October 2001):<br />
Hugo <strong>Rietveld</strong> website:<br />
http://home.wxs.nl/~rietv025/<br />
BGMN (15 th September 2001)<br />
http://www.bgmn.de/<br />
DBWS (22 nd February 2000)<br />
http://www.physics.gatech.edu/downloads/young/<br />
download_dbws.html<br />
Debvin (25 th May 2001)<br />
ftp://ftp.cc.uniud.it/DEBVIN/<br />
GSAS (25 th October 2001)<br />
ftp://ftp.lanl.gov/public/gsas/<br />
Jana (31 st May 2001) (Email authors for latest Beta test<br />
versions)<br />
http://www-xray.fzu.cz/jana/jana.html<br />
LHPM-Rietica (7 th December 2000)<br />
ftp://ftp.ansto.gov.au/pub/physics/neutron/rietveld<br />
/Rietica_LHPM95/<br />
MAUD for Java (GPL’d) (2 nd August 2001)<br />
http://www.ing.unitn.it/~luttero/maud/<br />
Prodd (3 rd April 2001)<br />
http://www.ccp14.ac.uk/ccp/webmirrors/prodd/~jpw22/<br />
Profil (24 th May 2001)<br />
ftp://img.cryst.bbk.ac.uk/pdpl/<br />
Rietan 2000 (GPL’d) (6 th September 2001)<br />
http://www.ccp14.ac.uk/ccp/webmirrors/prodd/~jpw22/<br />
Winplotr/Fullprof (27 th August 2001)<br />
http://www-llb.cea.fr/winplotr/winplotr.htm<br />
ftp://bali.saclay.cea.fr/pub/divers/fullprof.2k/<br />
Winmprof (21 st June 2001)<br />
http://lpec.univ-lemans.fr/WinMProf/<br />
XND (6 th July 2001)<br />
http://www-cristallo.polycnrs-gre.fr/xnd/xnd.html<br />
ftp://old-labs.polycnrs-gre.fr/pub/xnd/<br />
All the above <strong>Rietveld</strong> programs are also available via the<br />
CCP14 based mirrors in UK, USA and Canada<br />
(http://www.ccp14.ac.uk/mirror/).<br />
Summary lists of some software available via the<br />
EPSRC funded CCP14 website:<br />
Anharmonic Thermal <strong>Refinement</strong> Software<br />
http://www.ccp14.ac.uk/solution/anharmonic/<br />
<strong>Data</strong> Conversion for <strong>Powder</strong> <strong>Diffraction</strong><br />
http://www.ccp14.ac.uk/solution/powderdataconv/<br />
Image Plate Software<br />
http://www.ccp14.ac.uk/solution/image-plate/<br />
Incommensurate Structure Software<br />
http://www.ccp14.ac.uk/solution/incomm.htm<br />
Indexing Software for <strong>Powder</strong>s<br />
http://www.ccp14.ac.uk/solution/indexing/<br />
LeBail Method for Intensity Extraction<br />
http://www.ccp14.ac.uk/solution/lebail/<br />
Pawley Method for Intensity Extraction<br />
http://www.ccp14.ac.uk/solution/pawley/<br />
PDF, High Q <strong>Powder</strong> diffraction Analysis Software<br />
http://www.ccp14.ac.uk/solution/high_q_pdf/<br />
Peak Find/Profiling Software for <strong>Powder</strong> <strong>Diffraction</strong><br />
http://www.ccp14.ac.uk/solution/peakprofiling/<br />
Pole Figure and Texture Analysis Software<br />
http://www.ccp14.ac.uk/solution/pole_figure/<br />
<strong>Powder</strong> <strong>Diffraction</strong> <strong>Data</strong> Visualisation<br />
http://www.ccp14.ac.uk/solution/powder_data_visual/<br />
Search-Match Phase Identification Software<br />
http://www.ccp14.ac.uk/solution/search-match.htm<br />
Single Crystal Structure Solution Software relevant to Chemical<br />
Crystallography<br />
http://www.ccp14.ac.uk/solution/xtalsolution/<br />
Single Crystal Structure <strong>Refinement</strong> Software relevant to<br />
Chemical Crystallography<br />
http://www.ccp14.ac.uk/solution/xtalrefine/<br />
Single Crystal Suites linking to multiple programs relevant to<br />
Chemical Crystallography<br />
http://www.ccp14.ac.uk/solution/xtalsuites/<br />
Spacegroup and Symmetry operator determination software and<br />
source code<br />
http://www.ccp14.ac.uk/recomm/sym_operators_to_spa<br />
cegroups.html<br />
http://www.ccp14.ac.uk/recomm/spacegroups_to_sym_<br />
operators.html<br />
Spacegroup and Structure Transformation Software<br />
http://www.ccp14.ac.uk/solution/transform/<br />
Structure Conversion and Transformation<br />
http://www.ccp14.ac.uk/solution/structconv/<br />
Structure Drawing and Visualisation<br />
http://www.ccp14.ac.uk/solution/structuredrawing/<br />
Unit Cell <strong>Refinement</strong> of <strong>Powder</strong> <strong>Diffraction</strong> <strong>Data</strong><br />
http://www.ccp14.ac.uk/solution/unitcellrefine/
3 rd Size-Strain Conference,<br />
Trento (Italy), 2-5.12.2001<br />
MEETING AND SCHOOL REPORTS<br />
2 0 0 1<br />
Paolo Scardi<br />
Dipartimento di Ingegneria dei Materiali<br />
Università di Trento<br />
via Mesiano 77, Trento, ITALY<br />
Tel: +39 0461 882417/67<br />
Fax: +39 0461 881977<br />
e-mail: Paolo.Scardi@ing.unitn.it<br />
Web-site: http://www.ing.unitn.it/~scardi/<br />
The third Size-Strain conference (SS-III) “Analysis of<br />
microstructure and residual stress by diffraction methods”<br />
was is intended as a continuation of the successful series of<br />
Size-Strain conferences initiated in 1995 (Liptovsky<br />
Mikulas, Slovakia) and continued in 1998 (Freiberg,<br />
Germany). The conference was organised under the<br />
supervision of a Technical Programme Committee (R.<br />
Cheary, J. Cline, R. Delhez, P. Klimanek, D. Louer, E.<br />
Mittemeijer, P. Scardi, B. Scholtes, V. Valvoda) and an<br />
International Advisory Board (C. Hubbard, A. Kern, E.<br />
Mittemeijer, P: Munk, P. Scardi, R. Snyder). The Local<br />
Committee (chaired by M. Leoni) provided an<br />
indispensable support to the many practical and logistic<br />
issues.<br />
This event was made possible by the generous financial<br />
support of the European Commission (the conference was<br />
also included in the list of High-level Scientific<br />
Conferences) and the Regione Autonoma Trentino Alto<br />
Adige-Südtirol. Further important sponsorships by the<br />
International Union of Crystallography, Philips Analytical,<br />
Bruker, ICDD, Osmic, XOS, Bede and Rich-Seifert were<br />
essential for the organisation and to support the<br />
participation of young scientists and colleagues <strong>from</strong> lessfavoured<br />
countries.<br />
The general conference topics concerned materials<br />
microstructure and properties, as they can be studied by<br />
diffraction methods. In addition, applications of diffraction<br />
techniques to polycrystalline and amorphous materials were<br />
also discussed. Following the tradition of the previous Size-<br />
Strain conferences main themes were methodologies for the<br />
study of lattice defects, residual stress and texture in thin<br />
films and surfaces, line profile fitting/modeling based on<br />
fundamental parameters, simulation of materials<br />
microstructure and defects related to diffraction profiles.<br />
Particular emphasis was given to materials science<br />
applications, including e.g., phase analysis with amorphous<br />
fraction, highly defective and nanocrystalline materials,<br />
residual stress gradients and stress mapping in thin layers<br />
and coating systems.<br />
The conference was organized around the topics of 13<br />
invited talks (A. Kern, I. Groma, J.-D. Kamminga, N.<br />
Armstrong, A. Ustinov, P. Scardi, J. Cline, R. Birringer, M.<br />
Leoni, C. Genzel, U. Welzel, P: Riello), including the honor<br />
lecture by Ian Langford who presented an overview on the<br />
history of powder diffraction and line profile analysis<br />
methods in the past century. 15 contributed talks and two<br />
sessions dedicated to posters completed an intensive and<br />
interesting program.<br />
One of the targets of the conference was to get<br />
together most of the experts in the main areas of interest<br />
and to encourage a free exchange of information and<br />
discussion among attendees. From this point of view the<br />
conference was a real success: long and animated<br />
discussions followed most of the presentations, thus<br />
providing a real insight into the current research activity.<br />
Front cover of the<br />
conference proceeding<br />
booklet<br />
I I I<br />
T R E N T O<br />
Participants enjoyed the local hospitality, as also<br />
demonstrated by the high popularity of the archeological<br />
tour (visit to the underground Roman site) and especially of<br />
the social dinner and ‘wine’ tour.<br />
Conference proceedings are collected in a booklet of<br />
extended abstract of all the presented contributions (orals<br />
and posters) which is available on request. Abstract are also<br />
displayed in electronic format on the IXAS web site<br />
(http://www.ixas.org). A book, containing full chapters<br />
dedicated to the most significant and pertinent contributions<br />
is currently being edited by the conference Chairs (P.<br />
Scardi and E. Mittemeijer) and should be published within<br />
one year <strong>from</strong> the conference.<br />
Beyond the scientific program, the conference was also<br />
a nice opportunity to celebrate the long and fruitful carrier<br />
of Ian Langford. Even if he formally retired less than two<br />
years ago, he is very active and we all hope Ian will<br />
continue to significantly contribute to the progress in<br />
<strong>Powder</strong> <strong>Diffraction</strong> in future.<br />
As a final remark, it is not to early to think of<br />
candidates to the organization of a 4 th Size-Strain<br />
conference. Proposal and suggestions will be very<br />
welcome.<br />
41
News <strong>from</strong> the<br />
International Centre for <strong>Diffraction</strong> <strong>Data</strong><br />
(ICDD)<br />
12 Campus Boulevard Phone: +610.325.9814<br />
Newtown Square, PA 19073-3273 Fax: +610.325.9823<br />
U.S.A.<br />
E-mail: INFO@ICDD.COM<br />
IXAS Web Site Launched<br />
In the last CPD newsletter, it was announced that an agreement<br />
was reached to have the ICDD provide web services<br />
for the International X-ray Analysis<br />
Society (IXAS). The IXAS web site is<br />
now on-line at www.ixas.org. Membership<br />
is free and open to the global scientific<br />
community—to join, register at the web site. The web<br />
site provides on-line access to Advances in X-ray Analysis,<br />
Volumes 42 and 43 (proceedings of the 1998 and 1999<br />
Denver X-ray Conferences), as well as recent abstracts<br />
<strong>from</strong> the Size Strain III—Analysis of Microstructure and<br />
Residual Stress by <strong>Diffraction</strong> Methods Conference, held<br />
in Trento, Italy, 2–5 December 2001.<br />
The IXAS is a not-for-profit, scientific association that<br />
focuses on the use of X-rays, neutrons, and electrons in<br />
materials characterization. The purpose of the Society is to<br />
serve professionals working in the field of materials analysis<br />
by: (a) fostering interaction among materials scientists,<br />
chemists, physicists, geologists, and others engaged in the<br />
use of X-rays and other radiations, including neutrons and<br />
electrons, for materials analysis; (b) sponsoring meetings<br />
of interest to those in the field of materials analysis; and<br />
(c) disseminating information of interest to the materials<br />
analysis community.<br />
The 50th Annual Denver X-ray Conference<br />
The Denver X-ray Conference (DXC) celebrated its 50th<br />
anniversary in the majestic mountains of Steamboat<br />
Springs, Colorado. The conference<br />
was held 30 July–3 August 2001 and<br />
attracted approximately 350 attendees<br />
and over 200 exhibit personnel.<br />
Conference week began with 15 tutorial workshops, followed<br />
by 16 special sessions.<br />
The Plenary session, “Fifty Years of the Denver X-ray<br />
Conference”, gave attendees the opportunity to learn the<br />
history of what has grown to become the single most<br />
http://www.icdd.com<br />
important U.S. meeting in the X-ray analysis community.<br />
The session included presentations <strong>from</strong> the pioneers of<br />
the DXC—William Mueller, Colorado School of Mines;<br />
John B. Newkirk, Colorado Sports Equipment, Inc.; Clay<br />
Ruud, The Pennsylvania State University; Paul Predecki,<br />
The University of Denver; and Ron Jenkins, (Emeritus)<br />
ICDD. Each speaker highlighted a particular era of the<br />
conference, describing the significant endeavors of the<br />
time and how those events influenced the DXC. The lectures<br />
and lecturers were immensely entertaining and often<br />
humorous. The experience was nostalgic for some,<br />
enlightening for others, and impressive to all.<br />
Several awards were presented at the conference:<br />
The 2001 Barrett Award, established for excellence in the<br />
powder diffraction field,<br />
was presented to David E.<br />
Cox, (Emeritus) Brookhaven<br />
National Laboratory. P.K.<br />
Predecki, The University of<br />
Denver, presented the award.<br />
Newly established in 2001 to recognize scientists for their<br />
lifetime achievement in the advancement of X-rays for<br />
materials analysis, the Jenkins Award was presented to<br />
Ron Jenkins, (Emeritus) ICDD by R.L. Snyder, The Ohio<br />
State University.<br />
C.R. Hubbard, Oak Ridge National Laboratories, presented<br />
the 2001 Hanawalt Award to Raymond P. Goehner<br />
and Joseph R. Michael,<br />
Sandia National Laboratories.<br />
This award is given<br />
in recognition of an important,<br />
recent contribution<br />
to the field of powder<br />
diffraction. The Hanawalt Award Lecture, “Phase<br />
Identification Using Electron Backscatter <strong>Diffraction</strong> in<br />
the SEM: A Powerful Tool for Materials Science” was<br />
presented at the plenary session.
Ron Jenkins, (Emeritus)<br />
ICDD, received the Distinguished<br />
Fellows Award for<br />
his long and meritorious<br />
service to the ICDD. Julian<br />
Messick, ICDD, presented<br />
the award.<br />
Annual Spring Meeting Dates<br />
The ICDD Annual Spring Meetings will be held at ICDD<br />
Headquarters, 18–22 March 2002.<br />
ICDD Welcomes its New Executive Director,<br />
Dr. Tim Fawcett<br />
The ICDD is pleased to announce that Dr. Tim Fawcett<br />
has joined the ICDD as its new Executive Director. Dr.<br />
Fawcett is a long<br />
time ICDD member,<br />
ICDD Fellow,<br />
and served on the<br />
Board of Directors<br />
<strong>from</strong> 1986–1988.<br />
He brings to the<br />
ICDD outstanding<br />
experience in management<br />
and R&D<br />
for product development, as well as an exceptional background<br />
in X-ray diffraction.<br />
Dr. Fawcett received his B.S. degree with honors <strong>from</strong> the<br />
University of Massachusetts, and his Ph.D. in Inorganic<br />
Chemistry <strong>from</strong> Rutgers University in 1979. After graduation,<br />
Dr. Fawcett joined Dow Chemical Co., worked in<br />
the X-ray diffraction facility, and then managed the inorganic<br />
analysis laboratories of Dow’s Analytical Sciences<br />
Department. From 1989 to 1996, he managed several<br />
groups in Dow's Ceramics and Advanced Materials<br />
Laboratories. Dr. Fawcett was promoted to Sr. Research<br />
Manager and managed Dow's Advanced Technologies<br />
and Inorganic Coatings Group, the Interfacial Sciences<br />
Discipline, and most recently, two of Dow's new product<br />
development areas which involved a portfolio of projects<br />
leading to advanced materials products.<br />
New Products<br />
The ICDD introduces a new product line! The new<br />
database products, PDF-4s, are organized in a relational<br />
database format, which provides extensive data mining in<br />
quick time. The PDF-4 products feature a powerful user<br />
interface, PCPDFWIN, with query sorting capabilities<br />
and integrated viewing software. PDF-4/Minerals 2001 and<br />
PDF-4 Metals and Alloys 2001 are now available with<br />
PDF-4/Full File scheduled to be released in the Spring 2002.<br />
Our new products include the updated Mineral <strong>Powder</strong><br />
<strong>Diffraction</strong> File <strong>Data</strong> Book and Search Manual, a hardcover<br />
edition featuring Sets 1–50 of the PDF ® . A special<br />
combination price is available on the purchase of this<br />
edition along with our new PDF-4/Minerals 2001.<br />
Additional pricing incentives include a Multiyear License<br />
Renewal Program as well as an expanded Site License<br />
Program. The Multiyear License Renewal Program provides<br />
savings on the purchase of multiyear license<br />
renewals for the PDF-2 and PDF-4/Full-File.<br />
In celebration of our “Sixtieth Anniversary”, the ICDD is<br />
introducing special “Anniversary” pricing that offers<br />
savings up to 45% off the list prices for a PDF-2 license<br />
renewal. Now containing over 136,000 patterns, the<br />
PDF ® has more than doubled in size in the past five years<br />
with the addition of calculated patterns <strong>from</strong> the Inorganic<br />
Crystal Structure <strong>Data</strong>base, maintained by Fachsinformationzentrum<br />
in Karlsruhe, the continuous addition<br />
of patterns of important new materials <strong>from</strong> the ICDD’s<br />
Grant-in-Aid program, as well as patterns located by the<br />
ICDD’s bibliographic staff. Anniversary pricing provides<br />
a valuable opportunity for noncurrent users to update their<br />
PDF ® and significantly improve the quality, accuracy, and<br />
coverage of their work.<br />
The ICDD’s quarterly journal,<br />
<strong>Powder</strong> <strong>Diffraction</strong>, has a new<br />
up-to-date look, featuring the lead<br />
article on the cover. Along with this<br />
new look, the journal has been<br />
updated to include on-line subscriptions.<br />
Subscribers may obtain<br />
the journal in print, on-line, or in<br />
print and on-line together<br />
Further Information<br />
To learn more about the ICDD, its products and services, please visit our web sites: www.icdd.com and www.dxcicdd.com.
IXAS NEWS<br />
A few years ago the Denver X-ray Conference organizing<br />
committee established an international committee that met<br />
in Barcelona in May 2000 and founded the International X-<br />
ray Analysis Society. The By-Laws for this fully electronic<br />
and completely dues-free organization provided for the<br />
phasing in of an Executive Council and the establishment<br />
of a web site and focus groups. The last of the elections<br />
establishing the Executive council has just been held and<br />
the first complete council is now in place. The officers are:<br />
Bob Snyder (President)<br />
George Havrilla (Vice-President, President-Elect)<br />
Greg McCarthy (Secretary-Treasurer)<br />
The latest members of the Council are:<br />
Jimpei Harada (Japan)<br />
Scott Misture (USA)<br />
Silvana Simabuco(Brazil)<br />
Szabina Torok (Hungary)<br />
They join the previously elected Council members:<br />
E. Antipov (Russia)<br />
R. vanGrieken (Belgium)<br />
B. Holynska (Poland)<br />
B O’Connor (Australia)<br />
P. Scardi (Italy)<br />
H. Toraya (Japan)<br />
P. Wobrauscek (Austria)<br />
IXAS will conduct the first full membership election this<br />
spring for the President-Elect at which time Snyder will<br />
become Past-President and Havrilla will become President.<br />
Our new web page is now in place with the full proceedings<br />
of the last two editions of Advances in X-ray Analysis and<br />
all of the latest information on the world’s X-ray<br />
conferences. Software is now in place implementing<br />
discussion groups among all of the Analysis area interest<br />
groups. Visit www.ixas.org to see the developments.<br />
WHAT’S ON<br />
The following web-site contains an up-to-date and<br />
semi-exhaustive list of conferences and workshops in<br />
crystallography and related areas<br />
http://www.iucr.org/cww-top/mtg.date.html<br />
20 – 23 January 2002 (! new date !)<br />
SECOND ISPD--2001<br />
Calcutta and Bangalore, India<br />
Second International School on <strong>Powder</strong> <strong>Diffraction</strong><br />
(ISPD--2001)will be held in Jadavpur, Calcutta, India <strong>from</strong><br />
2ß –23 January, 2002. Lecture sessions include<br />
contemporary topics in powder diffraction by X-ray,<br />
electron, neutron and synchrotron radiation, given by<br />
experts with hands-on computer sessions for young and<br />
active researchers in institutes, universities, and companies.<br />
The meeting is sponsored by IUCr, ICDD and other<br />
organizations.<br />
For further information contact:<br />
For ISPD 2001: Prof S P Sen Gupta,<br />
E-mail:msspsg@mahendra.iacs.res.in,<br />
Fax: 91-33-473 2805<br />
Web-site: www.iacs.res.in/ispd.html<br />
11 – 15 February 2002<br />
AXAA 2002<br />
Newcastle, NSW, Australia<br />
The schools program aims to provide training for early<br />
career professionals. The conference provides an<br />
opportunity for professionals with an interest in x-ray and<br />
surface analysis to come together over five days. The<br />
conference aims to: Recognise progress and highlight<br />
future directions for X-ray and surface analysis; develop<br />
knowledge and expertise in X-ray analysis practice and<br />
management; motivate participants to contribute to<br />
effective x-ray fluorescence, diffraction and surface<br />
analysis programs.<br />
For further information contact:<br />
Jane Yeaman<br />
AXAA 2002 Conference<br />
Tulips Meetings Management<br />
PO Box 116, Salamander Bay, NSW, 2317 Australia<br />
Tel 02 4984 2554<br />
Fax 02 4984 2755<br />
Email: axaa@pco.com.au<br />
Web-site: www.pco.com.au/axaa2002/<br />
8-12 April 2002<br />
ADVANCED X-RAY DIFFRACTION FOR PHARMACEUTICAL<br />
APPLICATIONS TRAINING SEMINARS<br />
The Eden Resort Inn & Conference Center, Lancaster PA,<br />
USA.<br />
Application of X-ray powder diffraction, in particular its<br />
capability of solving structures <strong>from</strong> powder data in the<br />
pharmaceutical area.<br />
For further information contact:<br />
assainternational Inc.<br />
3B East Lake Road<br />
Danbury, CT 06811, USA<br />
Tel: (203).312.0682<br />
Fax: (203).312.0722<br />
E-Mail: info@assainternational.com<br />
Web-site: www.assainternational.com/home.htm<br />
44
International Centre for <strong>Diffraction</strong> <strong>Data</strong><br />
1941—Sixty Years—2001<br />
Serving the Scientific Community<br />
Release 2001<br />
of the<br />
<strong>Powder</strong> <strong>Diffraction</strong> File <br />
Featuring<br />
❖ Release 2001 totals more than 136,500 patterns<br />
❖ Over 87,500 experimental patterns<br />
❖ 2,500 new experimental patterns added for Release 2001<br />
❖ Over 49,000 patterns calculated <strong>from</strong> the ICSD database<br />
❖ 2,821 new calculated patterns added for Release 2001<br />
❖ Interplanar (d) spacings, relative intensities (Int), and Miller indices<br />
❖ Chemical formula, compound name, mineral<br />
name, structural formula, crystal system,<br />
physical data, experimental parameters,<br />
and references when available<br />
❖ Quality mark for each experimental<br />
pattern for estimate of reliability<br />
❖ Entries indexed for subfile searches<br />
❖ Dedication to detail and scientific purpose<br />
❖ Four-tiered editorial process<br />
❖ Highest standards for accuracy and quality<br />
Ask about our special Anniversary pricing<br />
Visit us at www.icdd.com<br />
Phone: 610.325.9814 ❖ Sales: 610.325.9810 ❖ Fax: 610.325.9823 ❖ info@icdd.com<br />
ICDD, the ICDD logo, and PDF are registered trademarks of the JCPDS—International Centre for <strong>Diffraction</strong> <strong>Data</strong>.<br />
<strong>Powder</strong> <strong>Diffraction</strong> File is a trademark of the JCPDS—International Centre for <strong>Diffraction</strong> <strong>Data</strong>.
29 April - 3 May 2002<br />
PRACTICAL X-RAY FLUORESCENCE SPECTROMETRY<br />
ICDD, Newtown Square, Pennsylvania, U.S.A.<br />
Covering basics of X-ray spectra, instrumentation design,<br />
methods of qualitative and quantitative analysis, specimen<br />
preparation, review of mathematical matrix correction<br />
procedures, applications for both wavelength and energy<br />
dispersive spectrometry and new developments in XRF.<br />
23 – 26 May 2002<br />
EPDIC 8<br />
Uppsala, Sweden<br />
The scientific programme for the three-day conference<br />
will include invited plenary lectures, contributed talks and<br />
poster sessions. A commercial exhibition will also be<br />
organised.<br />
The Programme will cover the topics:<br />
1. Methods and techniques<br />
2. Instrumental development<br />
3. New or improved software<br />
4. <strong>Data</strong>bases<br />
5. Materials Sciences<br />
6. Dynamic studies<br />
7. Studies under non-ambient conditions<br />
8. Industrial processes and applications<br />
9. New research fields<br />
Other contributions relevant or complementary to powder<br />
diffraction are welcome.<br />
Internet: http://www.mkem.uu.se/epdic8<br />
e-mail: epdic8@mkem.uu.se<br />
Tel/Fax: 46-18-471 3733 / 46-18-513548<br />
Surface mail: Attn. Gunilla Lindh<br />
EPDIC-8, Dept. of Materials Chemistry,<br />
The Ångström Laboratory<br />
Box 538, SE-751 21 Uppsala, Sweden<br />
3-7 June 2002<br />
FUNDAMENTALS OF X-RAY POWDER DIFFRACTION<br />
ICDD, Newtown Square, Pennsylvania, U.S.A.<br />
Covering instrumentation, specimen preparation, data<br />
acquisition, and qualitative phase analysis.<br />
10 – 14 June 2002<br />
ADVANCED METHODS IN X-RAY POWDER DIFFRACTION<br />
ICDD, Newtown Square, Pennsylvania, U.S.A.<br />
Emphasizing computer-based methods of data collection<br />
and interpretation, both for qualitative and quantitative<br />
phase analysis.<br />
29 July to 2 August 2002<br />
THE 51 ST ANNUAL DENVER X-RAY CONFERENCE<br />
Colorado Springs, Colorado, U.S.A.<br />
The 51 st Denver X-ray Conference will be held at the<br />
Adams Mark Hotel (formerly Antlers Doubletree Hotel) in<br />
Colorado Springs, Colorado. The Call for Papers is now<br />
available in hardcopy form and on the website.<br />
For further information contact:<br />
Conference Coordinator<br />
International Centre for <strong>Diffraction</strong> <strong>Data</strong><br />
12 Campus Boulevard<br />
Newtown Square, PA 19073-3273<br />
Tel: +(610) 325-9814<br />
Fax: +(610) 325-9823<br />
E-mail: dxc@icdd.com<br />
Web-site: www.dxcicdd.com<br />
6 – 14 August 2002<br />
XIX CONGRESS AND GENERAL ASSEMBLY OF<br />
THE INTERNATIONAL UNION OF<br />
CRYSTALLOGRAPHY<br />
Geneva, Switzerland<br />
A large-scale conference that will address all the main<br />
issues in crystallography during a long and interesting<br />
programme. Even if <strong>Powder</strong> <strong>Diffraction</strong> sessions are not<br />
specifically included, a number of microsymposia will be<br />
devoted to several aspects of powder diffraction and<br />
materials science. The second circular with the preliminary<br />
programme is now available and can be downloaded <strong>from</strong><br />
the web.<br />
For further information contact:<br />
Joel Bernstein Chairperson, Organizing Committee<br />
Menahem Kaftory Chairperson, International Program<br />
Committee<br />
e-mail: Kaftory@techunix.technion.ac.il<br />
Secretariat:<br />
XIIX IUCr,<br />
P.O. Box 50006,<br />
Tel Aviv 61500, Israel<br />
Tel: +(972) 3 5140000<br />
Fax: +(972) 3 5175674<br />
E-mail: iucr@kenes.com<br />
Web-site: http://www.kenes.com/iucr/<br />
For further information on all ICDD meetings contact:<br />
Education Coordinator<br />
International Centre for <strong>Diffraction</strong> <strong>Data</strong><br />
12 Campus Boulevard<br />
Newtown Square, PA 19073-3273<br />
Tel: +(610) 325-9814<br />
Fax: +(610) 325-9823<br />
E-mail: clinics@icdd.com<br />
Web-site: www.icdd.com/education/clinics/<br />
46
How to receive the IUCr CPD Newsletter<br />
If you wish to be added to the mailing list for the Newsletter of the IUCr Commission on <strong>Powder</strong> <strong>Diffraction</strong> or have<br />
changed address, please contact the Chairman or simply send an e-mail to CPD@ing.unitn.it<br />
Companies<br />
If you would like to advertise in this twice-yearly newsletter, please contact<br />
Paolo Scardi on e-mail: Paolo.Scardi@ing.unitn.it<br />
Tel: +39 0461 882417/67<br />
Fax: +39 0461 881977<br />
Call for contributions to the next CPD Newsletter (No 27)<br />
The next issue of the CPD Newsletter will be edited by Gert Kruger, to appear in summer of 2002. Gert will greatly<br />
appreciate contributions <strong>from</strong> readers on matters of interest to the powder diffraction community, e.g. meeting reports,<br />
future meetings, developments in instruments, techniques, and news of general interest. Please contact him for sending<br />
articles and suggestions. Software developments can be directly addressed to Lachlan Cranswick or to the Editor of<br />
Newsletter No 27 (addresses are given below)<br />
Prof. G. J. Kruger (Gert)<br />
Department of Chemistry & Biochemistry, Rand Afrikaans University, P O Box 524, Aucklandpark, South Africa<br />
Tel: +27 11 489 2368 | Fax: +27 11 489 2360<br />
e-mail: gjk@na.rau.ac.za<br />
Dr Lachlan M. D. Cranswick<br />
CCP14, Department of Crystallography, Birkbeck College University of London,<br />
Malet Street, Bloomsbury, WC1E 7HX, London, UK<br />
e-mail: l.m.d.cranswick@dl.ac.uk<br />
WWW: http://www.ccp14.ac.uk<br />
47