Submandibular Sonography - Journal of Ultrasound in Medicine
Submandibular Sonography - Journal of Ultrasound in Medicine
Submandibular Sonography - Journal of Ultrasound in Medicine

Create successful ePaper yourself
Turn your PDF publications into a flip-book with our unique Google optimized e-Paper software.
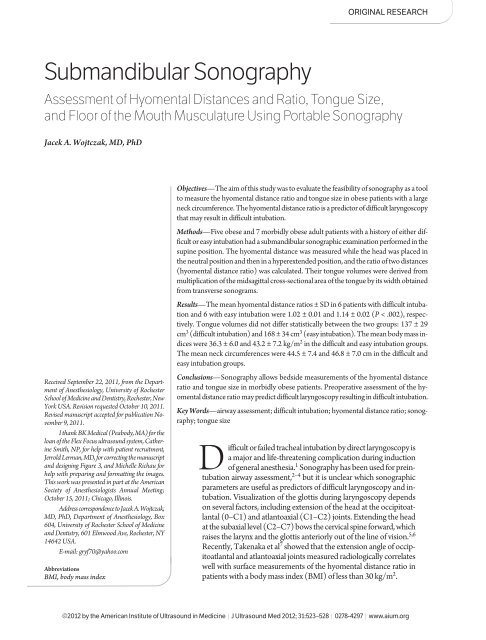
ORIGINAL RESEARCH<br />
<strong>Submandibular</strong> <strong>Sonography</strong><br />
Assessment <strong>of</strong> Hyomental Distances and Ratio, Tongue Size,<br />
and Floor <strong>of</strong> the Mouth Musculature Us<strong>in</strong>g Portable <strong>Sonography</strong><br />
Jacek A. Wojtczak, MD, PhD<br />
Received September 22, 2011, from the Department<br />
<strong>of</strong> Anesthesiology, University <strong>of</strong> Rochester<br />
School <strong>of</strong> Medic<strong>in</strong>e and Dentistry, Rochester, New<br />
York USA. Revision requested October 10, 2011.<br />
Revised manuscript accepted for publication November<br />
9, 2011.<br />
I thank BK Medical (Peabody, MA) for the<br />
loan <strong>of</strong> the Flex Focus ultrasound system, Cather<strong>in</strong>e<br />
Smith, NP, for help with patient recruitment,<br />
Jerrold Lerman, MD, for correct<strong>in</strong>g the manuscript<br />
and design<strong>in</strong>g Figure 3, and Michelle Richau for<br />
help with prepar<strong>in</strong>g and formatt<strong>in</strong>g the images.<br />
This work was presented <strong>in</strong> part at the American<br />
Society <strong>of</strong> Anesthesiologists Annual Meet<strong>in</strong>g;<br />
October 15, 2011; Chicago, Ill<strong>in</strong>ois.<br />
Address correspondence to Jacek A. Wojtczak,<br />
MD, PhD, Department <strong>of</strong> Anesthesiology, Box<br />
604, University <strong>of</strong> Rochester School <strong>of</strong> Medic<strong>in</strong>e<br />
and Dentistry, 601 Elmwood Ave, Rochester, NY<br />
14642 USA.<br />
E-mail: gryf70@yahoo.com<br />
Abbreviations<br />
BMI, body mass <strong>in</strong>dex<br />
Objectives—The aim <strong>of</strong> this study was to evaluate the feasibility <strong>of</strong> sonography as a tool<br />
to measure the hyomental distance ratio and tongue size <strong>in</strong> obese patients with a large<br />
neck circumference. The hyomental distance ratio is a predictor <strong>of</strong> difficult laryngoscopy<br />
that may result <strong>in</strong> difficult <strong>in</strong>tubation.<br />
Methods—Five obese and 7 morbidly obese adult patients with a history <strong>of</strong> either difficult<br />
or easy <strong>in</strong>tubation had a submandibular sonographic exam<strong>in</strong>ation performed <strong>in</strong> the<br />
sup<strong>in</strong>e position. The hyomental distance was measured while the head was placed <strong>in</strong><br />
the neutral position and then <strong>in</strong> a hyperextended position, and the ratio <strong>of</strong> two distances<br />
(hyomental distance ratio) was calculated. Their tongue volumes were derived from<br />
multiplication <strong>of</strong> the midsagittal cross-sectional area <strong>of</strong> the tongue by its width obta<strong>in</strong>ed<br />
from transverse sonograms.<br />
Results—The mean hyomental distance ratios ± SD <strong>in</strong> 6 patients with difficult <strong>in</strong>tubation<br />
and 6 with easy <strong>in</strong>tubation were 1.02 ± 0.01 and 1.14 ± 0.02 (P < .002), respectively.<br />
Tongue volumes did not differ statistically between the two groups: 137 ± 29<br />
cm 3 (difficult <strong>in</strong>tubation) and 168 ± 34 cm 3 (easy <strong>in</strong>tubation). The mean body mass <strong>in</strong>dices<br />
were 36.3 ± 6.0 and 43.2 ± 7.2 kg/m 2 <strong>in</strong> the difficult and easy <strong>in</strong>tubation groups.<br />
The mean neck circumferences were 44.5 ± 7.4 and 46.8 ± 7.0 cm <strong>in</strong> the difficult and<br />
easy <strong>in</strong>tubation groups.<br />
Conclusions—<strong>Sonography</strong> allows bedside measurements <strong>of</strong> the hyomental distance<br />
ratio and tongue size <strong>in</strong> morbidly obese patients. Preoperative assessment <strong>of</strong> the hyomental<br />
distance ratio may predict difficult laryngoscopy result<strong>in</strong>g <strong>in</strong> difficult <strong>in</strong>tubation.<br />
Key Words—airway assessment; difficult <strong>in</strong>tubation; hyomental distance ratio; sonography;<br />
tongue size<br />
Difficult or failed tracheal <strong>in</strong>tubation by direct laryngoscopy is<br />
a major and life-threaten<strong>in</strong>g complication dur<strong>in</strong>g <strong>in</strong>duction<br />
<strong>of</strong> general anesthesia. 1 <strong>Sonography</strong> has been used for pre<strong>in</strong>tubation<br />
airway assessment, 2–4 but it is unclear which sonographic<br />
parameters are useful as predictors <strong>of</strong> difficult laryngoscopy and <strong>in</strong>tubation.<br />
Visualization <strong>of</strong> the glottis dur<strong>in</strong>g laryngoscopy depends<br />
on several factors, <strong>in</strong>clud<strong>in</strong>g extension <strong>of</strong> the head at the occipitoatlantal<br />
(0–C1) and atlantoaxial (C1–C2) jo<strong>in</strong>ts. Extend<strong>in</strong>g the head<br />
at the subaxial level (C2–C7) bows the cervical sp<strong>in</strong>e forward, which<br />
raises the larynx and the glottis anteriorly out <strong>of</strong> the l<strong>in</strong>e <strong>of</strong> vision. 5,6<br />
Recently, Takenaka et al 7 showed that the extension angle <strong>of</strong> occipitoatlantal<br />
and atlantoaxial jo<strong>in</strong>ts measured radiologically correlates<br />
well with surface measurements <strong>of</strong> the hyomental distance ratio <strong>in</strong><br />
patients with a body mass <strong>in</strong>dex (BMI) <strong>of</strong> less than 30 kg/m 2 .<br />
©2012 by the American Institute <strong>of</strong> <strong>Ultrasound</strong> <strong>in</strong> Medic<strong>in</strong>e | J <strong>Ultrasound</strong> Med 2012; 31:523–528 | 0278-4297 | www.aium.org
Wojtczak—<strong>Submandibular</strong> <strong>Sonography</strong><br />
The hyomental distance is the distance between the<br />
hyoid bone and the mandibular mentum. The hyomental<br />
distance ratio is def<strong>in</strong>ed as the ratio <strong>of</strong> the hyomental distance<br />
<strong>in</strong> the neutral position with that at the extreme <strong>of</strong><br />
head extension. The hyoid bone is attached to the styloid<br />
process <strong>of</strong> the occiput by the stylohyoid ligament. Therefore,<br />
the distance between the hyoid bone and the basiocciput<br />
rema<strong>in</strong>s constant dur<strong>in</strong>g extension/flexion <strong>of</strong> the<br />
neck. 8 When the occipitoatlantal-atlantoaxial complex is<br />
extended, the mentum moves away from the hyoid bone,<br />
<strong>in</strong>creas<strong>in</strong>g the hyomental distance. 8 The movement results<br />
from rotation <strong>of</strong> the head around the basiocciput.<br />
In contrast, when the neck is extended at the subaxial<br />
level without occipitoatlantal and atlantoaxial jo<strong>in</strong>t extension,<br />
the mentum does not move <strong>in</strong> relation to the hyoid<br />
bone because head rotation does not occur. Therefore, the<br />
hyomental distance rema<strong>in</strong>s unchanged.<br />
Palpation <strong>of</strong> the body <strong>of</strong> the hyoid bone may be very<br />
difficult if not impossible <strong>in</strong> obese and morbidly obese patients<br />
with a large neck circumference. Therefore, we evaluated<br />
the feasibility <strong>of</strong> measur<strong>in</strong>g the hyomental distance<br />
ratio as well as volumes <strong>of</strong> the tongue and muscles <strong>of</strong> the<br />
floor <strong>of</strong> the mouth <strong>in</strong> obese patients us<strong>in</strong>g submandibular<br />
sonography.<br />
Materials and Methods<br />
Patient Population<br />
With the approval <strong>of</strong> the Institutional Research Subjects<br />
Review Board, written <strong>in</strong>formed consent was obta<strong>in</strong>ed<br />
from 12 patients (5 female and 7 male, ages 24–76 years)<br />
undergo<strong>in</strong>g preoperative evaluation <strong>in</strong> the anesthesia<br />
cl<strong>in</strong>ic.<br />
Anatomy <strong>of</strong> the Suprahyoid Airway<br />
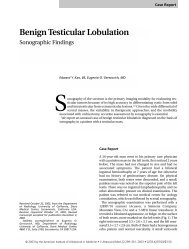
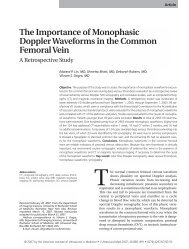
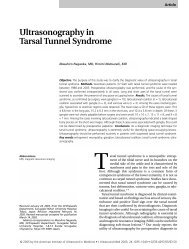
Figure 1 illustrates the suprahyoid anatomy correspond<strong>in</strong>g<br />
to the submandibular sonograms presented <strong>in</strong> this study.<br />
The draw<strong>in</strong>gs are <strong>in</strong>verted and oriented to match the sonograms<br />
that follow.<br />
Sonographic Measurements <strong>of</strong> Hyomental Distances<br />
and Volumes <strong>of</strong> the Tongue and Muscles <strong>of</strong> the Floor <strong>of</strong><br />
the Mouth<br />
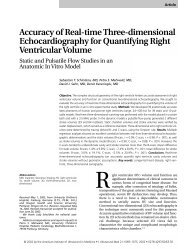
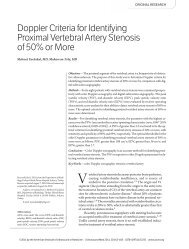
A curved low-frequency (5-MHz) transducer and a Flex<br />
Focus 400 ultrasound system (BK Medical, Peabody, MA)<br />
were used to visualize the tongue and shadows <strong>of</strong> the hyoid<br />
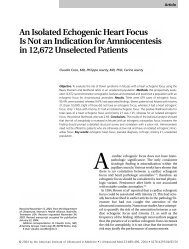
bone and mandible (Figure 2). The midsagittal and coronal/transverse<br />
scans were transferred from the ultrasound<br />
mach<strong>in</strong>e to a laptop computer and analyzed us<strong>in</strong>g ImageJ,<br />
the image-process<strong>in</strong>g s<strong>of</strong>tware developed by the National<br />
Institutes <strong>of</strong> Health (http://rsb.<strong>in</strong>fo.nih.gov/ij/; accessed<br />
August 17, 2010).<br />
The mentum and hyoid bone appear <strong>in</strong> midsagittal<br />
scans as hyperechoic structures with hypoechoic shadow<strong>in</strong>g.<br />
The hyomental distances <strong>in</strong> the neutral and headextended<br />
positions were measured from the upper border<br />
<strong>of</strong> the hyoid bone to the lower border <strong>of</strong> the mentum.<br />
The midsagittal scans were also used to measure the<br />
cross-sectional area <strong>of</strong> the tongue. Transverse scans obta<strong>in</strong>ed<br />
<strong>in</strong> the midsection <strong>of</strong> the tongue (at the glossal end<br />
<strong>of</strong> the genioglossus muscle) provided a measure <strong>of</strong> the<br />
tongue width, which was measured between the most distant<br />
po<strong>in</strong>ts on its upper surface (Figure 2, bottom panel).<br />
The tongue volume was derived from multiplication <strong>of</strong> the<br />
midsagittal cross-sectional area by the tongue width. This<br />
method most likely overestimates the volume because it<br />
assumes that the tongue width rema<strong>in</strong>s the same at the<br />
level <strong>of</strong> the mentum and the hyoid bone as it is <strong>in</strong> the midsection.<br />
Indeed, our prelim<strong>in</strong>ary results 9 showed that the<br />
mean tongue volume <strong>in</strong> 10 healthy volunteers was 111 ±<br />
4.1 cm 3 us<strong>in</strong>g above formula versus 106 ± 3.9 cm 3 us<strong>in</strong>g<br />
the 3-dimensional submandibular sonographic method,<br />
which detects the true geometry <strong>of</strong> the tongue. Because<br />
the difference is relatively small, a correction factor was not<br />
used <strong>in</strong> this study.<br />
The cross-sectional area <strong>of</strong> the muscles <strong>of</strong> the floor <strong>of</strong><br />
the mouth was the sum <strong>of</strong> the areas <strong>of</strong> geniohyoid, mylohyoid,<br />
and diglossus muscles (Figure 2) <strong>in</strong> the transverse<br />
scans <strong>in</strong> the midsection <strong>of</strong> the tongue. The muscle volume<br />
<strong>of</strong> the floor <strong>of</strong> the mouth was derived from multiplication<br />
<strong>of</strong> the cross-sectional area <strong>of</strong> the floor <strong>of</strong> the mouth muscles<br />
by the hyomental distance <strong>in</strong> the neutral position.<br />
For sonographic exam<strong>in</strong>ations, patients were positioned<br />
with the torso and head on a firm exam<strong>in</strong>ation table.<br />
They were <strong>in</strong>structed to look straight up, keep<strong>in</strong>g their<br />
heads <strong>in</strong> a neutral position, to close their mouths, and to<br />
Figure 1. Upper airway anatomy based on midsagittal (left) and transverse<br />
(right) anatomic sections. The draw<strong>in</strong>gs are <strong>in</strong>verted and oriented<br />
to match the sonograms that are presented <strong>in</strong> the follow<strong>in</strong>g images. DG<br />
<strong>in</strong>dicates diglossus muscle; E, epiglottis; GG, genioglossus muscle; GH,<br />
geniohyoid muscle; H, hyoid bone; M, mandible; MH, mylohyoid muscle<br />
(“mandibular” diaphragm); and TS, tongue surface.<br />
524<br />
J <strong>Ultrasound</strong> Med 2012; 31:523–528
Wojtczak—<strong>Submandibular</strong> <strong>Sonography</strong><br />
keep the tongue on the mouth floor. After a first series <strong>of</strong><br />
scans, the patients were <strong>in</strong>structed to extend their necks<br />
maximally while tak<strong>in</strong>g care to avoid lift<strong>in</strong>g their shoulders<br />
<strong>of</strong>f the table. Then a second series <strong>of</strong> ultrasound scans was<br />
performed. The neutral head position before each scan series<br />
was verified us<strong>in</strong>g a goniometer to measure the angle<br />
(90°) between the surface <strong>of</strong> the table and the patients’<br />
mentum.<br />
Airway Assessment and Digital Photography<br />
A visual exam<strong>in</strong>ation <strong>of</strong> the oropharynx was performed<br />
with the patients sitt<strong>in</strong>g upright (mouth wide open, neck<br />
flexed, not vocaliz<strong>in</strong>g, and tongue extended) and scored<br />
us<strong>in</strong>g the Mallampati 10 classification with the Samsoon<br />
and Young 11 modification (class I, s<strong>of</strong>t palate, fauces, pillars,<br />
and uvula visible; class II, s<strong>of</strong>t palate, fauces, and uvula<br />
visible; class III, only s<strong>of</strong>t palate and base <strong>of</strong> uvula visible;<br />
and class IV, only hard palate visible). The circumference<br />
<strong>of</strong> the neck was measured <strong>in</strong> each patient <strong>in</strong> the upright<br />
position at the level <strong>of</strong> the superior border <strong>of</strong> the thyroid<br />
cartilage.<br />
Figure 2. Position<strong>in</strong>g <strong>of</strong> the ultrasound probe and sonographic anatomy<br />
<strong>of</strong> the suprahyoid airway <strong>in</strong> midsagittal (left) and transverse (right) scans.<br />
The midsagittal cross-sectional area <strong>in</strong> this patient was 21 cm 2 , and the<br />
tongue width was 5.4 cm. The calculated tongue volume (midsagittal<br />
cross-sectional area × tongue width) was 113 cm 3 . The transverse crosssectional<br />
area <strong>of</strong> the floor <strong>of</strong> the mouth muscles was 4.7 cm 2 , and the hyomental<br />
distance <strong>in</strong> the neutral position was 5.2 cm. The calculated<br />
muscle volume <strong>of</strong> the floor <strong>of</strong> the mouth (cross-sectional area <strong>of</strong> the floor<br />
<strong>of</strong> the mouth muscles × hyomental distance <strong>in</strong> the neutral position) was<br />
24.4 cm 3 . DG <strong>in</strong>dicates diglossus muscle; GG, genioglossus muscle;<br />
GH, geniohyoid muscle; H, hyoid bone; M, mandible; MH, mylohyoid<br />
muscle; Pal, palate; and S, tongue surface.<br />
Bony and cartilagenous landmarks such as the angle <strong>of</strong><br />
the jaw, hyoid bone, and mentum were identified by palpation<br />
and marked with standard-diameter (19- or 8.5-<br />
mm) paper stickers. Digital photographs <strong>of</strong> the oropharynx<br />
and frontal/pr<strong>of</strong>ile photographs <strong>of</strong> the head and neck <strong>in</strong><br />
the sitt<strong>in</strong>g position were obta<strong>in</strong>ed, followed by photographs<br />
<strong>of</strong> the patients’ head and neck <strong>in</strong> sup<strong>in</strong>e neutral and<br />
head-extended positions.<br />
Tracheal Intubation<br />
All patients had undergone general anesthesia with tracheal<br />
<strong>in</strong>tubation. Anesthesia records from previous anesthetics<br />
were reviewed to evaluate the ease <strong>of</strong> <strong>in</strong>tubation. The<br />
laryngoscopic grades <strong>of</strong> Cormack and Lehane 12 that were<br />
recorded dur<strong>in</strong>g tracheal <strong>in</strong>tubation were obta<strong>in</strong>ed. The<br />
Cormack-Lehane laryngoscopic classification has 4 grades<br />
(grade 1, glottis, <strong>in</strong>clud<strong>in</strong>g anterior and posterior commissures,<br />
visible; grade 2, only posterior aspects <strong>of</strong> glottis visible;<br />
grade 3, only epiglottis visible; and grade 4, epiglottis<br />
not visible, only hypopharynx visible).<br />
Statistical Analysis<br />
The statistical analysis was performed with Prism s<strong>of</strong>tware<br />
(GraphPad S<strong>of</strong>tware, Inc, San Diego, CA). Data are<br />
presented as means ± standard deviations. An unpaired<br />
2-tailed t test was performed to determ<strong>in</strong>e statistical significance.<br />
P < .05 was considered significant.<br />
Results<br />
The patient population <strong>in</strong> this study consisted <strong>of</strong> obese and<br />
morbidly obese patients with a large neck circumference.<br />
Their BMIs ranged from 30.1 to 52.3 kg/m 2 , with 7 patients<br />
be<strong>in</strong>g morbidly obese (BMI >40 kg/m 2 ). The neck<br />
circumferences <strong>of</strong> these patients ranged from 36.8 to 53.3<br />
cm, with 9 patients hav<strong>in</strong>g circumferences <strong>of</strong> greater than<br />
40 cm. In spite <strong>of</strong> the <strong>in</strong>creased submandibular s<strong>of</strong>t tissue<br />
mass <strong>in</strong> this group <strong>of</strong> patients, sonography enabled rapid<br />
and efficient measurements <strong>of</strong> hyomental distances and<br />
the hyomental distance ratio.<br />
Table 1 lists the demographic data and suprahyoid airway<br />
dimensions <strong>in</strong> the 12 patients. The mean hyomental<br />
distance ratio <strong>in</strong> 6 patients who presented with a history <strong>of</strong><br />
difficult <strong>in</strong>tubation was 1.02 ± 0.01, and the ratio <strong>in</strong> 6 patients<br />
whose airway was easy to <strong>in</strong>tubate was 1.14 ± 0.02<br />
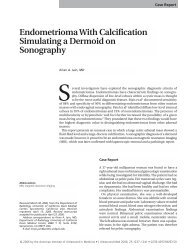
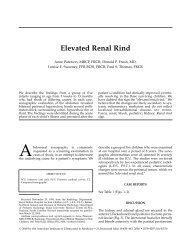
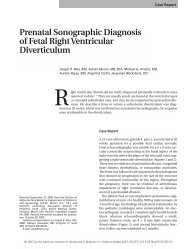
(P < .002). The hyomental distance ratio data are also presented<br />
<strong>in</strong> a graphic form <strong>in</strong> Figure 3.<br />
The mean hyomental distance <strong>in</strong> the neutral position<br />
did not differ significantly between the two groups: 51.3 ±<br />
5.3 mm (difficult <strong>in</strong>tubation) versus 57.5 ± 4.3 mm (easy<br />
J <strong>Ultrasound</strong> Med 2012; 31:523–528 525
Wojtczak—<strong>Submandibular</strong> <strong>Sonography</strong><br />
Table 1. Demographic Data and Suprahyoid Airway Dimensions<br />
A/S BMI NC MP CL In HMD n<br />
HMD e<br />
HMDR TV MVFM<br />
26/F 45.2 40.6 II 1, E 60.7 69.5 1.14 132 24.7<br />
43/M 30.7 43.2 II 2, E 55.2 64.4 1.16 166 21.0<br />
24/M 47.5 51.3 IV 2, E 60.4 67.9 1.12 209 48.0<br />
73/M 34.9 39.4 IV 3, D 49.3 50.2 1.01 172 29.4<br />
76/F 30.2 36.8 IV 3, D 50.0 50.5 1.00 145 20.7<br />
45/M 42.3 52.1 III 1, E 62.5 69.8 1.12 192 49.0<br />
45/M 41.3 48.3 II 1, E 55.5 63.1 1.13 187 50.5<br />
62/M 41.7 49.5 II 4, D 61.4 63.1 1.02 130 49.0<br />
38/F 52.3 45.7 III 1, E 51.0 59.2 1.16 124 33.1<br />
48/F 36.2 50.9 II 4, D 52.9 56.0 1.05 167 39.1<br />
55/M 44.9 53.3 III 4, D 47.1 48.2 1.02 98 47.0<br />
57/F 30.1 37.5 II 4, D 47.3 47.9 1.01 114 24.0<br />
A/S <strong>in</strong>dicates age (y)/sex; BMI, body mass <strong>in</strong>dex (kg/m 2 ); CL In, Cormack-Lehane laryngoscopic grade and ease <strong>of</strong> <strong>in</strong>tubation assessment (D,<br />
difficult; E, easy,); F, female; HMD e<br />
and HMD n<br />
, hyomental distance <strong>in</strong> the head-extended and neutral positions (mm); HMDR, hyomental distance<br />
ratio; M, male; MP, Mallampati class; MVFM, muscle volume <strong>of</strong> the floor <strong>of</strong> the mouth (cm 3 ); NC, neck circumference (cm); and TV, tongue volume<br />
(cm 3 ).<br />
<strong>in</strong>tubation), although the difference <strong>in</strong> the mean hyomental<br />
distance <strong>in</strong> the head-extended position, 52.6 ± 5.8 mm<br />
(difficult <strong>in</strong>tubation) and 65.5 ± 4.1 mm (easy <strong>in</strong>tubation),<br />
did differ significantly (P < .01). Tongue volumes did not<br />
differ significantly between the two groups, 137 ± 29 cm 3<br />
(difficult <strong>in</strong>tubation) and 168 ± 34 cm 3 (easy <strong>in</strong>tubation).<br />
The floor <strong>of</strong> the mouth muscle volumes were 34.8 ± 11<br />
cm 3 <strong>in</strong> the difficult <strong>in</strong>tubation group and 37.7 ± 13 cm 3 <strong>in</strong><br />
the easy <strong>in</strong>tubation group. The mean BMIs were 36.3 ± 6<br />
kg/m 2 <strong>in</strong> the difficult <strong>in</strong>tubation group and 43.2 ± 7.2<br />
kg/m 2 <strong>in</strong> the easy <strong>in</strong>tubation group. The mean neck circumferences<br />
were 44.5 ± 7.4 and 46.8 ± 7 cm <strong>in</strong> the difficult<br />
and easy <strong>in</strong>tubation groups, respectively.<br />
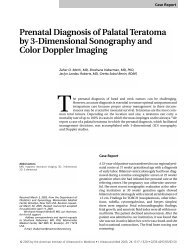
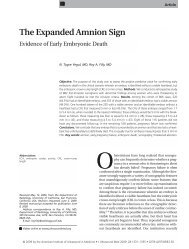
Examples <strong>of</strong> patients <strong>in</strong> whom the airway was found to<br />
be difficult and easy to <strong>in</strong>tubate are shown <strong>in</strong> Figures 4 and<br />
5, respectively. The top panels <strong>in</strong> both figures show digital<br />
Figure 3. Hyomental distance ratio (HMDR) values <strong>in</strong> patients with a<br />
history <strong>of</strong> difficult (open circles) and easy (filled triangles) <strong>in</strong>tubation.<br />
Means, standard deviations, and ranges are shown.<br />
photographs <strong>of</strong> the patients (pr<strong>of</strong>ile and sup<strong>in</strong>e with<br />
the head <strong>in</strong> the neutral and hyperextended positions),<br />
and the bottom panels show frontal photographs with<br />
the mouth open and two submandibular sonograms (left,<br />
midsagittal scan; right, transverse scan).<br />
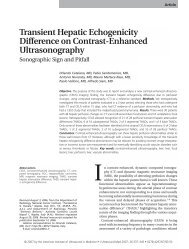
The patient <strong>in</strong> Figure 4 whose airway was impossible<br />
to <strong>in</strong>tubate had a hyomental distance ratio <strong>of</strong> 1.02. His photographs<br />
show that he could extend his neck, although the<br />
extension took place at the subaxial level <strong>of</strong> the cervical<br />
sp<strong>in</strong>e without occipitoatlantal and atlantoaxial jo<strong>in</strong>t extension.<br />
Therefore, his lower cervical sp<strong>in</strong>e is most likely bow<strong>in</strong>g<br />
forward, which lifts the larynx and the glottis forward<br />
out <strong>of</strong> the l<strong>in</strong>e <strong>of</strong> view. 5,6 This state might expla<strong>in</strong> why his<br />
airway was impossible to <strong>in</strong>tubate. Consistently, the airway<br />
<strong>of</strong> the patient <strong>in</strong> Figure 5 who had a hyomental distance<br />
ratio <strong>of</strong> 1.14, which <strong>in</strong>dicates good occipitoatlantal<br />
and atlantoaxial jo<strong>in</strong>t extension, was easy to <strong>in</strong>tubate.<br />
The patient <strong>in</strong> Figure 4 had unusually well-developed<br />
muscles <strong>of</strong> the floor <strong>of</strong> the mouth. The comb<strong>in</strong>ed volume<br />
<strong>of</strong> the tongue and the muscles <strong>of</strong> the floor <strong>of</strong> the mouth<br />
was 179 cm 3 <strong>in</strong> this patient versus 156 cm 3 <strong>in</strong> the patient <strong>in</strong><br />
Figure 5. Further question<strong>in</strong>g revealed that this patient was<br />
a music teacher and had been play<strong>in</strong>g trombone for more<br />
than 40 years. It is likely that the cont<strong>in</strong>uous exercis<strong>in</strong>g <strong>of</strong><br />
the muscles <strong>of</strong> the floor <strong>of</strong> the mouth <strong>in</strong>duced muscular<br />
hypertrophy.<br />
Discussion<br />
Limited occipitoatlantal and atlantoaxial jo<strong>in</strong>t extension and<br />
large tongue volumes can prevent adequate visualization <strong>of</strong><br />
the glottis and lead to an unexpected difficult tracheal <strong>in</strong>tu-<br />
526<br />
J <strong>Ultrasound</strong> Med 2012; 31:523–528
Wojtczak—<strong>Submandibular</strong> <strong>Sonography</strong><br />
Figure 4. Images from a 62-year-old male patient (eighth patient <strong>in</strong> Table<br />
1). Body mass <strong>in</strong>dex, 41.7 kg/m 2 ; hyomental distance <strong>in</strong> the neutral position,<br />
61.4 mm; hyomental distance <strong>in</strong> the head-extended position, 63.1<br />
mm; hyomental distance ratio, 1.02; midsagittal cross-sectional area,<br />
30.2 cm 2 (bottom left sonogram); tongue width, 4.3 cm (bottom right<br />
sonogram); tongue volume, 130 cm 3 ; muscle volume <strong>of</strong> the floor <strong>of</strong> the<br />
mouth, 49 cm 3 ; Mallampati class, II; Cormack-Lehane grade, 4; failed <strong>in</strong>tubation<br />
after several attempts by 3 experienced anesthesiologists.<br />
Video laryngoscopy (GlideScope; Verathon, Inc, Bothell, WA) was attempted<br />
without success. The patient was awakened, and planned surgery<br />
was canceled. DG <strong>in</strong>dicates diglossus muscle; GH, geniohyoid<br />
muscle; H, hyoid bone; M, mandible; and MH, mylohyoid muscle.<br />
bation. 1 Bedside assessment <strong>of</strong> the occipitoatlantal and<br />
atlantoaxial jo<strong>in</strong>t extension capacity us<strong>in</strong>g the hyomental<br />
distance ratio may be useful <strong>in</strong> predict<strong>in</strong>g difficult laryngoscopy,<br />
as shown by Huh et al 13 <strong>in</strong> a group <strong>of</strong> Korean patients<br />
with a mean BMI <strong>of</strong> less than 25 kg/m 2 . The ma<strong>in</strong><br />
f<strong>in</strong>d<strong>in</strong>g <strong>of</strong> this study is that submandibular sonography allows<br />
measurements <strong>of</strong> hyomental distance ratios and<br />
tongue volumes <strong>in</strong> obese patients (BMI 30.1–52.3 kg/m 2 ).<br />
Because <strong>of</strong> the <strong>in</strong>creased submandibular tissue mass <strong>in</strong><br />
these patients, measurements <strong>of</strong> the hyomental distance<br />
by palpation may be difficult or even impossible. Us<strong>in</strong>g a<br />
hard–plastic bond ruler, Huh et al 13 evaluated the predictive<br />
value <strong>of</strong> surface hyomental distance ratio measurements<br />
<strong>in</strong> 213 consecutive nonobese adult patients<br />
undergo<strong>in</strong>g elective surgery and anesthesia with tracheal<br />
<strong>in</strong>tubation. They analyzed various predictors alone and <strong>in</strong><br />
all comb<strong>in</strong>ations. The hyomental distance ratio alone had<br />
the highest predictive validity for difficult laryngoscopy<br />
with an optimal cut<strong>of</strong>f po<strong>in</strong>t <strong>of</strong> 1.2. At this cut<strong>of</strong>f po<strong>in</strong>t, the<br />
hyomental distance ratio had sensitivity <strong>of</strong> 88% and specificity<br />
<strong>of</strong> 60% for predict<strong>in</strong>g difficult laryngoscopy. Obese<br />
patients <strong>in</strong> our study were either difficult or easy to <strong>in</strong>tubate.<br />
The sonographic hyomental distance ratios <strong>in</strong> the difficult<br />
<strong>in</strong>tubation group were <strong>in</strong> the 1 to 1.05 range, and<br />
those <strong>in</strong> the easy <strong>in</strong>tubation group were <strong>in</strong> the 1.12 to 1.16<br />
range, consistent with the data <strong>of</strong> Huh et al. 13 The difference<br />
between the mean hyomental distance ratio values <strong>in</strong><br />
the two groups was highly statistically significant.<br />
S<strong>in</strong>gh et al 14 presented a comprehensive sonographic<br />
assessment <strong>of</strong> the suprahyoid and <strong>in</strong>frahyoid airways. In a<br />
recent study by Prasad et al, 15 the same group assessed<br />
agreement between computed tomography and sonography<br />
for visualization <strong>of</strong> airway structures. All airway measurements<br />
were closely related except for the hyomental<br />
distance. They suggested that <strong>in</strong> some patients, the presence<br />
<strong>of</strong> a “high-ly<strong>in</strong>g” or cephalad position <strong>of</strong> the hyoid<br />
bone may alter the structures visualized by the suprahyoid<br />
sonographic w<strong>in</strong>dow. It is also possible that the position <strong>of</strong><br />
the head and neck was slightly different dur<strong>in</strong>g both exam<strong>in</strong>ations,<br />
although a standard headrest was used dur<strong>in</strong>g<br />
the scans. Because the hyomental distance ratio is a ratio <strong>of</strong><br />
two l<strong>in</strong>ear distances, its accuracy should not change if both<br />
l<strong>in</strong>ear distances are affected to the same extent by altered<br />
sonographic structure visualization.<br />
The l<strong>in</strong>e <strong>of</strong> vision to the glottic open<strong>in</strong>g dur<strong>in</strong>g laryngoscopy<br />
is likely to be affected both by the size <strong>of</strong> the<br />
tongue and sufficient room <strong>in</strong> the mandibular space for the<br />
tongue to be displaced <strong>in</strong>to. 1,10 In this study, the tongue<br />
volumes were not very different between the difficult and<br />
easy <strong>in</strong>tubation groups. One <strong>of</strong> the reasons for the lack <strong>of</strong><br />
a significant difference could have been the small study size.<br />
It is also possible that the tongue volume can be a predictor<br />
<strong>of</strong> difficult <strong>in</strong>tubation only if expressed as a ratio <strong>of</strong> the<br />
available mandibular volume.<br />
Figure 5. Images from a 26-year-old female patient (first patient <strong>in</strong> Table<br />
1). Body mass <strong>in</strong>dex, 45.2; hyomental distance <strong>in</strong> the neutral position,<br />
60.7 mm; hyomental distance <strong>in</strong> the head-extended position, 69.5 mm;<br />
hyomental distance ratio, 1.14; midsagittal cross-sectional area, 24.9 cm 2<br />
(bottom left sonogram); tongue width, 5.3 cm (bottom right sonogram);<br />
tongue volume, 132 cm 3 ; muscle volume <strong>of</strong> the floor <strong>of</strong> the mouth, 24.7<br />
cm 3 ; Mallampati class, II; Cormack-Lehane grade, 1; easy <strong>in</strong>tubation. DG<br />
<strong>in</strong>dicates diglossus muscle; GH, geniohyoid muscle; H, hyoid bone; M,<br />
mandible; and MH, mylohyoid muscle.<br />
J <strong>Ultrasound</strong> Med 2012; 31:523–528 527
Wojtczak—<strong>Submandibular</strong> <strong>Sonography</strong><br />
In this study, 5 <strong>of</strong> 7 morbidly obese patients were easy<br />
to <strong>in</strong>tubate. Whether tracheal <strong>in</strong>tubation is more difficult <strong>in</strong><br />
obese patients is debatable. 1 Brodsky et al 16 studied 100<br />
consecutive patients with a BMI <strong>of</strong> greater than 40 kg/m 2<br />
and concluded that neither absolute body weight nor BMI<br />
is associated with <strong>in</strong>tubation difficulties. Rather, they found<br />
that a large neck circumference <strong>of</strong> 40 cm showed a 5%<br />
probability <strong>of</strong> problematic <strong>in</strong>tubation, and <strong>of</strong> a circumference<br />
<strong>of</strong> 60 cm showed a 35% probability. This observation<br />
was not confirmed by our study.<br />
In summary, this study shows that the hyomental distances<br />
<strong>in</strong> the neutral and head-extended positions, hyomental<br />
distance ratio, and volumes <strong>of</strong> the tongue and<br />
muscles <strong>of</strong> the floor <strong>of</strong> the mouth can be measured <strong>in</strong><br />
obese patients with a large neck circumference by perform<strong>in</strong>g<br />
a non<strong>in</strong>vasive submandibular sonographic exam<strong>in</strong>ation.<br />
Preoperative assessment <strong>of</strong> the hyomental<br />
distance ratio may predict difficult laryngoscopy result<strong>in</strong>g <strong>in</strong><br />
difficult <strong>in</strong>tubation.<br />
10. Mallampati SR. Cl<strong>in</strong>ical sign to predict difficult tracheal <strong>in</strong>tubation (hypothesis).<br />
Can Anaesth Soc J 1983; 30:316–317.<br />
11. Samsoon GLT, Young JRB. Difficult tracheal <strong>in</strong>tubation: a retrospective<br />
study. Anaesthesia 1987; 42:487–490.<br />
12. Cormack RS, Lehane J. Difficult tracheal <strong>in</strong>tubation <strong>in</strong> obstetrics. Anaesthesia<br />
1984; 39:1105–1111.<br />
13. Huh J, Sh<strong>in</strong> HY, Kim SH, Yoon TK, Kim DK. Diagnostic predictor <strong>of</strong><br />
difficult laryngoscopy: the hyomental distance ratio. Anesth Analg 2009;<br />
108:544–548.<br />
14. S<strong>in</strong>gh M, Ch<strong>in</strong> KJ, Chan VWS, Wong DT, Prasad GA, Yu E. Use <strong>of</strong><br />
sonography for airway assessment. J <strong>Ultrasound</strong> Med 2010; 29:79–85.<br />
15. Prasad A, Yu E, Wong DT, Karhanis R, Gullane P, Chan VWS. Comparison<br />
<strong>of</strong> sonography and computed tomography as imag<strong>in</strong>g tools for assessment<br />
<strong>of</strong> airway structures. J <strong>Ultrasound</strong> Med 2011; 30:965–972.<br />
16. Brodsky JB, Lemmens HJ, Brock-Utne JG, Vierra M, Saidman LJ. Morbid<br />
obesity and tracheal <strong>in</strong>tubation. Anesth Analg 2002; 94:732–736.<br />
References<br />
1. Ghatge S, Hagberg CA. Does the airway exam<strong>in</strong>ation predict difficult<br />
<strong>in</strong>tubation? In: Fleisher LA (ed). Evidence-Based Practice <strong>of</strong> Anesthesiology.<br />
Philadelphia, PA: WB Saunders Co; 2009:101–115.<br />
2. Ezri T, Gewurtz G, Sessler DI, et al. Prediction <strong>of</strong> difficult laryngoscopy <strong>in</strong><br />
obese patients by ultrasound quantification <strong>of</strong> anterior neck s<strong>of</strong>t tissue.<br />
Anaesthesia 2003; 58:1111–1114.<br />
3. Lakhal K, Deplace X, Cottier JP, et al. The feasibility <strong>of</strong> ultrasound to assess<br />
subglottic diameter. Anesth Analg 2007; 104:611–614.<br />
4. Sustić A. Role <strong>of</strong> ultrasound <strong>in</strong> the airway management <strong>of</strong> critically ill patients.<br />
Crit Care Med 2007; 35(suppl):S173–S177.<br />
5. Nichol HC, Zuck D. Difficult laryngoscopy: the “anterior” larynx and the<br />
atlanto-occipital gap. Br J Anaesth 1983; 55:141–143.<br />
6. Saw<strong>in</strong> PD, Todd MM, Traynelis VC et al. Cervical sp<strong>in</strong>e motion with direct<br />
laryngoscopy and orotracheal <strong>in</strong>tubation: an <strong>in</strong> vivo c<strong>in</strong>efluoroscopic<br />
study <strong>of</strong> subjects without cervical abnormality. Anesthesiology1996; 85:26–<br />
36.<br />
7. Takenaka I, Iwagaki T, Aoyama K, Ishimura H, Kadoya T. Preoperative<br />
evaluation <strong>of</strong> extension capacity <strong>of</strong> the occipitoatlantoaxial complex <strong>in</strong> patients<br />
with rheumatoid arthritis: comparison between the Bellhouse test<br />
and a new method, hyomental distance ratio. Anesthesiology 2006;<br />
104:680–685.<br />
8. Penn<strong>in</strong>g L. Radioanatomy <strong>of</strong> upper airways <strong>in</strong> flexion and retr<strong>of</strong>lexion <strong>of</strong><br />
the neck. Neuroradiology 1988; 30:17–21.<br />
9. Wojtczak J, Pennella-Vaughan J, Lucas S. Sonographic assessment <strong>of</strong> the<br />
tongue size: comparison <strong>of</strong> two-dimensional (2D), biplane (BP), and<br />
three-dimensional (3D) ultrasound (US) [abstract]. Anesthesiology2011;<br />
115(suppl):A1044.<br />
528<br />
J <strong>Ultrasound</strong> Med 2012; 31:523–528