MAKETA 5/2 po
MAKETA 5/2 po
MAKETA 5/2 po

Create successful ePaper yourself
Turn your PDF publications into a flip-book with our unique Google optimized e-Paper software.
A C T A M E D I C A M A R T I N I A N A 2 0 0 5 5/2 11<br />
Protocol<br />
The length of R-R intervals was measured using telemetric system (VariaCardio TF4, Sima<br />
Media, Olomouc, Czech Republic) where ECG signal (sampling freqency 1000 Hz) from thoracic<br />
belt with integrated electrodes was transferred into PC for further analysis. Systolic blood pressure<br />
(SBP) was monitored beat-to-beat using volume-clamp method (23) by Finapres 2300<br />
(Ohmeda, USA). The finger cuff of appropriate size was wrapped around middle phalanx of the<br />
third finger of the left hand. The finger was passively maintained at the heart level to avoid blood<br />
pressure distortion caused by hydrostatic pressure changes. Analog output of the Finapres was<br />
transferred into PC by analog-digital convertor PCL-711 (Advantech Co., Taiwan) with the sampling<br />
frequency of 500 Hz. The SBP values were obtained on-line using specially developed software<br />
and stored in PC for subsequent analysis.<br />
All subjects were investigated in quiet room from 7.30 to 12.00 a.m. The thoracic belt with<br />
ECG electrodes and finger cuff of Finapres device were applied after 10 minutes in sitting <strong>po</strong>sition.<br />
Then, the subject was in supine <strong>po</strong>sition on the bed during next 70 minutes of the continuous<br />
recording of the cardiovascular parameters. We have asked the probands to avoid voluntary<br />
movements and speaking as much as <strong>po</strong>ssible.<br />
Data analysis<br />
HRV and BPV analysis was performed off-line in selected interval (interval started 30 min<br />
after reclining, the length of interval was 600 s) of the records using special software.<br />
In analysed time interval we quantified several basic time domain HRV and BPV parameters:<br />
mean R-R interval duration (mean RR), standard deviation of the R-R intervals (SDRR), mean<br />
SBP and standard deviation of SBP values (SDSBP).<br />
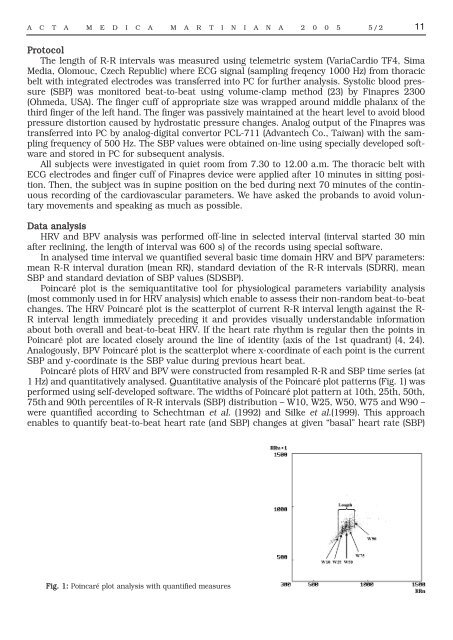
Poincaré plot is the semiquantitative tool for physiological parameters variability analysis<br />
(most commonly used in for HRV analysis) which enable to assess their non-random beat-to-beat<br />
changes. The HRV Poincaré plot is the scatterplot of current R-R interval length against the R-<br />
R interval length immediately preceding it and provides visually understandable information<br />
about both overall and beat-to-beat HRV. If the heart rate rhythm is regular then the <strong>po</strong>ints in<br />
Poincaré plot are located closely around the line of identity (axis of the 1st quadrant) (4, 24).<br />
Analogously, BPV Poincaré plot is the scatterplot where x-coordinate of each <strong>po</strong>int is the current<br />
SBP and y-coordinate is the SBP value during previous heart beat.<br />
Poincaré plots of HRV and BPV were constructed from resampled R-R and SBP time series (at<br />
1 Hz) and quantitatively analysed. Quantitative analysis of the Poincaré plot patterns (Fig. 1) was<br />
performed using self-developed software. The widths of Poincaré plot pattern at 10th, 25th, 50th,<br />
75th and 90th percentiles of R-R intervals (SBP) distribution – W10, W25, W50, W75 and W90 –<br />
were quantified according to Schechtman et al. (1992) and Silke et al.(1999). This approach<br />
enables to quantify beat-to-beat heart rate (and SBP) changes at given “basal” heart rate (SBP)<br />
Fig. 1: Poincaré plot analysis with quantified measures