Agenda Item - East Sussex County Council
Agenda Item - East Sussex County Council
Agenda Item - East Sussex County Council

Create successful ePaper yourself
Turn your PDF publications into a flip-book with our unique Google optimized e-Paper software.
Caribbean<br />
Appendix 1<br />
Black/Black<br />
British - African<br />
1 0.1% 1 0.1% 6 0.3% 6 0.4%<br />
Any other Black<br />
background<br />
1 0.1% 6 0.4% 14 0.7% 12 0.8%<br />
Chinese 1 0.1% 2 0.1% 3 0.1% 0 0.0%<br />
Any other ethnic<br />
group<br />
9 0.8% 12 0.8% 12 0.6% 5 0.3%<br />
Refused 35 3.2% 76 4.8% 90 4.3% 66 4.4%<br />
Information not<br />
yet obtained<br />
26 2.4% 78 4.9% 65 3.1% 46 3.1%<br />
Totals 1104 100% 1581 100% 2117 100% 1494 100.0%<br />
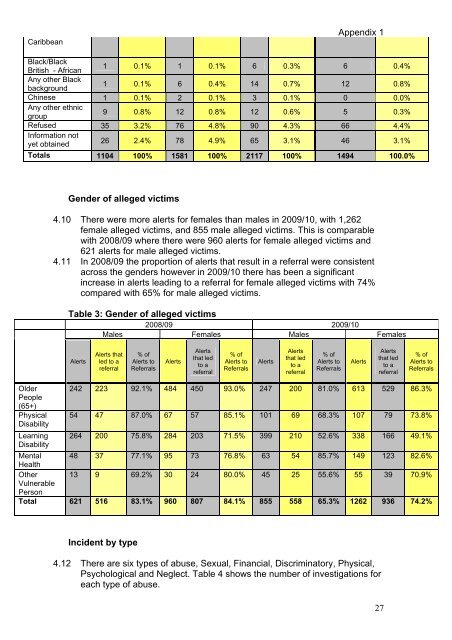
Gender of alleged victims<br />
4.10 There were more alerts for females than males in 2009/10, with 1,262<br />
female alleged victims, and 855 male alleged victims. This is comparable<br />
with 2008/09 where there were 960 alerts for female alleged victims and<br />
621 alerts for male alleged victims.<br />
4.11 In 2008/09 the proportion of alerts that result in a referral were consistent<br />
across the genders however in 2009/10 there has been a significant<br />
increase in alerts leading to a referral for female alleged victims with 74%<br />
compared with 65% for male alleged victims.<br />
Table 3: Gender of alleged victims<br />
2008/09 2009/10<br />
Males Females Males Females<br />
Alerts<br />
Alerts that<br />
led to a<br />
referral<br />
% of<br />
Alerts to<br />
Referrals<br />
Alerts<br />
Alerts<br />
that led<br />
to a<br />
referral<br />
% of<br />
Alerts to<br />
Referrals<br />
Alerts<br />
Alerts<br />
that led<br />
to a<br />
referral<br />
% of<br />
Alerts to<br />
Referrals<br />
Alerts<br />
Alerts<br />
that led<br />
to a<br />
referral<br />
% of<br />
Alerts to<br />
Referrals<br />
Older 242 223 92.1% 484 450 93.0% 247 200 81.0% 613 529 86.3%<br />
People<br />
(65+)<br />
Physical 54 47 87.0% 67 57 85.1% 101 69 68.3% 107 79 73.8%<br />
Disability<br />
Learning 264 200 75.8% 284 203 71.5% 399 210 52.6% 338 166 49.1%<br />
Disability<br />
Mental 48 37 77.1% 95 73 76.8% 63 54 85.7% 149 123 82.6%<br />
Health<br />
Other 13 9 69.2% 30 24 80.0% 45 25 55.6% 55 39 70.9%<br />
Vulnerable<br />
Person<br />
Total 621 516 83.1% 960 807 84.1% 855 558 65.3% 1262 936 74.2%<br />
Incident by type<br />
4.12 There are six types of abuse, Sexual, Financial, Discriminatory, Physical,<br />
Psychological and Neglect. Table 4 shows the number of investigations for<br />
each type of abuse.<br />
27