An Analysis of Government Revenue and Expenditure in ... - TARA
An Analysis of Government Revenue and Expenditure in ... - TARA
An Analysis of Government Revenue and Expenditure in ... - TARA
You also want an ePaper? Increase the reach of your titles
YUMPU automatically turns print PDFs into web optimized ePapers that Google loves.
145<br />
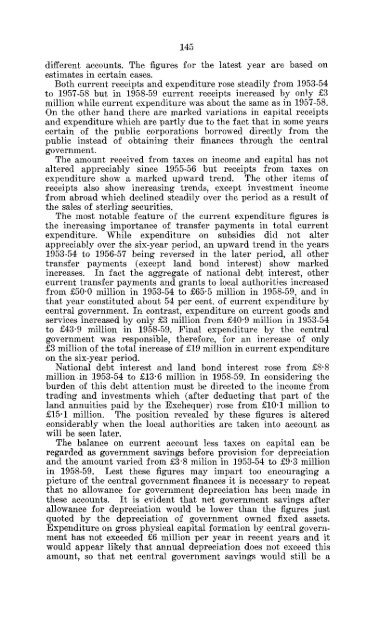
different accounts. The figures for the latest year are based on<br />
estimates <strong>in</strong> certa<strong>in</strong> cases.<br />
Both current receipts <strong>and</strong> expenditure rose steadily from 1953-54<br />
to 1957-58 but <strong>in</strong> 1958-59 current receipts <strong>in</strong>creased by only £3<br />
million while current expenditure was about the same as <strong>in</strong> 1957-58.<br />
On the other h<strong>and</strong> there are marked variations <strong>in</strong> capital receipts<br />
<strong>and</strong> expenditure which are partly due to the fact that <strong>in</strong> some years<br />
certa<strong>in</strong> <strong>of</strong> the public corporations borrowed directly from the<br />
public <strong>in</strong>stead <strong>of</strong> obta<strong>in</strong><strong>in</strong>g their f<strong>in</strong>ances through the central<br />
government.<br />
The amount received from taxes on <strong>in</strong>come <strong>and</strong> capital has not<br />
altered appreciably s<strong>in</strong>ce 1955-56 but receipts from taxes on<br />
expenditure show a marked upward trend. The other items <strong>of</strong><br />
receipts also show <strong>in</strong>creas<strong>in</strong>g trends, except <strong>in</strong>vestment <strong>in</strong>come<br />
from abroad which decl<strong>in</strong>ed steadily over the period as a result <strong>of</strong><br />
the sales <strong>of</strong> sterl<strong>in</strong>g securities.<br />
The most notable feature <strong>of</strong> the current expenditure figures is<br />
the <strong>in</strong>creas<strong>in</strong>g importance <strong>of</strong> transfer payments <strong>in</strong> total current<br />
expenditure. While expenditure on subsidies did not alter<br />
appreciably over the six-year period, an upward trend <strong>in</strong> the years<br />
1953-54 to 1956-57 be<strong>in</strong>g reversed <strong>in</strong> the later period, all other<br />
transfer payments (except l<strong>and</strong> bond <strong>in</strong>terest) show marked<br />
<strong>in</strong>creases. In fact the aggregate <strong>of</strong> national debt <strong>in</strong>terest, other<br />
current transfer payments <strong>and</strong> grants to local authorities <strong>in</strong>creased<br />
from £50-0 million <strong>in</strong> 1953-54 to £65-5 million <strong>in</strong> 1958-59, <strong>and</strong> <strong>in</strong><br />
that year constituted about 54 per cent, <strong>of</strong> current expenditure by<br />
central government. In contrast, expenditure on current goods <strong>and</strong><br />
services <strong>in</strong>creased by only £3 million from £40*9 million <strong>in</strong> 1953-54<br />
to £43-9 million <strong>in</strong> 1958-59. F<strong>in</strong>al expenditure by the central<br />
government was responsible, therefore, for an <strong>in</strong>crease <strong>of</strong> only<br />
£3 million <strong>of</strong> the total <strong>in</strong>crease <strong>of</strong> £19 million <strong>in</strong> current expenditure<br />
on the six-year period.<br />
National debt <strong>in</strong>terest <strong>and</strong> l<strong>and</strong> bond <strong>in</strong>terest rose from £8-8<br />
million <strong>in</strong> 1953-54 to £13*6 million <strong>in</strong> 1958-59. In consider<strong>in</strong>g the<br />
burden <strong>of</strong> this debt attention must be directed to the <strong>in</strong>come from<br />
trad<strong>in</strong>g <strong>and</strong> <strong>in</strong>vestments which (after deduct<strong>in</strong>g that part <strong>of</strong> the<br />
l<strong>and</strong> annuities paid by the Exchequer) rose from £10-1 million to<br />
£15*1 million. The position revealed by these figures is altered<br />
considerably when the local authorities are taken <strong>in</strong>to account as<br />
will be seen later.<br />
The balance on current account less taxes on capital can be<br />
regarded as government sav<strong>in</strong>gs before provision for depreciation<br />
<strong>and</strong> the amount varied from £3*8 milion <strong>in</strong> 1953-54 to £9-3 million<br />
<strong>in</strong> 1958-59. Lest these figures may impart too encourag<strong>in</strong>g a<br />
picture <strong>of</strong> the central government f<strong>in</strong>ances it is necessary to repeat<br />
that no allowance for government depreciation has been made <strong>in</strong><br />
these accounts. It is evident that net government sav<strong>in</strong>gs after<br />
allowance for depreciation would be lower than the figures just<br />
quoted by the depreciation <strong>of</strong> government owned fixed assets.<br />
<strong>Expenditure</strong> on gross physical capital formation by central government<br />
has not exceeded £6 million per year <strong>in</strong> recent years <strong>and</strong> it<br />
would appear likely that annual depreciation does not exceed this<br />
amount, so that net central government sav<strong>in</strong>gs would still be a


