From vision to decision Pharma 2020 - pwc
From vision to decision Pharma 2020 - pwc
From vision to decision Pharma 2020 - pwc

Create successful ePaper yourself
Turn your PDF publications into a flip-book with our unique Google optimized e-Paper software.
Portfolio management:<br />
Choosing the best jam<br />
“If you must play, decide on three things at the start: the<br />
rules of the game, the stakes and when it’s time <strong>to</strong> quit.”<br />
Chinese proverb<br />
Flummoxed by all<br />
the flavours<br />
In 1995, social scientist Sheena Iyengar<br />
set up a tasting booth in a US food s<strong>to</strong>re<br />
and pretended <strong>to</strong> be a supplier of<br />
gourmet jams. Every few hours, she<br />
switched between a selection of six<br />
flavours and 24. On average, cus<strong>to</strong>mers<br />
tasted two flavours, regardless of the<br />
size of the assortment.<br />
Now here’s the nub. Only 40% of<br />
cus<strong>to</strong>mers were drawn <strong>to</strong> the small<br />
selection, whereas 60% s<strong>to</strong>pped by the<br />
large one. But 30% of those who’d been<br />
given a choice of six flavours purchased<br />
a jar of jam, while only 3% of those<br />
who’d been given a choice of 24 flavours<br />
did so. Confronted with two dozen<br />
samples, most people were paralysed<br />
by in<strong>decision</strong>. 170<br />
Choosing which drug candidates <strong>to</strong><br />
progress through the pipeline is far more<br />
difficult than choosing which kind of<br />
jam <strong>to</strong> buy, and a lot more rests on the<br />
choice. Yet many pharma companies are<br />
behaving like the cus<strong>to</strong>mers in that food<br />
s<strong>to</strong>re – with one major difference. Rather<br />
than walking away without purchasing<br />
anything, they’re buying a jar of jam in<br />
every flavour.<br />
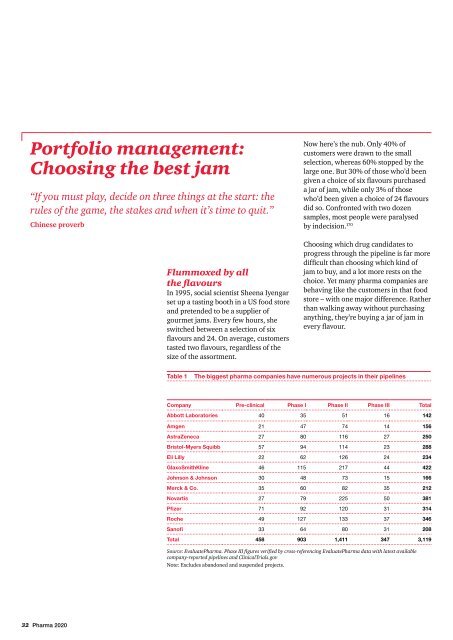
Table 1<br />
The biggest pharma companies have numerous projects in their pipelines<br />
Company Pre-clinical Phase I Phase II Phase III Total<br />
Abbott Labora<strong>to</strong>ries 40 35 51 16 142<br />
Amgen 21 47 74 14 156<br />
AstraZeneca 27 80 116 27 250<br />
Bris<strong>to</strong>l-Myers Squibb 57 94 114 23 288<br />
Eli Lilly 22 62 126 24 234<br />
GlaxoSmithKline 46 115 217 44 422<br />
Johnson & Johnson 30 48 73 15 166<br />
Merck & Co. 35 60 82 35 212<br />
Novartis 27 79 225 50 381<br />
Pfizer 71 92 120 31 314<br />
Roche 49 127 133 37 346<br />
Sanofi 33 64 80 31 208<br />
Total 458 903 1,411 347 3,119<br />
Source: Evaluate<strong>Pharma</strong>. Phase III figures verified by cross-referencing Evaluate<strong>Pharma</strong> data with latest available<br />
company-reported pipelines and ClinicalTrials.gov<br />
Note: Excludes abandoned and suspended projects.<br />
32 <strong>Pharma</strong> <strong>2020</strong>