Vol.1 Business Analytics Utilizing Big Data(PDF: 4Pages ... - NTT Data
Vol.1 Business Analytics Utilizing Big Data(PDF: 4Pages ... - NTT Data
Vol.1 Business Analytics Utilizing Big Data(PDF: 4Pages ... - NTT Data

Create successful ePaper yourself
Turn your PDF publications into a flip-book with our unique Google optimized e-Paper software.
<strong>NTT</strong> DATA Technology Foresights 2012<br />
<strong>Business</strong> <strong>Analytics</strong> <strong>Utilizing</strong> <strong>Big</strong> <strong>Data</strong><br />
Every two years, the amount of data in the world doubles, and by 2015, it is estimated that the total data on Earth will<br />
amount to 7.9 zettabytes. Unstructured data, such as text and images accounts for 90% of this amount. From here on, it is<br />
highly anticipated that this massive amount of data will be used in business analytics to improve operations and offer<br />
innovative services. This document will introduce business analytics that use big data and the technological trends surrounding<br />
it, as well as <strong>NTT</strong> DATA’s approach.<br />
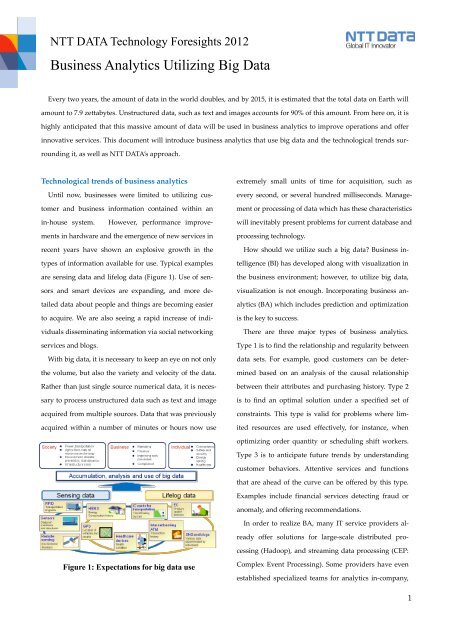
Technological trends of business analytics<br />
Until now, businesses were limited to utilizing customer<br />
and business information contained within an<br />
extremely small units of time for acquisition, such as<br />
every second, or several hundred milliseconds. Management<br />
or processing of data which has these characteristics<br />
in-house system.<br />
will inevitably present problems for current database and<br />
However, performance improvements<br />
in hardware and the emergence of new services in<br />
recent years have shown an explosive growth in the<br />
types of information available for use. Typical examples<br />
are sensing data and lifelog data (Figure 1). Use of sensors<br />
and smart devices are expanding, and more detailed<br />
data about people and things are becoming easier<br />
to acquire. We are also seeing a rapid increase of individuals<br />
disseminating information via social networking<br />
services and blogs.<br />
With big data, it is necessary to keep an eye on not only<br />
the volume, but also the variety and velocity of the data.<br />
Rather than just single source numerical data, it is necessary<br />
to process unstructured data such as text and image<br />
acquired from multiple sources. <strong>Data</strong> that was previously<br />
acquired within a number of minutes or hours now use<br />
processing technology.<br />
How should we utilize such a big data? <strong>Business</strong> intelligence<br />
(BI) has developed along with visualization in<br />
the business environment; however, to utilize big data,<br />
visualization is not enough. Incorporating business analytics<br />
(BA) which includes prediction and optimization<br />
is the key to success.<br />
There are three major types of business analytics.<br />
Type 1 is to find the relationship and regularity between<br />
data sets. For example, good customers can be determined<br />
based on an analysis of the causal relationship<br />
between their attributes and purchasing history. Type 2<br />
is to find an optimal solution under a specified set of<br />
constraints. This type is valid for problems where limited<br />
resources are used effectively, for instance, when<br />
optimizing order quantity or scheduling shift workers.<br />
Type 3 is to anticipate future trends by understanding<br />
customer behaviors. Attentive services and functions<br />
that are ahead of the curve can be offered by this type.<br />
Examples include financial services detecting fraud or<br />
anomaly, and offering recommendations.<br />
In order to realize BA, many IT service providers already<br />
offer solutions for large-scale distributed processing<br />
(Hadoop), and streaming data processing (CEP:<br />
Figure 1: Expectations for big data use<br />
Complex Event Processing). Some providers have even<br />
established specialized teams for analytics in-company,<br />
1
and continue to advance in these types of activities.<br />
assist with identifying revolutionary changes and other<br />
important social incidents. Although it is currently in<br />
Advancements in technology<br />
How far is big data and business analytics related<br />
the research stage, it may help prevent terrorism and<br />
large-scale crimes in the near future.<br />
technology actually advancing? We believe that the advancement<br />
in the axis of growth and diversity of information<br />
(big data aspects), and axis of analytic sophistication<br />
(analytic aspects), are each progressing (Figure 2).<br />
Use and analysis of large amounts of numerical data<br />
from sensors continue to progress. From here on, in aspects<br />
of big data, progression of diversified data such as<br />
unstructured data will lead toward data fusion where<br />
data is fused from multiple sources. For example, in the<br />
field of transportation, there is currently an effort to<br />
integrate traffic information as text expressions, and<br />
weather information as graphical expressions to analyze<br />
traffic congestion. The important technical point is how<br />
to supplement and overlay data which differ in spatial<br />
granularity and acquired timing.<br />
From an analytical aspect, analytical technology for<br />
diverse data continues to progress, leading toward even<br />
more accurate future predictions and control of the real<br />
world. For example, a retailer anticipates demand based<br />
on sales, and by automatically calculating the appropriate<br />
order for number of products, the retailer determines<br />
the actual order amount. For retailers, the need for optimization<br />
of order amount is large because opportunity<br />
loss resulting from inventory shortages and excess inventory<br />
is a risk too large to be ignored.<br />
Five to ten years down the line, with an integration of<br />
these technologies, comprehensive decision making,<br />
which currently only possible for humans, will partially<br />
be done by machines. A predecessor to this is the Open<br />
Source Indicators project at Intelligence Advanced Research<br />
Projects Activity (IARPA) of the U.S. Department<br />
of Defense. This initiative uses Twitter posts, search engine<br />
queries, and street corner surveillance webcams,<br />
integrating all kinds of data for automatic analysis to<br />
Figure 2: Steps in advancement<br />
<strong>NTT</strong> DATA’s approach<br />
At <strong>NTT</strong> DATA, we perceive the extensive use of big<br />
data as an extension of business intelligence.<br />
Traditional business intelligence was based on aggregate<br />
analysis, and stopped at the point of visualization.<br />
However, visualization alone has limits to how high a<br />
degree of knowledge can be derived from data. <strong>NTT</strong><br />
DATA perceives a wider application of business intelligence<br />
including visualization and business analytics,<br />
and categorizes BI into four categories based on our data<br />
analysis consulting experience in various fields of business.<br />
Aggregate Analysis BI immediately aggregates and<br />
analyzes all data. Discovery BI analyzes variations to<br />
match data granularity and discovers rules. WHAT-IF BI<br />
uses simulations and searches for optimal solutions to<br />
optimize business operations. And Proactive BI analyzes<br />
data in real time to offer future services that are ahead of<br />
the curve. Of these abovementioned categories, Discovery<br />
BI, WHAT-IF BI, and Proactive BI are analogs of<br />
business analytics, and these are equivalent to the previously<br />
described Type 1, Type2, and Type 3, respectively.<br />
At <strong>NTT</strong> DATA, the data analysis methodology<br />
2
Table 1: Types of analysis scenarios<br />
related to business analytics<br />
tailed in a separate document.)<br />
(2) Optimized supply chain management for CPFR<br />
[Prediction and control]<br />
CPFR (Collaborative Planning, Forecasting, and Replenishment)<br />
is a cooperative initiative between manufacturers<br />
and retailers to create sales plans, prevent defects,<br />
and reduce inventory. This effort attempts to<br />
predict demand for products over the short term, and<br />
mid/long term, and then create an ordering model based<br />
BICLAVIS ® has been developed around the axis of the<br />
previously mentioned four classes. At the core of this<br />
lies analysis scenarios classified into analysis patterns by<br />
objective (Table 1). Based on these scenarios, <strong>NTT</strong> DATA<br />
uses a template for efficient analysis.<br />
At the <strong>Data</strong> Warehouse/<strong>Business</strong> Intelligence Lab ® ,<br />
initial process assistance is offered in the form of support<br />
in proof-of-concept design and selecting tools for<br />
core products, and development of demo systems tailored<br />
to customer requirements.<br />
Global initiatives are also gaining speed. In addition<br />
to efforts to provide high-level ITS in Asia, and efforts<br />
toward a smart community in Europe, a large amount of<br />
knowledge is concentrated in the BI Global One Team<br />
consisting of the Europe/Americas and Asian <strong>NTT</strong> DA-<br />
TA group companies. In this way, we are able to offer<br />
full support business analytics services to customers<br />
with locations around the globe.<br />
Examples of initiatives<br />
This section will introduce some examples of <strong>NTT</strong><br />
DATA initiatives.<br />
(1) Bridge monitoring [Anomaly Detection]<br />
Bridge deterioration detection involves large maintenance<br />
costs. We have built a demonstration system to<br />
detect anomalies denoting distortion in the sent data<br />
from installed sensors on a bridge. (This test case is de-<br />
on that information (how much to order at what timing).<br />
Additionally, to evaluate the effectiveness of this effort,<br />
simulations are used that include realistic constraints<br />
such as defective items and delivery dates. Usually, real<br />
changes in inventory ordering formats involve great risk,<br />
and pre-evaluation through simulations is of great value.<br />
<strong>NTT</strong> DATA already offers business services based on<br />
this method.<br />
(3) Shift scheduling for PO [Prediction and control]<br />
BPO (<strong>Business</strong> Process Outsourcing) involves outsourcing<br />
all but core aspects of a business, radically revising<br />
business processes and resources. For this initiative,<br />
we execute shift scheduling for offices that process<br />
multiple types of duties, along with estimating work<br />
volume of each task, considering the necessary time<br />
limit for completing a task, as well as the personnel skill<br />
needed, and other real constraints in the workplace.<br />
With this system, we can automatically generate an optimum<br />
schedule, maximizing BPO effectiveness.<br />
(4) Medical cost reduction policy for health insurance<br />
organizations [Targeting]<br />
The increase in insured persons who become seriously<br />
ill due to lifestyle diseases has caused a problem in increased<br />
costs for health insurance organizations. From<br />
insured persons’ current state of health, we identified<br />
who are at high risk for serious diseases and gave health<br />
3
counseling at an early stage to prevent such increase<br />
cost. By looking at past insurance claims, data mining<br />
can help identify patterns that lead toward lifestyle diseases<br />
or complications, allowing organizations to make<br />
a list of high-risk patients and to provide health counseling.<br />
The result can lead to prevention of health risks<br />
in insured persons, and curtailing extra costs for the<br />
health insurance organization overall.<br />
Future vision<br />
At the beginning of the paper, we pointed out the<br />
trend for business analytics advancement. These advancements<br />
will be made possible by progression of the<br />
previously described four types of business intelligence.<br />
<strong>NTT</strong> DATA is already undertaking efforts to realize<br />
comprehensive decision making in 5 to 10 years from<br />
now.<br />
Implementation architecture<br />
As architecture for business analytics utilizing big data,<br />
<strong>NTT</strong> DATA defines three layers (Figure 3). The first is<br />
big data infrastructure layer, which is an engine for<br />
processing ultra high amounts of data in diverse formats.<br />
Hadoop and in-memory databases serve as such platform<br />
solutions. The second layer is business analytics<br />
infrastructure, which is equal to libraries equipped with<br />
high-level data analysis functions and data mining<br />
packages. The third layer consists of analysis templates<br />
and applications to offer analysis templates for each task<br />
or field, and analysis scenarios tailored to each type.<br />
In addition to total support for each layer, <strong>NTT</strong> DATA<br />
puts extra effort into added value services particularly<br />
for the third layer. Using the previously-described BI-<br />
CLAVIS ® , we will accumulate knowledge in a wide variety<br />
of fields in order to offer even more sophisticated<br />
analytics services.<br />
For example, in the field of traffic control, by executing<br />
a large-scale, multi-agent simulation with data input<br />
from beacons, probe sensor data, and traffic information,<br />
we are researching ways to forecast traffic conditions,<br />
and control signals and lane usage.<br />
Additionally, in the field of marine transportation logistics,<br />
there are needs of anticipating specific marine<br />
areas that are unable to pass through due to incidents<br />
occurring throughout the world using predictive incident<br />
detection, and securing port slots for ships traveling<br />
numerous countries (Figure 4). Quickly identifying<br />
trends which could affect economic activity is becoming<br />
extremely important in order to avoid risks.<br />
<strong>Business</strong> analytics that utilize big data is the key<br />
technology that will be used to optimize business and<br />
society adjusting to the environmental change. <strong>NTT</strong><br />
DATA has a wealth of experience in analytics, and with<br />
its neutral stand toward IT infrastructure and tools,<br />
along with a strong global business intelligence solu-<br />
Analysis template, analysis AP<br />
<strong>NTT</strong> DATA’s <strong>Data</strong>’s own data analysis technique<br />
<strong>Business</strong> <strong>Business</strong> <strong>Analytics</strong> <strong>Analytics</strong> Infrastructure foundation<br />
Mathematical Systems Inc’s own analysis PKG group<br />
<strong>Big</strong> <strong>Big</strong> <strong>Data</strong> <strong>Data</strong> Infrastructure foundationIn-memory DB<br />
Hadoop<br />
DWH appliance<br />
CEP<br />
<strong>Data</strong> Warehouse/<strong>Business</strong> Intelligence Lab ®<br />
Services offered<br />
<strong>Big</strong> <strong>Data</strong> analysis<br />
consulting<br />
Xrosscloud<br />
(M2M (M2M PF PFservice)<br />
BizXaaS Biz XaaS<br />
(Cloud solutions)<br />
tions’ development and deployment capability, we are in<br />
an excellent position to provide a new type of reform<br />
through strategic use of information for our customers.<br />
Total support from the foundation to analysis<br />
Figure: 3 Implementation architecture<br />
Figure 4: Marine transportation logistics<br />
example<br />
4<br />
2012.10.18