Human development index - UMAR
Human development index - UMAR
Human development index - UMAR
You also want an ePaper? Increase the reach of your titles
YUMPU automatically turns print PDFs into web optimized ePapers that Google loves.
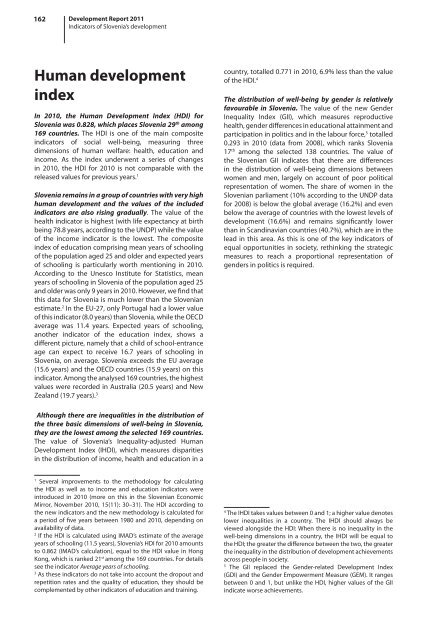
162 Development Report 2011<br />
Indicators of Slovenia’s <strong>development</strong><br />
<strong>Human</strong> <strong>development</strong><br />
<strong>index</strong><br />
In 2010, the <strong>Human</strong> Development Index (HDI) for<br />
Slovenia was 0.828, which places Slovenia 29 th among<br />
169 countries. The HDI is one of the main composite<br />
indicators of social well-being, measuring three<br />
dimensions of human welfare: health, education and<br />
income. As the <strong>index</strong> underwent a series of changes<br />
in 2010, the HDI for 2010 is not comparable with the<br />
released values for previous years. 1<br />
Slovenia remains in a group of countries with very high<br />
human <strong>development</strong> and the values of the included<br />
indicators are also rising gradually. The value of the<br />
health indicator is highest (with life expectancy at birth<br />
being 78.8 years, according to the UNDP) while the value<br />
of the income indicator is the lowest. The composite<br />
<strong>index</strong> of education comprising mean years of schooling<br />
of the population aged 25 and older and expected years<br />
of schooling is particularly worth mentioning in 2010.<br />
According to the Unesco Institute for Statistics, mean<br />
years of schooling in Slovenia of the population aged 25<br />
and older was only 9 years in 2010. However, we find that<br />
this data for Slovenia is much lower than the Slovenian<br />
estimate. 2 In the EU-27, only Portugal had a lower value<br />
of this indicator (8.0 years) than Slovenia, while the OECD<br />
average was 11.4 years. Expected years of schooling,<br />
another indicator of the education <strong>index</strong>, shows a<br />
different picture, namely that a child of school-entrance<br />
age can expect to receive 16.7 years of schooling in<br />
Slovenia, on average. Slovenia exceeds the EU average<br />
(15.6 years) and the OECD countries (15.9 years) on this<br />
indicator. Among the analysed 169 countries, the highest<br />
values were recorded in Australia (20.5 years) and New<br />
Zealand (19.7 years). 3<br />
country, totalled 0.771 in 2010, 6.9% less than the value<br />
of the HDI. 4<br />
The distribution of well-being by gender is relatively<br />
favourable in Slovenia. The value of the new Gender<br />
Inequality Index (GII), which measures reproductive<br />
health, gender differences in educational attainment and<br />
participation in politics and in the labour force, 5 totalled<br />
0.293 in 2010 (data from 2008), which ranks Slovenia<br />
17 th among the selected 138 countries. The value of<br />
the Slovenian GII indicates that there are differences<br />
in the distribution of well-being dimensions between<br />
women and men, largely on account of poor political<br />
representation of women. The share of women in the<br />
Slovenian parliament (10% according to the UNDP data<br />
for 2008) is below the global average (16.2%) and even<br />
below the average of countries with the lowest levels of<br />
<strong>development</strong> (16.6%) and remains significantly lower<br />
than in Scandinavian countries (40.7%), which are in the<br />
lead in this area. As this is one of the key indicators of<br />
equal opportunities in society, rethinking the strategic<br />
measures to reach a proportional representation of<br />
genders in politics is required.<br />
Although there are inequalities in the distribution of<br />
the three basic dimensions of well-being in Slovenia,<br />
they are the lowest among the selected 169 countries.<br />
The value of Slovenia’s Inequality-adjusted <strong>Human</strong><br />
Development Index (IHDI), which measures disparities<br />
in the distribution of income, health and education in a<br />
1<br />
Several improvements to the methodology for calculating<br />
the HDI as well as to income and education indicators were<br />
introduced in 2010 (more on this in the Slovenian Economic<br />
Mirror, November 2010, 15(11): 30–31). The HDI according to<br />
the new indicators and the new methodology is calculated for<br />
a period of five years between 1980 and 2010, depending on<br />
availability of data.<br />
2<br />
If the HDI is calculated using IMAD’s estimate of the average<br />
years of schooling (11.5 years), Slovenia’s HDI for 2010 amounts<br />
to 0.862 (IMAD’s calculation), equal to the HDI value in Hong<br />
Kong, which is ranked 21 st among the 169 countries. For details<br />
see the indicator Average years of schooling.<br />
3<br />
As these indicators do not take into account the dropout and<br />
repetition rates and the quality of education, they should be<br />
complemented by other indicators of education and training.<br />
4<br />
The IHDI takes values between 0 and 1; a higher value denotes<br />
lower inequalities in a country. The IHDI should always be<br />
viewed alongside the HDI: When there is no inequality in the<br />
well-being dimensions in a country, the IHDI will be equal to<br />
the HDI; the greater the difference between the two, the greater<br />
the inequality in the distribution of <strong>development</strong> achievements<br />
across people in society.<br />
5<br />
The GII replaced the Gender-related Development Index<br />
(GDI) and the Gender Empowerment Measure (GEM). It ranges<br />
between 0 and 1, but unlike the HDI, higher values of the GII<br />
indicate worse achievements.
Development Report 2011<br />
Indicators of Slovenia’s <strong>development</strong><br />
163<br />
Figure: The HDI and its components, Slovenia, 1970–2010<br />
1.0<br />
0.9<br />
HDI<br />
Education <strong>index</strong><br />
Income <strong>index</strong><br />
Health <strong>index</strong><br />
0.8<br />
0.7<br />
0.6<br />
1970<br />
1971<br />
1972<br />
1973<br />
1974<br />
1975<br />
1976<br />
1977<br />
1978<br />
1979<br />
1980<br />
1981<br />
1982<br />
1983<br />
1984<br />
1985<br />
1986<br />
1987<br />
1988<br />
1989<br />
1990<br />
1991<br />
1992<br />
1993<br />
1994<br />
1995<br />
1996<br />
1997<br />
1998<br />
1999<br />
2000<br />
2001<br />
2002<br />
2003<br />
2004<br />
2005<br />
2006<br />
2007<br />
2008<br />
2009<br />
2010<br />
Source: UNDP <strong>Human</strong> Development, 2010.<br />
Note: The <strong>index</strong> is calculated according to the new methodology from 2010 for the whole period based on the indicators from previous years (the income <strong>index</strong> is thus measured by<br />
GDP per capita in purchasing power parity terms in US dollars, the education <strong>index</strong> by the literacy rate and gross enrolment ratio at all three levels of education, and the health <strong>index</strong><br />
by life expectancy at birth). These values can, therefore, no longer be compared over time.


