Institutional Change in Old Industrial Areas – Lessons for ... - UMAR
Institutional Change in Old Industrial Areas – Lessons for ... - UMAR
Institutional Change in Old Industrial Areas – Lessons for ... - UMAR

You also want an ePaper? Increase the reach of your titles
YUMPU automatically turns print PDFs into web optimized ePapers that Google loves.
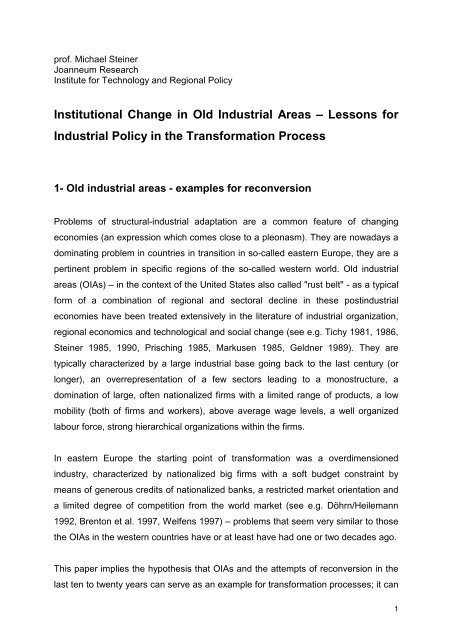
prof. Michael Ste<strong>in</strong>er<br />
Joanneum Research<br />
Institute <strong>for</strong> Technology and Regional Policy<br />
<strong>Institutional</strong> <strong>Change</strong> <strong>in</strong> <strong>Old</strong> <strong>Industrial</strong> <strong>Areas</strong> <strong>–</strong> <strong>Lessons</strong> <strong>for</strong><br />
<strong>Industrial</strong> Policy <strong>in</strong> the Trans<strong>for</strong>mation Process<br />
1- <strong>Old</strong> <strong>in</strong>dustrial areas - examples <strong>for</strong> reconversion<br />
Problems of structural-<strong>in</strong>dustrial adaptation are a common feature of chang<strong>in</strong>g<br />
economies (an expression which comes close to a pleonasm). They are nowadays a<br />
dom<strong>in</strong>at<strong>in</strong>g problem <strong>in</strong> countries <strong>in</strong> transition <strong>in</strong> so-called eastern Europe, they are a<br />
pert<strong>in</strong>ent problem <strong>in</strong> specific regions of the so-called western world. <strong>Old</strong> <strong>in</strong>dustrial<br />
areas (OIAs) <strong>–</strong> <strong>in</strong> the context of the United States also called "rust belt" - as a typical<br />
<strong>for</strong>m of a comb<strong>in</strong>ation of regional and sectoral decl<strong>in</strong>e <strong>in</strong> these post<strong>in</strong>dustrial<br />
economies have been treated extensively <strong>in</strong> the literature of <strong>in</strong>dustrial organization,<br />
regional economics and technological and social change (see e.g. Tichy 1981, 1986,<br />
Ste<strong>in</strong>er 1985, 1990, Prisch<strong>in</strong>g 1985, Markusen 1985, Geldner 1989). They are<br />
typically characterized by a large <strong>in</strong>dustrial base go<strong>in</strong>g back to the last century (or<br />
longer), an overrepresentation of a few sectors lead<strong>in</strong>g to a monostructure, a<br />
dom<strong>in</strong>ation of large, often nationalized firms with a limited range of products, a low<br />
mobility (both of firms and workers), above average wage levels, a well organized<br />
labour <strong>for</strong>ce, strong hierarchical organizations with<strong>in</strong> the firms.<br />
In eastern Europe the start<strong>in</strong>g po<strong>in</strong>t of trans<strong>for</strong>mation was a overdimensioned<br />
<strong>in</strong>dustry, characterized by nationalized big firms with a soft budget constra<strong>in</strong>t by<br />
means of generous credits of nationalized banks, a restricted market orientation and<br />
a limited degree of competition from the world market (see e.g. Döhrn/Heilemann<br />
1992, Brenton et al. 1997, Welfens 1997) <strong>–</strong> problems that seem very similar to those<br />
the OIAs <strong>in</strong> the western countries have or at least have had one or two decades ago.<br />
This paper implies the hypothesis that OIAs and the attempts of reconversion <strong>in</strong> the<br />
last ten to twenty years can serve as an example <strong>for</strong> trans<strong>for</strong>mation processes; it can<br />
1
also be regarded as an argument <strong>for</strong> countries <strong>in</strong> transition to strengthen their<br />
regional dimension of economic policy by establish<strong>in</strong>g new adm<strong>in</strong>istrative entities<br />
and to re<strong>in</strong><strong>for</strong>ce regional policy actions.<br />
OIAs <strong>in</strong> the West suggest that the geographical concentration of <strong>in</strong>dustrial sectors (<strong>in</strong><br />
quite various sectors rang<strong>in</strong>g from raw materials like coal and ore to textiles, car<br />
production, watches and furniture - to name but a few) can grow old and petrify<br />
under certa<strong>in</strong> conditions: these areas tend to become <strong>in</strong>flexible, and <strong>in</strong> the worst<br />
cases, unable to adapt to a new environment. Different theoretical answers (not quite<br />
<strong>in</strong>compatible) have been given why this happens, why OIAs cannot adapt to new<br />
conditions; why they cannot develop new products, why they cannot adapt their<br />
skills; why their old specialisation cannot meet demand any more. In this sense they<br />
can serve as examples why and how market processes under certa<strong>in</strong> conditions are<br />
not capable to prevent ag<strong>in</strong>g and petrification.<br />
This calls <strong>for</strong> a design of policy strategies and <strong>in</strong>struments. Economists who strongly<br />
believe <strong>in</strong> the allocative power of markets may object to this (<strong>in</strong> their view) misplaced<br />
task of policy. Yet history has proven that rejuvenat<strong>in</strong>g OIAs is possible and that this<br />
process of rejuvenation was def<strong>in</strong>itely (and positively) <strong>in</strong>fluenced by policy. Economic<br />
policy was necessary and <strong>in</strong> many cases successful - not <strong>in</strong> the <strong>for</strong>m of subsidies<br />
and public ownership, but by:<br />
• improv<strong>in</strong>g <strong>in</strong>frastructure,<br />
• creat<strong>in</strong>g access to various k<strong>in</strong>ds of <strong>in</strong><strong>for</strong>mation,<br />
• a differentiated <strong>for</strong>m of social policy,<br />
• the support of new firm creation,<br />
• deregulation,<br />
• an <strong>in</strong>duced change of mentality.<br />
All <strong>in</strong> all, it was a well designed change of an <strong>in</strong>stitutional framework with new<br />
<strong>in</strong>centive structures. It is <strong>in</strong> this sense that OIAs and regional and<br />
<strong>in</strong>dustrial/technology policy oriented towards them can serve as an example <strong>for</strong><br />
processes of trans<strong>for</strong>mation - this policy with ist strategies and <strong>in</strong>struments should be<br />
2
<strong>in</strong>terpreted as creat<strong>in</strong>g accommodat<strong>in</strong>g <strong>in</strong>stitutions <strong>for</strong> change <strong>in</strong> times of <strong>in</strong>sufficient<br />
<strong>in</strong>centives <strong>for</strong> endogenous improvement.<br />
In the follow<strong>in</strong>g theoretical <strong>in</strong>terpretations <strong>for</strong> reasons of stagnation <strong>in</strong> OIAs <strong>in</strong> the<br />
western economies will be given, then empirical assessments to characterize OIAs<br />
will be made taken as an example the northern part of Styria/Austria, po<strong>in</strong>t<strong>in</strong>g to<br />
<strong>in</strong>dicators of stagnation but also to subsequent accommodated change, then policy<br />
measures and <strong>in</strong>struments used <strong>for</strong> conversion will be listed and f<strong>in</strong>ally some<br />
conclusions concern<strong>in</strong>g the strategy of policy <strong>in</strong>duced change and the<br />
appropriateness of these experience <strong>for</strong> countries <strong>in</strong> transition will be drawn.<br />
3
2- Theoretical foundations to expla<strong>in</strong> the chang<strong>in</strong>g <strong>for</strong>tunes of OIAs<br />
A first and necessary first step of theory based knowledge creation consisted <strong>in</strong> the<br />
important <strong>in</strong>sight that the problems of these areas were specific <strong>in</strong> k<strong>in</strong>d and not just a<br />
transient feature of general economic development accidentally scattered <strong>in</strong> space.<br />
And <strong>for</strong> a while is was disputed that OIAs are a special type of problem regions.<br />
Some of the presumed characteristics were to be seen <strong>in</strong> other regions too as s<strong>in</strong>gle<br />
factors: concentration of specific sectors (e.g. agriculture, tourism), a small number<br />
of big firms (which sometimes also happens <strong>in</strong> urban agglomerations), a small<br />
portion of a qualified service sector.<br />
The fact that the term "OIA" was up to the mid80s disputed may be traced to the fact<br />
that up to then it was a dom<strong>in</strong>at<strong>in</strong>g concern of (regional) economists to expla<strong>in</strong><br />
regional disparities and to recommend policy measures to prevent or at least to<br />
attenuate them. Frequently, attention has been paid to parts of a national economy<br />
which were considered as "structurally weak", "decl<strong>in</strong><strong>in</strong>g", "areas of economic stress"<br />
without analys<strong>in</strong>g <strong>in</strong> detail the specific <strong>for</strong>m of disparity. Another reason <strong>for</strong> the<br />
difficulty <strong>in</strong> def<strong>in</strong><strong>in</strong>g the specific character of OIAs rested <strong>in</strong> the (up to then) <strong>in</strong>ability<br />
of growth theories to expla<strong>in</strong> the "turn<strong>in</strong>g po<strong>in</strong>t" <strong>in</strong> the development of (regional)<br />
economies: OIAs were <strong>for</strong>merly prosperous, rich economies the dynamics of which<br />
have been lost and the <strong>in</strong>come and standard of liv<strong>in</strong>g of which are <strong>in</strong> decl<strong>in</strong>e. Growth<br />
models usually only put <strong>for</strong>ward one direction of development and put emphasis on<br />
one element of stagnation (an early exception was Olson 1982 who put <strong>for</strong>ward an<br />
explanation <strong>for</strong> the rise and decl<strong>in</strong>e of nations).<br />
Yet at the beg<strong>in</strong>n<strong>in</strong>g of the 80s several explanations were put <strong>for</strong>ward that focussed<br />
on some of the specificities of these areas and tried to expla<strong>in</strong> their chang<strong>in</strong>g (and<br />
decl<strong>in</strong><strong>in</strong>g) <strong>for</strong>tunes.<br />
a)The "structural" approach tried to expla<strong>in</strong> the decl<strong>in</strong>e <strong>in</strong> terms of the composition of<br />
its sectors. Indeed it was very tempt<strong>in</strong>g to expla<strong>in</strong> the decl<strong>in</strong>e <strong>in</strong> terms of "structure"<br />
particularly if the economy of the unit under scrut<strong>in</strong>y is characterized by<br />
monostructure.<br />
4
Yet this approach <strong>–</strong> beside the vagueness of the term (<strong>for</strong> an eloquent criticism see<br />
already Machlup 1958) <strong>–</strong> suffered from two essential shortcom<strong>in</strong>gs: The first is the<br />
rather weak theoretical content; <strong>in</strong> rudimentary structural theory the change <strong>in</strong> the<br />
proportion of sectors and <strong>in</strong>dustries is regarded as a result of economic<br />
development. If we consider the contribution of such theories to the study of growth,<br />
they do not give any clear causal <strong>in</strong><strong>for</strong>mation but put <strong>for</strong>ward an <strong>in</strong>terdependent<br />
process of structural change and economic growth. They also left open the question<br />
of how to def<strong>in</strong>e a "desirable" structure. This was the core of the debate on balanced<br />
or imbalanced growth were the one position <strong>–</strong> <strong>in</strong> the tradition of Hirschman (1958) <strong>–</strong><br />
regards imbalances and deviations of a balanced growth path as advantegeous, and<br />
the other <strong>–</strong> follow<strong>in</strong>g Chenery (1960, 1969) and Kuznets (1958) <strong>–</strong> argu<strong>in</strong>g <strong>for</strong> the<br />
necessary adjustment to a spatially and temporally <strong>in</strong>variant growth path (socalled<br />
"normal patterns of growth").<br />
These theories, especially the (various) versions of shift-share analysis, cannot be<br />
regarded as a causal clarification of the connection between a given structure and<br />
result<strong>in</strong>g growth <strong>–</strong> they are ex post rationalizations of deviations of regional growth<br />
rates from national growth rates. The second shortcom<strong>in</strong>g is that the countless<br />
studies undertaken were unable to show the dom<strong>in</strong>ant <strong>in</strong>fluence of the structural<br />
component 1 . This is not to suggest that the "structural" explanation must be<br />
dismissed completely. After all, <strong>in</strong> most studies, approximately half of the growth<br />
differential is expla<strong>in</strong>ed by the structure. In addition, the attempt to def<strong>in</strong>e the<br />
problems of OIAs <strong>in</strong> terms of the structural composition of their <strong>in</strong>dustry may be the<br />
start<strong>in</strong>g po<strong>in</strong>t <strong>for</strong> an analysis and may lead to further considerataions which go<br />
beyond the purely compositional aspect of structure: Ch<strong>in</strong>itz (1961) made the<br />
important po<strong>in</strong>t that a particular structure can have a negative <strong>in</strong>fluence on important<br />
characteristics of the supply side, such as entrepreneurial behaviour, accessibility to<br />
capital, high waves, level of skill of the work <strong>for</strong>ce, environmental conditions etc. All<br />
this means, however, is that the decl<strong>in</strong>e of OIAs cannot be expla<strong>in</strong>ed exclusively <strong>in</strong><br />
terms of structure <strong>in</strong> the traditional sense of sectoral compositions.<br />
1 The weak explanatory content of "structural" explanations is not only a result of the crude explanatory<br />
approach of shift-share analysis. The same picture emerges from a theoretically more sophisticated<br />
model of normal growth pattern (Ste<strong>in</strong>er, 1981).<br />
5
) A step further went the "sclerosis approaches", an expression go<strong>in</strong>g back to<br />
K<strong>in</strong>dleberger (1978), sometimes also <strong>–</strong> more technically <strong>–</strong> called as "blockage of<br />
endogenous renewability" (Geldner 1983). The basic assumption here is that<br />
adaptive mechanisms do not work any more and that behavioural potentials have<br />
been reduced: this leads to an overemphasis of distributional aspects <strong>in</strong>stead of<br />
efficiency, the existence of strong ties lead<strong>in</strong>g to collusion and reduc<strong>in</strong>g the necessity<br />
to strong per<strong>for</strong>mance. The external conditions <strong>for</strong> "entrepreneurial alertness" (a<br />
notion <strong>in</strong>troduced by Kirzner (1980) <strong>in</strong> the tradition of Schumpeter) have deteriorated,<br />
the subjective element of entrepreneurial behaviour has been negatively <strong>in</strong>fluenced<br />
by objective preconditions ( the "entrepreneurial climate").<br />
This raises the question why this happens especially <strong>in</strong> OIAs. One part of the answer<br />
is given by theories of "bounded rationality" (Simon 1959, 1983, Cyert/March 1963)<br />
assum<strong>in</strong>g rigidities <strong>in</strong> the mechanisms of f<strong>in</strong>d<strong>in</strong>g and process<strong>in</strong>g <strong>in</strong><strong>for</strong>mation <strong>–</strong><br />
externalities are an important factor <strong>for</strong> these mechanisms lead<strong>in</strong>g to a diversion of<br />
the logics of <strong>in</strong>dividual and collective action. These mechanisms have a clear<br />
regional and sectorspecific dimension (Tichy 1979, Prisch<strong>in</strong>g 1985): Industries and<br />
regions hav<strong>in</strong>g a long success story are not any more able to take up the relevant<br />
market signals, the petrification of structures and the rout<strong>in</strong>es of decision mak<strong>in</strong>g<br />
leads to misjudgements and misconceptions. The spatial dimension here <strong>in</strong>cludes<br />
not only geographical distance, but <strong>in</strong><strong>for</strong>mational aspects of lack<strong>in</strong>g economies of<br />
urbanization and agglomeration because of the similarity <strong>in</strong> behaviuor result<strong>in</strong>g <strong>in</strong><br />
locally bounded rationality.<br />
This bounded rationality is also re<strong>in</strong><strong>for</strong>ced by strong distributional coalitions. Olson<br />
(1982) emphasises the negative effects of collusions of social groups which are able<br />
to <strong>in</strong>fluence political decisions <strong>in</strong> their own favour. They are the stronger the longer<br />
societies and economies grow <strong>in</strong> a stable way <strong>–</strong> it takes a long time to build up such<br />
coalitions but once they are <strong>in</strong>stalled they are able to exercise rent seek<strong>in</strong>g<br />
behaviour. OIAs with a long past of <strong>in</strong>dustrialization and wealth are strongly<br />
<strong>in</strong>fluenced by such coalitions compris<strong>in</strong>g managers, unions and politicians lead<strong>in</strong>g to<br />
higher wages and prices and prevent<strong>in</strong>g mobility and flexibility.<br />
6
The <strong>in</strong>creas<strong>in</strong>g age and ris<strong>in</strong>g wealth of these <strong>in</strong>stitutions also leads to different<br />
behaviour and changes the mentality: less efficiency and motivation <strong>for</strong> work. This<br />
"Buddenbrook-approach" (as it is called by Tichy (1987) because of the decl<strong>in</strong>e of<br />
this family <strong>in</strong> later generations <strong>in</strong> Th. Mann's famous novel) symbolizes the<br />
correspondence of age and welfare with chang<strong>in</strong>g values and divert<strong>in</strong>g <strong>in</strong>terests.<br />
c ) These approaches have been taken up and <strong>in</strong>tegrated <strong>in</strong> a systematic way <strong>in</strong> a<br />
cyclical-evolutionary <strong>in</strong>terpretation of regional development and spatial concentration<br />
of sectors and <strong>in</strong>dustries. It comb<strong>in</strong>es Vernon's (1966) and Hirsch's (1967)<br />
contribution to a product cycle <strong>in</strong> <strong>in</strong>ternational trade with evolutionary theories of<br />
economic change (Nelson/W<strong>in</strong>ter 1982) and "Austrian" <strong>in</strong>terpretations of the creative<br />
function of the market:<br />
Besides the allocative function of the market - and this is usually less emphasized -<br />
there is also a further function: the market is an <strong>in</strong>strument which transfers <strong>in</strong>centives<br />
<strong>for</strong> economic change. This emphasis on the market's creative function started with<br />
the Austrian school of economic thought. Hayek, especially, underl<strong>in</strong>ed the<br />
explorative potential of the market - its capabilities do not rest so much <strong>in</strong> the<br />
allocation, but <strong>in</strong> its flexibility <strong>in</strong> adjust<strong>in</strong>g to new situations. The market is an optimal<br />
process of exploration, it is a development process. In the same sense, Schumpeter<br />
always regarded the market as a process and not as a state: economic competition<br />
is not price-tak<strong>in</strong>g behaviour under conditions of perfect competition, but a process<br />
with w<strong>in</strong>ners and losers.<br />
The evolutionary aspect <strong>in</strong> this approach is the necessity <strong>for</strong> adjustment; economic<br />
agents are <strong>in</strong> an <strong>in</strong>terplay with their surround<strong>in</strong>gs. The concept of selection means<br />
that they either have to adjust or they perish: non-survival of the non-fit. Yet this<br />
per<strong>for</strong>mance of adjustment has to be differentiated. It can mean adaptibility or<br />
adaptation (Prisch<strong>in</strong>g, 1986): adaptation is a reaction to the surround<strong>in</strong>gs, it is an<br />
optimal use of the exterior facts; adaptability, <strong>in</strong> contrast, means keep<strong>in</strong>g open<br />
structures and resources which are not bound <strong>for</strong> specific purposes but which are<br />
available <strong>for</strong> necessary reorganizations <strong>in</strong> times of new challenges - here, adaptable<br />
behaviour is dom<strong>in</strong>ant. These contrast<strong>in</strong>g <strong>for</strong>ms of behaviour <strong>–</strong> the one creative, the<br />
other allocative <strong>–</strong> may be regarded as be<strong>in</strong>g united <strong>in</strong> an evolutionary process with<br />
7
spatial consequences (Ell<strong>in</strong>ger 1977). This behaviour is dependent of the age of the<br />
firms. In the early stage, firms are not limited <strong>in</strong> regard to their location decision. In<br />
the early stages of growth, the comb<strong>in</strong>ation of super profit and of imperfect<br />
competition (because of exist<strong>in</strong>g limits to capital mobility and because of price<br />
<strong>in</strong>elastic demand) allows <strong>for</strong> successful development without consideration of<br />
regional differences <strong>in</strong> costs of location (Markusen, 1985). This is the consequence<br />
of the specific decision-mak<strong>in</strong>g behaviour of these firms: they are "adaptable", i.e.<br />
they are either <strong>in</strong>novators themselves or quickly adopt <strong>in</strong>novations; they decide to<br />
start production soon after a major <strong>in</strong>novation. In later stages this behaviour<br />
changes: the firms become "adaptive" - they adjust to their economic and regional<br />
environment. Their behaviour becomes "locationally decisive" <strong>in</strong> locational costs.<br />
Both <strong>for</strong>ms of entrepreneural behaviour - the adaptable and the adaptive - thus<br />
follow a temporal sequence; the spatial consequences are part of an evolutionary<br />
process. Yet the basic freedom of location <strong>in</strong> the early phase is restricted <strong>in</strong> real<br />
space and <strong>in</strong> real time - the resources which are necessary <strong>for</strong> adaptable behaviour<br />
cannot be attracted everywhere. From this there results an <strong>in</strong>terrelationship between<br />
the locational needs of <strong>in</strong>novative firms and the manifold factors of production which<br />
are necessary <strong>for</strong> adaptable behaviour. On the other hand, the distribution of<br />
regional supplies of such factors is not <strong>in</strong>dependent of the distribution of such firms -<br />
the location and the situation of many factors can be <strong>in</strong>fluenced by the decisions of<br />
firms <strong>in</strong> their <strong>in</strong>novative stage.<br />
These different k<strong>in</strong>ds of behaviour demand certa<strong>in</strong> economic environments with<br />
special resources. The difference <strong>in</strong> regional economic potential there<strong>for</strong>e resides <strong>in</strong><br />
these specific factors which are characteristic of each evolutionary stage. At the<br />
same time, they correspond to the different behaviour and the adjustment<br />
per<strong>for</strong>mances which these supplies of factors allow to be produced - the regional<br />
distribution of factors of production depends <strong>in</strong> the long run on the behaviour of a<br />
region's firms. <strong>Old</strong> <strong>in</strong>dustrial areas accord<strong>in</strong>gly are regions with an <strong>in</strong>sufficient<br />
adjustment per<strong>for</strong>mance, deficient <strong>in</strong> adaptation, which results <strong>in</strong> negative selection<br />
either because an "over adjustment" led to a dead end of the evolution or because a<br />
too rapid change of the environment (to which there was no timely reaction)<br />
exceeded the potential <strong>for</strong> adjustment; "non-adapted" regions stagnate, they have<br />
8
lost their potential to survive, their dom<strong>in</strong>at<strong>in</strong>g firms were too stable; "complete<br />
stability results <strong>in</strong> stagnation" (Radnitzky, 1984). These old <strong>in</strong>dustrial areas are<br />
neither "adaptable" nor "adapted". In this type of region the failure of the creative<br />
function of the market is evident - no new opportunities are found, no hitherto<br />
unknown comb<strong>in</strong>ations are taken up, no markets are created.<br />
Attempts to get empirically testable results described each cyclical-evolutionary<br />
stage and its dom<strong>in</strong>at<strong>in</strong>g behaviour with concrete characteristics (Geldner 1989,<br />
Ste<strong>in</strong>er 1990). For OIAs the follow<strong>in</strong>g variables proved to be decisive<br />
(Ste<strong>in</strong>er/Belschan 1991): In these regions a lack of entrepreunerial behaviour hav<strong>in</strong>g<br />
no discretionary power, only control over rout<strong>in</strong>e production is to be expected. This<br />
k<strong>in</strong>d of behaviour can be represented by variables such as large plants with strong<br />
<strong>in</strong>ternal hierarchies, a strong dependence on external headquarters, and weak<br />
(regional) competition through the entry of potential new producers (Ch<strong>in</strong>itz, 1961).<br />
Research and development expenditure is below average, market<strong>in</strong>g is not very<br />
important, and the rate of <strong>in</strong>novation is low (both <strong>in</strong> respect to products and to<br />
markets; if there are <strong>in</strong>novations at all they tend to be process <strong>in</strong>novations). The<br />
attempt to preserve market power through a strategy of cartelization (Markusen,<br />
1985) has also led to specific behaviour on the part of employees: strong<br />
unionization with strong barga<strong>in</strong><strong>in</strong>g power lead<strong>in</strong>g to high wages (Ste<strong>in</strong>er, 1985). We<br />
also expect a sectorial concentration with a marked vertical <strong>in</strong>tegration and high<br />
capital <strong>in</strong>tensity. Oligopoly power and high wages create barriers <strong>for</strong> entry and exit of<br />
new and old plants. The <strong>for</strong>mation of new firms and the death of firms is low<br />
(Ste<strong>in</strong>er/Posch, 1985).<br />
This life cycle <strong>in</strong>terpretation cal also be extended to hypotheses concern<strong>in</strong>g<br />
per<strong>for</strong>mance <strong>in</strong>dicators and labour market outcomes (Ste<strong>in</strong>er 1990 a, Kub<strong>in</strong>/Ste<strong>in</strong>er<br />
1992). Different regional potentials have implications <strong>for</strong> the labour market outcome,<br />
not only <strong>for</strong> the overall labour market result as measured by the traditional rate of<br />
unemployment and rate of vacancies, but also with respect to the underly<strong>in</strong>g labour<br />
market dynamic. This last aspect is suggested by approaches to labour market<br />
statistics splitt<strong>in</strong>g the stock figures <strong>in</strong>to their two components, <strong>in</strong>cidence and duration<br />
(Sallant, 1977, Clark/Summers, 1979, Akerlof/Ma<strong>in</strong>, 1981), which have been<br />
developed <strong>in</strong> connection with the rise of search models <strong>in</strong> labour market theory<br />
9
(Phelps, 1970). It also con<strong>for</strong>ms to the theoretic perspective of segmented labour<br />
markets.<br />
In contrast to neoclassical <strong>in</strong>terpretations of labour markets as rather homogenous,<br />
the theory of segmented labour markets stresses their differences. The ma<strong>in</strong><br />
difference lies <strong>in</strong> the two segments: a primary one with "good" jobs with high wages,<br />
stable employment and the possibility of upward mobility, a secondary one with "bad"<br />
jobs offer<strong>in</strong>g low pay, high fluctuation and little chance fo advancement. This<br />
approach (Piore, 1975) relates labour market behaviour to certa<strong>in</strong> characteristics of<br />
product demand which we expect to differ regionally. It also relates to the theoretical<br />
characteristics of the regions thus allow<strong>in</strong>g differentiation of the labour market<br />
structure of the regional types.<br />
Rely<strong>in</strong>g on this approach we presume that global labour market per<strong>for</strong>mance differs<br />
between regions, that labour market structure with<strong>in</strong> a s<strong>in</strong>gle regions tends to be<br />
homogeneous, and that this structure should differ between regions: Firms <strong>in</strong> old<br />
<strong>in</strong>dustrial areas have adjusted their production technology too much to their <strong>for</strong>mer<br />
economic environment. This over-adaptation leads to <strong>in</strong>sufficient results <strong>in</strong> the face<br />
of chang<strong>in</strong>g circumstances prevent<strong>in</strong>g any creative strategy as well as any passive<br />
reaction to these external changes. Their product demand used to be highly stable.<br />
Under these conditions an <strong>in</strong>flexible technology is chosen, comb<strong>in</strong><strong>in</strong>g great amounts<br />
of fixed capital and a primary labour <strong>for</strong>ce of the lower tier show<strong>in</strong>g highly specific<br />
productive traits. The traditional employment behaviour found <strong>in</strong> old <strong>in</strong>dustrial areas,<br />
characterized primarily by a high portion of specifically skilled blue-collar workers and<br />
a low female participation rate, on the one hand rendered this areas attractive <strong>for</strong> this<br />
type of standardized production, while on the other hand is def<strong>in</strong>ed itself by the<br />
employment structure offered by the big enterprises found <strong>in</strong> this regions. This<br />
primary structure, that also results <strong>in</strong> comparatively high wages, was rendered<br />
possible by a <strong>for</strong>mer monopolistic power <strong>in</strong> product markers (<strong>in</strong>dicated by the size of<br />
plants).<br />
10
3- An empirical assessment - the case of Upper Styria<br />
3. 1 Regional Characteristics of Upper Styria<br />
The prov<strong>in</strong>ce of Styria is located <strong>in</strong> the south-east of Austria, bordered on Slovenia <strong>in</strong><br />
the south and close to Hungary. From the Austrian as well as the EU perspective, it<br />
is <strong>in</strong> a peripheral and border location.<br />
With<strong>in</strong> the Austrian federal constitution it has the status of a Bundesland with own<br />
prov<strong>in</strong>cial government and parliament (Landtag). Despite a number of <strong>for</strong>mal<br />
competencies and economic development, the autonomous f<strong>in</strong>ancial means of the<br />
Länder to per<strong>for</strong>m them are not too strong.<br />
Styria’s population of 1.2 million - spread over 16,000 sq. km <strong>–</strong> contributes 12% to<br />
the Austrian GDP. With its topography it has relatively strong populated planes and<br />
valleys with urban-<strong>in</strong>dustrialised areas and low settled Alp<strong>in</strong>e-dales with primary<br />
<strong>in</strong>dustry.<br />
As a region of basic <strong>in</strong>dustry its role was strong <strong>in</strong> the past but it has been decl<strong>in</strong><strong>in</strong>g<br />
cont<strong>in</strong>uously s<strong>in</strong>ce the 1960s.<br />
With<strong>in</strong> the prov<strong>in</strong>ce, several subregions can be identified:<br />
• Upper Styria, the case study region, consists of the 6 political districts Bruck an<br />
der Mur, Leoben, Judenburg, Knittelfeld, Liezen and Mürzzuschlag. Austrian<br />
<strong>in</strong>dustrial development orig<strong>in</strong>ated <strong>in</strong> this region, based on the iron-ore from the<br />
Erzberg as well as on natural resources like coal, timber and water power from<br />
Alp<strong>in</strong>e valleys. S<strong>in</strong>ce Alp<strong>in</strong>e rivers were used <strong>for</strong> transportation as well, the ironand<br />
steel <strong>in</strong>dustry as well as <strong>for</strong>ward l<strong>in</strong>ked metal based <strong>in</strong>dustries have<br />
developed along the river valleys of Mur, Mürz and Enns.<br />
The region, an old <strong>in</strong>dustrial area (OIA) is periphery located <strong>in</strong> a broader view.<br />
Connections to Western- and Central European agglomeration are weak, even<br />
transport towards Vienna and Graz is to improve. Inner-regional transportation<br />
facilities along the Mur-/Mürz river valley has been improved whereas side-valleys<br />
traffic facilities suffers from its topography.<br />
• Graz, capital of Styria and own political district with a population of about 250,000<br />
is the economic and political centre of Styria. It has a tradition and <strong>in</strong>dustrial base<br />
<strong>in</strong> mechanical eng<strong>in</strong>eer<strong>in</strong>g, mach<strong>in</strong>ery <strong>in</strong>dustry and vehicles. International<br />
11
established firms, research <strong>in</strong>stitutions, knowledge suppliers (<strong>in</strong>cl. 3 Universities)<br />
and special services are located <strong>in</strong> the urban area. Income levels are higher and<br />
labour market <strong>in</strong>dicators show a better per<strong>for</strong>mance than the average of Austria<br />
and the EU.<br />
• Rural periphery to the south, m<strong>in</strong>or <strong>in</strong>dustrial structured until the 1970s, has<br />
undergone <strong>in</strong>dustrialisation s<strong>in</strong>ce then. Besides labour <strong>in</strong>tensive <strong>in</strong>dustries such<br />
as leather, textile and cloth<strong>in</strong>g there are modern sectors such as electrical<br />
products, electronics and mach<strong>in</strong>ery present as well.<br />
Styria, thus has a mix of traditional and modern <strong>in</strong>dustries, of types of subregions as<br />
well as policies.<br />
Styria’s regional economy is dom<strong>in</strong>ated by the manufactur<strong>in</strong>g sector, which produces<br />
21% of the GRP. The economically most important regions are Upper Styria and the<br />
capital Graz (and surround<strong>in</strong>gs), both with a long-last<strong>in</strong>g <strong>in</strong>dustrial tradition.<br />
Upper Styria was heavily based <strong>in</strong> the manufactur<strong>in</strong>g of iron ore and coal, lead<strong>in</strong>g to<br />
the development of <strong>in</strong>flexible economic structures and the <strong>in</strong>ability to adjust to<br />
chang<strong>in</strong>g economic conditions. As a consequence, serious economic problems<br />
<strong>in</strong>dicated by low growth rates of <strong>in</strong>dustrial production, high unemployment and<br />
migration rates which are jeopardis<strong>in</strong>g the economic competitiveness of the whole<br />
region.<br />
12
Fig. 3- Location of Austria/Styria<br />
Dresden<br />
Stuttgart<br />
Nürnberg<br />
Prag<br />
München<br />
L<strong>in</strong>z<br />
Wien<br />
Bratislava<br />
Innsbruck<br />
St. Gallen<br />
Salzburg<br />
AUSTRIA<br />
Graz<br />
Sopron<br />
Budapest<br />
Ud<strong>in</strong>e<br />
Ljubljana<br />
Maribor<br />
Zagreb<br />
13
STYRIA<br />
Region<br />
Graz<br />
Facts & Figures: (census 1991)<br />
Inhabitants: 355,858<br />
Persons employed: 189,554<br />
Dom<strong>in</strong>at<strong>in</strong>g <strong>in</strong>dustries:<br />
- mechanical eng<strong>in</strong>eer<strong>in</strong>g and steel<br />
construction, environmental<br />
technology: 6,262 empl.<br />
- automotive eng<strong>in</strong>eer<strong>in</strong>g: 4,749 empl.<br />
- electrical and electronic<br />
eng<strong>in</strong>eer<strong>in</strong>g:<br />
1,774 empl.<br />
- food <strong>in</strong>dustry: 1,732 empl.<br />
3.1.1 Characteristics “<strong>Old</strong> <strong>Industrial</strong> Area”: Upper Styria, late 1970s:<br />
Table 3.1<br />
(USt = Upper St = Styria A = Austria)<br />
Styria<br />
Monostructure: Share of Employees <strong>in</strong> first- and second largest <strong>in</strong>dustry<br />
USt 60% St 38% A 24%<br />
Large-scale Enterprises: Average Employees / enterprise<br />
USt 180 St 121 A 94<br />
Low productivity: Output / Employee<br />
USt 100 St 108 A 129<br />
High wages & low qualification: Average wage / Employee<br />
USt 100 St 97 A 101<br />
Low productivity-growth: 1972-78<br />
USt +30% St +40% A +60%<br />
Low newly founded enterprises: Workplaces <strong>in</strong> new / shut-down enterprises<br />
Between 1976 <strong>–</strong> 80 <strong>in</strong> % of total <strong>in</strong>dustrial employment 1978<br />
Foundation-rate USt 1.1 St 3.4 A 4.0<br />
Shut-down rate USt 1.5 St 2.9 A 4.1<br />
Source: Tichy (1994b), p. 351.<br />
14
3.2 Upper Styria <strong>in</strong> Transition <strong>–</strong> Descriptive Indicators<br />
3.2.1 Demographic Figures<br />
Accord<strong>in</strong>g to Table 3.2, the total population <strong>in</strong> Styria was slightly decreas<strong>in</strong>g by -0,2%<br />
between 1981 and 1991. In Upper Styria, the reduction was stronger (-3,7%). On<br />
political district level, a especially strong decrease could be observed <strong>in</strong> Leoben (-<br />
8,9%) and Bruck/Mur (-5%).<br />
Table 3.2 Age Groups<br />
Political District<br />
Structure of Agegroups 1971-2011<br />
1981 1991<br />
< 15 years 15 - 60 y. > 60 years < 15 years 15 - 60 y. > 60 years<br />
Bruck / Mur 13.497 44.765 13.068 10.744 41.831 15.199<br />
Judenburg 11.097 32.342 9.201 8.779 30.864 10.469<br />
Knittelfeld 6.557 17.969 5.582 5.343 17.850 6.333<br />
Leoben 14.610 49.592 16.316 10.608 44.894 17.870<br />
Liezen 17.953 48.791 13.578 15.265 49.671 16.416<br />
Mürzzuschlag 9.112 28.476 8.752 7.515 26.760 10.487<br />
Upper Styria 72.826 221.935 66.497 58.254 211.870 76.774<br />
Styria 248.949 719.058 218.518 207.739 732.989 243.992<br />
Austria 1.510.564 4.591.116 1.453.658 1.356.806 4.874.252 1.564.728<br />
Source: AK (1998), ÖROK-Bevölkerungsprogrnose II, ÖROK-Schriftenreihe, Nr. 79 (1990).<br />
ÖSTAT, VZ 1971, VZ 1981, VZ 1991<br />
Focus<strong>in</strong>g on the age groups, especially the work<strong>in</strong>g-group (15-50 years), an <strong>in</strong>crease<br />
of +1,9% can be observed.<br />
For Upper Styria, a contrary result is true: a decrease by <strong>–</strong>4,5% could be observed<br />
between 1981 and 1991, ma<strong>in</strong>ly due to outward migration of <strong>–</strong>12.603 (absolute).<br />
Compar<strong>in</strong>g the work<strong>in</strong>g agegroup with employment figures (see 3.2.2.1), a difference<br />
between those two numbers becomes obvious. Reasons <strong>for</strong> this gap could <strong>in</strong>clude<br />
either an <strong>in</strong>creas<strong>in</strong>g employment rate, an early entry <strong>in</strong>to active/professional life, a<br />
retarded leave or <strong>in</strong>bound commut<strong>in</strong>g.<br />
15
In Upper Styria, 9.000 jobs were cut <strong>in</strong> the nationalised <strong>in</strong>dustry, further 4.000 <strong>in</strong> the<br />
service sector due to shr<strong>in</strong>k<strong>in</strong>g tourism (see Tichy, 1994c, p.29).<br />
Private <strong>in</strong>dustry created 1.000 additional jobs. Population <strong>in</strong> employment age<br />
decreased by <strong>–</strong>10.000 due to outward migration by more than 12.600 ma<strong>in</strong>ly from<br />
the political districts Leoben, Bruck/Mur and Judenburg.<br />
A dom<strong>in</strong>ant question is where all unemployed had rema<strong>in</strong>ed. Accord<strong>in</strong>g to<br />
Ste<strong>in</strong>er/Wendner (1993) the answer is outward migration <strong>–</strong> not of unemployed who<br />
retired early <strong>–</strong> but of their children who had left the region. There<strong>for</strong>e the share of 15-<br />
60 years of age <strong>in</strong> total population decl<strong>in</strong>ed <strong>in</strong> all Upper Styrian districts, while it rose<br />
<strong>in</strong> all other Styrian districts. A significant dra<strong>in</strong> from the district capitals Leoben (-<br />
6,5%) and Bruck/Mur (-6%) could be noted only with<strong>in</strong> a decade. This dra<strong>in</strong> of<br />
<strong>in</strong>itiative population reflects a relatively pessimistic attitude under the OIA’s<br />
population (see Tichy, 1994c, p. 28ff.). 2<br />
3.2.2 Labour Market<br />
Compar<strong>in</strong>g stagnant regions with <strong>in</strong>novative regions, they have a higher duration of<br />
unemployment, accompanied by a higher share of long-term unemployment. Due to<br />
a low flow of new vacancies, the rate of job-vacancies is lower as well. When people<br />
become unemployed <strong>in</strong> stagnant regions, they usually rema<strong>in</strong> unemployed <strong>for</strong> a<br />
longer period due to lower vacancies (see Kub<strong>in</strong>/Ste<strong>in</strong>er, 1992).<br />
Kub<strong>in</strong>/Ste<strong>in</strong>er po<strong>in</strong>t out that <strong>–</strong> <strong>in</strong> the regional context <strong>–</strong> labour market problems were<br />
not one-dimensional phenomena. There<strong>for</strong>e an analysis of several available labour<br />
market <strong>in</strong>dicators at the same time is required and their specific pattern noted.<br />
Concentrat<strong>in</strong>g only on one s<strong>in</strong>gle <strong>in</strong>dicator, e.g. the most common unemployment<br />
rate, would be mislead<strong>in</strong>g <strong>in</strong> this view. Analys<strong>in</strong>g Upper Styria’s labour market will<br />
there<strong>for</strong>e <strong>in</strong>clude the follow<strong>in</strong>g relevant <strong>in</strong>dicators:<br />
2 The <strong>for</strong>ecast <strong>for</strong> 2011 predicts a further <strong>–</strong>5,7% population decrease. However this <strong>for</strong>ecast is under<br />
discussion by Tichy (1998) and Münz (1999). An analysis of registration data <strong>for</strong> the period of 1991-96<br />
refuted the ÖROK’s qu<strong>in</strong>quennial <strong>for</strong>ecasts. Specially the newly <strong>in</strong>troduced regional <strong>in</strong>- and outward<br />
migration is under heavy dispute. While the <strong>for</strong>ecast predicted an absolute change of <strong>–</strong>917, i.e. 917<br />
persons leav<strong>in</strong>g Upper Styria, the analysed registration data returned an <strong>in</strong>ward migration of +60<br />
persons. Tichy there<strong>for</strong>e questions the <strong>for</strong>ecast figures till 2011. He argues that the reason <strong>for</strong> outward<br />
migration <strong>–</strong> structural changes and decl<strong>in</strong><strong>in</strong>g <strong>in</strong>dustry dur<strong>in</strong>g the 1980s <strong>–</strong> had ceased and that<br />
accord<strong>in</strong>gly the <strong>for</strong>ecast is based on a false trend (see Tichy, 1998). A disputes' settlement - whether<br />
<strong>in</strong>crease or decrease - will only occur with new census data expected <strong>in</strong> 2003.<br />
16
• Employment numbers; change between 1981/91; per sector employment;<br />
employment <strong>in</strong> service/ technological sector,<br />
• Education and qualification of the population and its distribution among<br />
employees,<br />
• Unemployment figures analys<strong>in</strong>g trends <strong>in</strong> the unemployment rate between<br />
1981/98; focus on young/ elderly unemployed; long-term unemployment.<br />
3.2.2.1 Employment<br />
Employment figures dramatically changed between 1981 and 1991 <strong>in</strong> Upper Styria.<br />
While Styria experienced a moderate decrease of only <strong>–</strong>0,8%, Upper Styria’s<br />
employment figures fell by <strong>–</strong>8,8%. Besides this average number, the situation was<br />
worse <strong>in</strong> certa<strong>in</strong> districts: Leoben’s employment plummeted by <strong>–</strong>14,4% , those of<br />
neighbour district Bruck/Mur by <strong>–</strong>13,7%. Only Knittelfeld’s decrease was below<br />
Styrian average dur<strong>in</strong>g the mentioned time span.<br />
After those dramatic losses dur<strong>in</strong>g the 1980s, the employment situation <strong>in</strong> Upper<br />
Styria changed <strong>for</strong> the good: between 1991 and 1998 the region saw a rise of its<br />
employment number of 2,7%, compared to Styria’s growth by 0,3% on average.<br />
While only Judenburg’s employment situation worsened by -3,8%, Leoben (+4,3),<br />
Liezen (+6,0) and Mürzzuschlag (+7%) were far above Styrian average.<br />
Table 3.3 Employment 1981-1998<br />
Development of Employment 1981 - 1998<br />
<strong>Change</strong> <strong>in</strong> %<br />
Political Districts 1981 1991 1998 1981/91 1991/98<br />
Bruck / Mur 30.925 26.693 26.822 -13,7 0,5<br />
Judenburg 20.668 19.892 19.133 -3,8 -3,8<br />
Knittelfeld 11.205 11.123 11.253 -0,7 1,2<br />
Leoben 31.320 26.814 27.973 -14,4 4,3<br />
Liezen 32.308 31.076 32.932 -3,8 6,0<br />
Mürzzuschlag 17.151 15.317 16.395 -10,7 7,0<br />
Upper Styria 143.577 130.915 134.508 -8,8 2,7<br />
Styria 483.095 479.053 480.678 -0,8 0,3<br />
Austria 3.260.521 3.468.504 - 6,4 -<br />
Source: ÖSTAT VZ 1991, AK (1998).<br />
17
Employment <strong>in</strong> Sectors<br />
Analys<strong>in</strong>g the census data, employment’s participation <strong>in</strong> the three different<br />
economic sectors changed remarkably between 1981 and 1991.<br />
The primary sector’s overall share decreased by 1,8 percentage-po<strong>in</strong>t (pp) <strong>in</strong> Upper<br />
Styria and 3,8pp on Styrian average. The decrease was there<strong>for</strong>e not as strong as<br />
on prov<strong>in</strong>cial average. Only Liezen and Judenburg had to face over-proportional<br />
decreases <strong>in</strong> the primary sector’s employment among the districts <strong>in</strong> the case study<br />
region.<br />
With<strong>in</strong> the secondary sector, regional changes become more significant.<br />
Styria’s share <strong>in</strong> the secondary sector fell by 4,5pp from 42,2% to 37,7%. The overall<br />
development <strong>in</strong> Upper Styria was more dramatic: the share fell by 7,4pp to 41,8% <strong>in</strong><br />
1991, compared with 49,2% <strong>in</strong> 1981.<br />
The strongest decrease occurred <strong>in</strong> Leoben with a reduction of <strong>–</strong>9,1pp from 49,9% to<br />
40,8%. Neighbour district Bruck/Mur figures were down from 53,5% (1981) to 45,0%<br />
<strong>in</strong> 1991. Both districts had above-average changes with a gap of 1,7pp and 0,9pp<br />
respectively to the regional average.<br />
Analys<strong>in</strong>g the service or tertiary sector, Upper Styria per<strong>for</strong>med well: with a rise of<br />
the share from 42,6% to 51,8% <strong>in</strong> overall tertiary sector employment, the ga<strong>in</strong> of<br />
9,2pp is clearly above Styrian average of 8,2%. Liezen (+9,6), Leoben &<br />
Mürzzuschlag (+9,5%) and Bruck/Mur (+9,4%) where above <strong>in</strong>ner regional average.<br />
Especially Leoben and Bruck/Mur could compensate lost shares with<strong>in</strong> the<br />
secondary sector with strong growth <strong>in</strong> the service-sector <strong>in</strong>dustry.<br />
18
Table 3.4 Sectional Employment<br />
Employment per Sector <strong>in</strong> %<br />
Sector<br />
Political District<br />
Primary Secondary Tertiary<br />
1981 1991 1981 1991 1981 1991<br />
Bruck / Mur 5,3 4,4 -0,9 53,5 45,0 -8,5 41,2 50,6 9,4<br />
Judenburg 9,0 6,9 -2,1 52,6 46,1 -6,5 38,5 47,0 8,5<br />
Knittelfeld 10,1 8,6 -1,5 45,4 38,2 -7,2 44,4 53,2 8,8<br />
Leoben 4,4 4,1 -0,3 49,9 40,8 -9,1 45,6 55,1 9,5<br />
Liezen 12,2 8,5 -3,7 39,9 34,0 -5,9 47,9 57,5 9,6<br />
Mürzzuschlag 8,2 6,1 -2,1 54,0 46,6 -7,4 37,8 47,3 9,5<br />
Upper Styria 8,2 6,4 -1,8 49,2 41,8 -7,4 42,6 51,8 9,2<br />
Styria 12,4 8,6 -3,8 42,2 37,7 -4,5 45,5 53,7 8,2<br />
Source: ÖSTAT, LASTAT, VZ 1991, Ergebnisse III, Heft 1/96, Graz.<br />
At present (1998), service sector and technological sector are expand<strong>in</strong>g <strong>in</strong> Upper<br />
Styria, partly with above average figures.<br />
Analys<strong>in</strong>g the service sector between 1996 and 1998, Upper Styria saw constant<br />
above-average growth dur<strong>in</strong>g the recent two years. A +7,2% ga<strong>in</strong> <strong>for</strong> 1995/96<br />
followed an outstand<strong>in</strong>g <strong>in</strong>crease <strong>in</strong> 1996/97 by +10,9%. In 1998, growth rates were<br />
even triple higher than Austrian- and 2 ½ times higher than Styrian average.<br />
With<strong>in</strong> the technological sector, the OIA’s growth rates were <strong>in</strong> any year above<br />
Austrian average but slightly lower than prov<strong>in</strong>cial average. This may result from the<br />
relatively strong position of the Styrian Automobile Cluster, where spill-over effects to<br />
Upper Styria seem to be effective: while Austria’s employment with<strong>in</strong> the<br />
technological sector decreased s<strong>in</strong>ce three years, Upper Styria’s grew constantly<br />
between 2,5 and 3%.<br />
19
Table 3.5 Employment <strong>in</strong> the Service- & Technological Sector<br />
Employment <strong>in</strong> Service- & Technologcial Sector (change <strong>in</strong> %)<br />
1998 1997 1996<br />
Sector Sector Sector<br />
Total Service Techn. Total Service Techn. Total Service Techn.<br />
Austria 0,95 5,29 -0,73 1,14 6,85 -1,22 0,09 5,26 -2,06<br />
Styria 1,18 6,53 2,54 2,07 8,50 3,00 1,00 8,66 2,40<br />
Upper Styria 0,14 15,96 1,41 0,61 10,88 2,10 -0,27 7,19 -1,61<br />
Bruck 0,41 -12,82 3,89 0,04 12,98 4,32 6,20 9,75 -2,92<br />
Judenburg -4,11 -2,35 -7,41 1,06 26,49 -4,22 -1,95 13,51 -1,33<br />
Knittelfeld 2,56 128,69 -4,85 1,11 -2,79 -4,71 -0,98 4,58 -11,31<br />
Leoben 3,67 -3,07 6,48 2,21 17,87 11,62 -4,59 6,51 2,60<br />
Liezen 0,77 -7,28 8,04 0,15 4,33 7,35 -0,56 0,29 -0,64<br />
Mürzzuschlag -2,44 -7,38 2,33 -0,93 6,43 -1,72 0,29 8,53 3,98<br />
Source: WIBIS 1999.<br />
Summarised it can be po<strong>in</strong>ted out that there has been a clear and strong sectional<br />
shift from the secondary towards the tertiary sector s<strong>in</strong>ce 1981. In the case of Upper<br />
Styria, the neighbour<strong>in</strong>g districts Leoben and Bruck/Mur had to face the sharpest<br />
tumble of secondary sector decl<strong>in</strong>e. Growth rates with nearly 10% with<strong>in</strong> the service<br />
sector between 1981 and 1991 cont<strong>in</strong>ued and even grew dur<strong>in</strong>g 1997 and 1998 (e.g.<br />
+16,0% <strong>in</strong> 1998). More surpris<strong>in</strong>gly seems to be the cont<strong>in</strong>uous growth of the<br />
technological sector <strong>in</strong> Upper Styria (+2,5-3%) between 1995 and 1998, while<br />
Austria’s technological sector-employment fell dur<strong>in</strong>g the recent years. S<strong>in</strong>ce Upper<br />
Styria’s per<strong>for</strong>mance is under Styrian average figures, this may be evidence <strong>for</strong> the<br />
strong position of the Automobile Cluster <strong>in</strong> Styria’s southern- and easterly districts,<br />
with obvious spill-over effects to the OIA.<br />
3.2.2.2 Education & Qualification<br />
Analys<strong>in</strong>g the qualification of the population, two clear trends could be identified:<br />
1) A clear movement towards higher education could be noted <strong>in</strong> the whole case<br />
study region,<br />
2) Shares <strong>in</strong> lower-skilled-workers segment decreased.<br />
20
Focus<strong>in</strong>g on the specific education & qualification groups, the group of High School<br />
leavers <strong>in</strong>creased by +47,5% between 1981 and 1991. Not only was this the highest<br />
<strong>in</strong>crease but also the only constantly above Styrian average (+43,9%).<br />
The second group <strong>–</strong> University Graduates <strong>–</strong> also experienced growth rates of<br />
+45,1% <strong>in</strong> the OIA but clearly under Styria’s overall <strong>in</strong>crease of 58,9%. Two districts,<br />
Knittelfeld and Liezen were even above prov<strong>in</strong>cial average with <strong>in</strong>creases of 61,9%<br />
and 65,6% respectively.<br />
Technical Colleges boomed between 1981 and 1991: while the overall regional<br />
figures (+12,5%) were below Styrian average (+15,5%), aga<strong>in</strong> the districts Knittelfeld<br />
(+23,4%) and Liezen (+21,4%) shadowed the prov<strong>in</strong>cial numbers.<br />
21
Table 3.6 Qualification <strong>in</strong> Upper Styria<br />
Qualification<br />
Employees<br />
<strong>Change</strong> ( ∆ ) 1981-1991 <strong>in</strong> %<br />
Total<br />
University<br />
1971 1981 1991 ∆ 1971 1981 1991 ∆<br />
Bruck / Mur 11.433 12.393 (+8,4) 605 962 1.318 (+37,0)<br />
Judenburg 7.372 8.297 (+12,5) 319 637 917 (+44,0)<br />
Knittelfeld 4.946 5.867 (+18,6) 196 357 578 (+61,9)<br />
Leoben 12.590 13.668 (+8,6) 783 1.145 1.533 (+33,9)<br />
Liezen 12.942 15.184 (+17,3) 529 951 1.565 (+64,6)<br />
Mürzzuschlag 6.206 6.974 (+12,4) 235 488 676 (+38,5)<br />
Styria 196.174 229.191 (+16,8) 12.468 19.851 31.544 (+58,9)<br />
High School<br />
Technical College<br />
1971 1981 1991 ∆ 1971 1981 1991 ∆<br />
Bruck / Mur 1.171 1.500 2.028 (+35,2) 2.214 2.365 2.529 (+6,9)<br />
Judenburg 751 759 1.234 (+62,6) 1.301 1.464 1.615 (+10,3)<br />
Knittelfeld 425 422 715 (+69,4) 852 877 1.082 (+23,4)<br />
Leoben 1.290 1.347 1.934 (+43,6) 2.531 2.781 2.979 (+7,1)<br />
Liezen 1.118 1.344 1.947 (+44,9) 2.198 2.382 2.891 (+21,4)<br />
Mürzzuschlag 582 753 1.174 (+55,9) 1.347 1.384 1.567 (+13,2)<br />
Styria 22.834 25.624 36.606 (+42,9) 31.584 37.199 42.980 (+15,5)<br />
Apprentice<br />
Secondary School<br />
1971 1981 1991 ∆ 1971 1981 1991 ∆<br />
Bruck / Mur 10.715 4.579 5.084 (+11,0) 13.985 2.027 1.434 (-29,3)<br />
Judenburg 6.648 2.989 3.447 (+15,3) 10.597 1.523 1.084 (-28,8)<br />
Knittelfeld 3.791 2.330 2.749 (+18,0) 5.622 960 743 (-22,6)<br />
Leoben 12.247 4.938 5.573 (+12,9) 14.989 2.379 1.649 (-30,7)<br />
Liezen 10.205 5.350 6.820 (+27,5) 16.502 2.915 1.961 (-32,7)<br />
Mürzzuschlag 6.434 2.319 2.698 (+16,3) 9.226 1.262 850 (-32,6)<br />
Styria 140.761 69.669 86.733 (+24,5) 270.905 43.831 31.328 (-28,5)<br />
Labour<br />
1971 1981 1991 ∆<br />
Bruck / Mur 16.964 14.754 (-13,0)<br />
Judenburg 11.864 10.842 (-8,6)<br />
Knittelfeld 5.680 5.331 (-6,1)<br />
Leoben 17.843 14.790 (-17,1)<br />
Liezen 16.527 16.617 (+0,5)<br />
Mürzzuschlag 10.838 9.495 (-12,4)<br />
Styria 238.913 236.204 (-1,1)<br />
Source: ÖSTAT, VZ 1971, 1981, 1991.<br />
22
Apprenticeships, first essential <strong>for</strong> highly skilled labour <strong>in</strong> a region, grew by +17,2%<br />
<strong>in</strong> the case study region. Despite this extensive ga<strong>in</strong>, the regional <strong>in</strong>crease was +7,3<br />
pp below Styrian average (+24,5%). Only Liezen (+27,5%) experienced above<br />
average growth.<br />
Focus<strong>in</strong>g on lower-skilled education, figures with only secondary school degree and<br />
low-skilled labour were down <strong>in</strong> all case study districts. With a reduction of <strong>–</strong>30,2% <strong>in</strong><br />
secondary school leavers, all but one districts were above Styrian average decrease<br />
(-28,5%). In the group of low-skilled-labour, Upper Styria’s changes (-9,9%) were<br />
clearly above the overall Styrian changes (-1,1%). Especially Leoben and Bruck/Mur<br />
(-17,1% and <strong>–</strong>13,0%) had significantly high drops of low-skilled-labour.<br />
Fig. 3-2 Education/Qualification <strong>in</strong> Upper Styria, 1991<br />
Lower-Skilled-<br />
Labour<br />
53%<br />
University<br />
5%<br />
High School<br />
7%<br />
Technical<br />
College<br />
9%<br />
Apprentice<br />
20%<br />
Secondary<br />
School<br />
6%<br />
Summarised, a clear movement towards higher education and more qualification <strong>in</strong><br />
the case study region could be observed between 1981 and 1991. Some districts<br />
even shadowed the growth rates of prov<strong>in</strong>cial average.<br />
23
3.2.2.3 Unemployment<br />
Unemployment analysis of Upper Styria will <strong>in</strong>clude three ma<strong>in</strong> parts: the overall<br />
unemployment development dur<strong>in</strong>g the 1980s and 1990s, unemployment of young<br />
people (15-25 years of age) and elderly unemployed (> 50 years of age).<br />
To beg<strong>in</strong>, Table 3.7 summarises the development of the overall unemployment rate<br />
<strong>in</strong> Austria, Styria and Upper Styria. The unemployment rate represents the share of<br />
unemployed <strong>in</strong> the total number of employees plus the no. of unemployed.<br />
The unemployment rate rose <strong>in</strong> Upper Styria from 2,8% <strong>in</strong> 1981 to 8,1% <strong>in</strong> 1991. In<br />
1998, the rate settled at 8,5% after an all year high of 10,2% <strong>in</strong> 1993. With<strong>in</strong> the<br />
same period, the unemployment rate at Styrian level was 2,9% (1981) and rose to<br />
7,1% (1991). After an all time high of 8,1 % <strong>in</strong> 1993 and repeatedly <strong>in</strong> 1996, the rate<br />
slightly improved to 8,1% <strong>in</strong> 1998.<br />
Table 3.7 Unemployment Rate 1981-1998<br />
Unemployment Rate <strong>in</strong> % (1981-1998)<br />
1981 1986 1987 1988 1989 1990 1991 1992 1993 1994 1995 1996 1997 1998<br />
Austria 2,4 5,2 5,6 5,3 4,6 4,9 5,3 5,9 6,8 6,5 6,4 7,0 7,1 7,2<br />
Styria 2,9 6,0 6,5 6,5 6,1 6,4 7,1 7,4 8,4 8,1 8,2 8,4 8,1 8,1<br />
Upp. Styria 3,2 5,5 6,0 5,9 5,7 6,7 8,1 9,0 10,2 9,8 9,5 9,3 8,7 8,5<br />
Bruck 3,0 6,1 6,7 6,5 6,0 7,9 9,7 10,7 12,0 11,5 11,1 10,3 9,5 8,8<br />
Judenbg. 3,0 5,2 5,3 5,4 5,1 5,8 6,6 7,5 9,0 8,8 8,7 9,0 8,6 8,7<br />
Knittelfd. 3,0 5,4 5,9 5,5 6,1 5,7 6,5 8,0 9,5 9,0 8,9 8,5 8,6 8,4<br />
Leoben 5,2 5,4 6,1 6,6 7,0 8,9 10,7 11,2 11,5 10,0 9,4 8,8 7,3 7,0<br />
Liezen 3,0 6,3 6,8 6,6 5,9 6,3 8,0 8,9 10,1 10,1 10,7 10,8 10,3 10,3<br />
Mürzz. 2,1 4,4 4,9 4,5 4,1 5,8 7,2 7,6 9,0 9,1 8,3 8,1 8,0 7,9<br />
Source: Haller et al (1994), AMS Stmk, AK Stmk.<br />
Due to its structural problems, the unemployment rate of the case study region is<br />
higher than the prov<strong>in</strong>cial average. More surpris<strong>in</strong>gly it was below Styrian average till<br />
1989. After 1989, growth rates of the unemployment rates of Styria and Upper Styria<br />
respectively drifted apart. Accord<strong>in</strong>g to Ste<strong>in</strong>er/Wendner (1993) structural problems <strong>–</strong><br />
dat<strong>in</strong>g back to the 1970s <strong>–</strong> were <strong>in</strong>visible with<strong>in</strong> the unemployment rate till 1989.<br />
S<strong>in</strong>ce 1989 a sharp rise could be observed.<br />
24
The situation <strong>for</strong> women on the labour market is different than the one <strong>for</strong> men.<br />
Female unemployment sharply rose <strong>in</strong> Upper Styria from 4,0% <strong>in</strong> 1981 to 11,5% <strong>in</strong><br />
1991. Compared to the prov<strong>in</strong>cial level, female unemployment rose from 3,2% to<br />
8,6% dur<strong>in</strong>g the same time span. The rate as well as the growth path of<br />
unemployment <strong>in</strong> Upper Styria was constantly higher than <strong>in</strong> Styria dur<strong>in</strong>g the<br />
exam<strong>in</strong>ed period. In contradiction to the male reaction pattern, no sudden change<br />
occurred <strong>in</strong> 1989 (see Ste<strong>in</strong>er/Wendner, 1993, p.15).<br />
Summarised, the problems of OIA‘s are expressed earlier <strong>in</strong> employment figures<br />
rather than <strong>in</strong> unemployment rates. While the unemployment-rate overrode Styrian<br />
levels only <strong>in</strong> 1989, employment-figures decreased already above-average dur<strong>in</strong>g<br />
the early 1980s.<br />
Table 3.8 summarises the situation dur<strong>in</strong>g the 1990s: it presents the percentile<br />
change of employment, unemployment and unemployment-rate between 1991 and<br />
1998 (<strong>in</strong> column 1 & 2). The third column presents the quotient (Upper Styria/Styria)<br />
<strong>for</strong> the three assessed <strong>in</strong>dicators. A value of 1 signals a same percentile change <strong>in</strong><br />
Upper Styria and Styria respectively. In the case of employment, a value greater than<br />
1 signals a stronger - positive - reaction (percentile change) <strong>in</strong> the OIA. In the case of<br />
the unemployment data, the opposite is true: a value below 1 signals a weaker<br />
reaction, i.e. a positive development of unemployment <strong>in</strong> Upper Styria:<br />
Table 3.8 Employment <strong>–</strong> Unemployment 1991/1998<br />
<strong>Change</strong> <strong>in</strong> % Upper Styria Upper Styria/<br />
between 1991-1998 Styria Styria<br />
Employment 2,7 0,3 9<br />
Unemployment (absolute) 104,7 119,7 0,9<br />
Unemployment rate 104,9 114,1 0,9<br />
Source: Haller et al. (1994), AK Stmk. (1998) and WIBIS.<br />
Employment <strong>in</strong> Upper Styria per<strong>for</strong>med well between 1991 and 1998. With a quotient<br />
of 9, i.e. employment grew 9 times higher <strong>in</strong> Upper Styria than <strong>in</strong> Styria, it was far<br />
above Styrian average. Unemployment <strong>in</strong> absolute numbers changed stronger on<br />
25
Styrian rather than case study regional level. Even the unemployment rate (+4,9<br />
percentile change) <strong>in</strong> Upper Styria developed better than it did <strong>in</strong> the whole prov<strong>in</strong>ce.<br />
Age structure of unemployment<br />
Tak<strong>in</strong>g a closer look on the specific age structure of unemployment, the number of<br />
age groups has been summarised to three ma<strong>in</strong> groups:<br />
1. Youth 15-25 years of age<br />
2. Middle-Aged 25 and 50 years of age (summed up from AMS data)<br />
3. Elderly over 50 years of age<br />
The situation of young people on the labour market results from a data-comb<strong>in</strong>ation<br />
of youth (under 25 years) and apprenticeship-data.<br />
S<strong>in</strong>ce unemployed over 50 years of age <strong>in</strong>creas<strong>in</strong>gly have to face problems of<br />
re<strong>in</strong>tegration, data of elderly unemployed (over 50 years of age) will be analysed as<br />
well.<br />
Table 3.9 Youth Unemployment<br />
Share of Young Unemployed (15-25 years of age) <strong>in</strong> Total Unemployment <strong>in</strong> %<br />
1991 1992 1993 1994 1995 1996 1997 1998<br />
Upper Styria 23,4 20,0 18,9 17,9 17,0 17,7 17,5 16,8<br />
Styria 24,7 22,0 20,9 19,3 18,7 18,6 18,1 17,5<br />
Austria 21,6 19,5 18,7 17,2 16,9 16,9 16,3 15,3<br />
Source: AMS Austria.<br />
The present situation (1998) consists of a relatively low share of youth<br />
unemployment <strong>in</strong> Upper Styria (16,8%). In contradiction to Styria (17,5%), it is 0,7<br />
percentage-po<strong>in</strong>ts below the prov<strong>in</strong>cial average share. If the case study region-level<br />
is compared with the federal average (15,3%) its relatively higher share of youthunemployment<br />
becomes visible.<br />
26
In the group of middle-aged, Upper Styria’s unemployment share (63,6%) is <strong>in</strong> l<strong>in</strong>e<br />
with Austrian (63,7%) and little below Styrian (65,8%) average.<br />
Special attention should be given to the group of elderly unemployed:<br />
Table 3.10 Unemployment of elderly persons (> 50 years of age)<br />
Share of Elderly Unemployed (> 50 years) <strong>in</strong> total unemployment <strong>in</strong> %<br />
1987 1989 1991 1993 1995 1997 1998<br />
Upper Styria 7,2 18,6 29,0 32,3 27,0 20,1 19,6<br />
Styria 8,4 12,1 17,4 20,6 17,7 15,5 16,7<br />
Austria 18,1 12,7 17,4 18,7 18,9 21,0<br />
Source:AMS Styria, Ste<strong>in</strong>er/Wendner (1993), WIBIS.<br />
In 1987, the share of elderly unemployed <strong>in</strong> Upper Styria was below Styrian and<br />
Austrian average. The situation changed <strong>for</strong> the worse: between 1987 and 1991,<br />
unemployment figures saw sharp rises with exceptional <strong>in</strong>creases <strong>in</strong> the case study<br />
region from 7,2% to 29%. On prov<strong>in</strong>cial level, <strong>in</strong>creases were not as sharp but the<br />
share of elderly unemployed more than doubled with<strong>in</strong> the time span. Reductions of<br />
employment through policy <strong>in</strong>struments of early-retirement schemes or special<strong>in</strong>centive<br />
programs have been found <strong>in</strong>adequate <strong>for</strong> the second half of the 1980s.<br />
After those dramatic structural changes <strong>in</strong> the distribution of unemployment, Upper<br />
Styria figures turned out well dur<strong>in</strong>g the 1990s. With a share of 19,6% <strong>in</strong> 1998, the<br />
OIA could improve the share by 9,4 percentage po<strong>in</strong>ts. The overall Styrian share<br />
rema<strong>in</strong>ed nearly constant (16,7%) between 1991 and 1998. The OIA’s successfigure<br />
becomes more visible if it is compared to Austrian average: the total share of<br />
elderly unemployed had risen from 17,4% (1991) to 21% <strong>in</strong> 1998.<br />
After a dramatic rise <strong>in</strong> the share of elderly unemployed dur<strong>in</strong>g the 1980s and early<br />
90s, Upper Styria’s figures were improv<strong>in</strong>g between 1991 and 1998.<br />
27
Table 3.11 Long Term Unemployment<br />
Long Term Unemployed (> 12 months)<br />
1993 1994 1995 1996 1997 1998<br />
Styria 7.393 7.977 7.929 7.367 6.947 6.368<br />
Upper Styria 4.001 4.305 4.075 3.414 2.964 2.515<br />
Bruck/Mur 1.142 1.229 1.177 963 867 694<br />
Judenburg 447 498 436 368 356 385<br />
Knittelfeld 303 316 297 260 248 202<br />
Leoben 1.011 968 815 650 449 196<br />
Liezen 697 801 828 761 717 767<br />
Mürzzuschlag 401 493 522 412 327 271<br />
Source: AK, WIBIS.<br />
Analys<strong>in</strong>g long-term unemployment, i.e. persons rema<strong>in</strong><strong>in</strong>g unemployed over a<br />
period of at least 12 months, the total number decreased by -1.025 or <strong>–</strong>13,9% <strong>in</strong><br />
Styria between the exam<strong>in</strong>ation period 1993 and 1998. Focus<strong>in</strong>g on the s<strong>in</strong>gle case<br />
study districts, a significant regional variation <strong>in</strong> long-term unemployment figures<br />
becomes obvious. An outstand<strong>in</strong>g decrease of its long term unemployment could be<br />
noted <strong>in</strong> Leoben (-80%). Bruck/Mur (-39,2%) and Mürzzuschlag (-32,4%) also<br />
per<strong>for</strong>med well. In relation to prov<strong>in</strong>cial changes, Upper Styria saw a reduction of <strong>–</strong><br />
37,1% between 1993 and 1998.<br />
Fig. 3-3 Average Duration of Unemployment <strong>in</strong> weeks<br />
25,0<br />
20,0<br />
18,8 19,1<br />
20,3<br />
19,0<br />
23,8<br />
22,0<br />
19,9 20,3<br />
19,8<br />
19,1<br />
21,0<br />
20,6<br />
20,6<br />
19,0<br />
15,0<br />
10,0<br />
Upper Styria<br />
Styria<br />
5,0<br />
0,0<br />
1991 1992 1993 1994 1995 1996 1997<br />
28
The average duration of unemployment saw constant <strong>in</strong>creases between 1991 and<br />
1994 <strong>in</strong> Styria and Upper Styria. In 1994, the gap between Upper Styria and Styria<br />
had <strong>in</strong>creased to 3 ½ weeks, i.e. unemployed rema<strong>in</strong>ed on average 3 ½ weeks<br />
longer unemployed <strong>in</strong> Upper Styria than on Styrian average. In 1995, the average<br />
unemployment duration decreased significantly by -4,7 week on average <strong>in</strong> Upper<br />
Styria.<br />
3.2.3 Economic and <strong>Industrial</strong> Structure<br />
3.2.3.1 Productivity<br />
Due to changes <strong>in</strong> the sectional employment dur<strong>in</strong>g the 1980s <strong>–</strong> with strong set offs<br />
<strong>in</strong> the metal <strong>in</strong>dustry (-12.000) (Tichy, 1994, p.26) <strong>–</strong> productivity could be raised.<br />
Were all case study region districts but Liezen below Styrian and Austrian average <strong>in</strong><br />
1983, figures had changed by 1990 when three districts’ Net Product Value<br />
(NPV)/Employee lay over Styrian and Austrian figures. The rise followed a fallback <strong>in</strong><br />
1994, putt<strong>in</strong>g Upper Styria below Austrian and leav<strong>in</strong>g only two districts above<br />
prov<strong>in</strong>cial average.<br />
Tichy (1994) analys<strong>in</strong>g Styrian census data, assumes a passive reorganisation due<br />
to a negative correlation between productivity and employment (p.26f.).<br />
29
Table 3.12 <strong>Industrial</strong> Productivity<br />
Productivity<br />
Industry<br />
NPV / Employee<br />
<strong>in</strong> 1.000 ATS 1983 1990 1994<br />
Bruck/Mur 330,5 514,8 702,6<br />
Judenberg 298,5 644,8 631,8<br />
Knittelfeld 272,5 494,5 493,0<br />
Leoben 409,2 607,1 863,9<br />
Liezen 435,0 491,5 536,1<br />
Mürzzuschlag 285,6 703,5 676,2<br />
Upper Styria 338,6 576,0 650,6<br />
Styria 343,3 528,3 665,5<br />
Austria 397,8 588,0 725,6<br />
Source: ÖSTAT; WIFO.<br />
3.2.3.2 Firm Formation<br />
A valuable <strong>in</strong>dicator <strong>for</strong> a region’s economic progress is the <strong>in</strong>tensity of firm<br />
foundations <strong>in</strong> the region. S<strong>in</strong>ce newly issued trade licences are not necessarily<br />
newly founded enterprises, these granted licences have been analysed <strong>in</strong> more<br />
detail by the Austrian Chamber of Commerce <strong>for</strong> the first time <strong>in</strong> 1999. S<strong>in</strong>ce every<br />
s<strong>in</strong>gle enterprise has to be an obligatory member of the Chamber of Commerce, the<br />
latter disposes of a wide pool of data. Accord<strong>in</strong>g to the Chamber, enterprises are<br />
regarded as newly founded, if two of three firm’s characteristic changes:<br />
• Title of firm,<br />
• Location,<br />
• Branch or <strong>in</strong>dustry.<br />
New membership data was also analysed accord<strong>in</strong>g to the declaration of bus<strong>in</strong>ess,<br />
i.e. if the new firm was declared as ma<strong>in</strong> bus<strong>in</strong>ess rather than branch or subsidiary.<br />
Only ma<strong>in</strong> bus<strong>in</strong>esses were regarded as newly founded enterprise and <strong>in</strong>cluded <strong>in</strong><br />
the statistics. The data available <strong>in</strong>cludes the period between 1993 and 1998 <strong>for</strong><br />
each political district.<br />
30
Table 3-13 Firm Foundation Intensity (<strong>in</strong> %) <strong>in</strong> Upper Styria 1993-1998.<br />
Firm Foundation Intensity<br />
1993 1994 1995 1996 1997 1998 1993-1998<br />
Styria 5,5 5,1 5,0 7,0 7,4 6,9 6,2<br />
Graz&Umgebung 7,2 5,9 5,4 7,9 9,0 7,8 7,3<br />
Upper Styria 5,1 4,6 4,8 6,2 6,6 6,5 5,7<br />
Bruck/Mur 5,9 4,0 4,8 6,8 7,1 6,9 5,9<br />
Judenburg 4,7 4,9 4,8 6,8 7,2 6,4 5,8<br />
Knittelfeld 5,4 5,0 5,8 6,2 6,7 7,2 6,1<br />
Leoben 5,0 4,3 4,0 5,8 7,1 5,8 5,4<br />
Liezen 4,9 4,4 4,6 5,5 5,3 4,8 4,9<br />
Mürzzuschlag 4,4 5,2 5,0 6,3 6,4 7,8 5,9<br />
Source: WK 1999.<br />
Focus<strong>in</strong>g on the <strong>in</strong>tensity of foundations, i.e. the percentage-share of newly founded<br />
enterprises <strong>in</strong> established bus<strong>in</strong>esses, the districts Mürzzuschlag and Knittelfeld saw<br />
constant <strong>in</strong>creases s<strong>in</strong>ce 1995. In 1998, those two districts experienced the highest<br />
<strong>in</strong>tensity of newly founded enterprises (7,8% and 7,2% respectively). Both districts,<br />
as well as Bruck/Mur (6,9%) per<strong>for</strong>med better than Styrian average (6,5%) <strong>in</strong> 1998.<br />
The overall development of the foundation <strong>in</strong>tensity <strong>in</strong> Upper Styria was slightly<br />
below prov<strong>in</strong>cial average but clearly below the agglomeration Graz & Environs<br />
between 1993 and 1998. In 1995, when Styria and Graz & Env. saw a low <strong>in</strong> their<br />
relative foundation numbers, Upper Styria’s foundation <strong>in</strong>tensity grew constantly<br />
between 1994 and 1997, with only a slight decrease <strong>in</strong> 1998 (-0,1 percentage-po<strong>in</strong>t).<br />
Fig. 3-4 Development of Foundation Intensity 1993-1998.<br />
Development - Foundation Intensity<br />
10,0<br />
9,0<br />
8,0<br />
7,0<br />
6,0<br />
5,0<br />
4,0<br />
3,0<br />
2,0<br />
1,0<br />
0,0<br />
1993 1994 1995 1996 1997 1998<br />
Styria<br />
Graz&Umgebung<br />
Upper Styria<br />
31
Fig. 3-5 Foundation Intensity <strong>in</strong> Upper Styria between 1993 and 1998<br />
Foundation Intensity - Political Districts (1993-1998)<br />
Mürzzuschlag<br />
Liezen<br />
Leoben<br />
4,9<br />
5,4<br />
5,9<br />
Styrian<br />
Average 6,2<br />
Knittelfeld<br />
6,1<br />
Judenburg<br />
Bruck/Mur<br />
5,8<br />
5,9<br />
Upper Styria<br />
Graz&Umgebung<br />
5,7<br />
7,3<br />
0,0 2,0 4,0 6,0 8,0<br />
3.3 Summary<br />
The applied <strong>in</strong>dicators <strong>in</strong> this section deliver <strong>in</strong> many cases the structural changes <strong>in</strong><br />
Upper Styria that occurred dur<strong>in</strong>g the last 20 years. Demographic and labour market<br />
<strong>in</strong>dicators proofed a strong decl<strong>in</strong>e <strong>in</strong> employment numbers not only due to early<br />
retirement programs but to bra<strong>in</strong> dra<strong>in</strong> from the case study region between 1981 and<br />
1991, i.e. outward migration of young people. However, latest data predict a<br />
turnaround of this trend.<br />
Focus<strong>in</strong>g on sectional employment, shifts from the primary and secondary- towards<br />
the tertiary sector could be observed, which almost compensated set-offs from the<br />
first two sectors. The trend towards the service sector was backed on a general<br />
movement towards higher education. With<strong>in</strong> the case study region, some political<br />
districts even shadowed the average growth rates of higher education on prov<strong>in</strong>cial<br />
level, although there are clear signs of uneven distribution of regional change <strong>in</strong><br />
qualification with<strong>in</strong> the case study region.<br />
Analys<strong>in</strong>g the unemployment rate surpris<strong>in</strong>gly a lower rate <strong>in</strong> the case study region<br />
compared to Styrian average till 1989 resulted <strong>–</strong> a relatively late reaction of the<br />
<strong>in</strong>dicator to the structural crises. Between 1991 and 1998, Upper Styria saw rises <strong>in</strong><br />
32
its unemployment data but its relative change was well below Styrian <strong>in</strong>creases. The<br />
age group of young unemployed (15-25 years of age) experienced less<br />
unemployment than on Styrian average but is still slightly higher than Austrian<br />
average. The opposite is true <strong>for</strong> elderly unemployed: their share of total<br />
unemployment is lower than Austrian average but higher than prov<strong>in</strong>cial average.<br />
All <strong>in</strong> all, the case study region (and its population) per<strong>for</strong>med well dur<strong>in</strong>g recent<br />
years. Fac<strong>in</strong>g a tremendous economic crisis with only a few dom<strong>in</strong>ant,<br />
monostructured enterprises, labour market data improved with<strong>in</strong> the last decade.<br />
Through higher qualification, a base <strong>for</strong> a structural change was given and service<br />
<strong>in</strong>dustry could compensate <strong>for</strong> lost jobs <strong>in</strong> the primary and secondary sector.<br />
Consider<strong>in</strong>g the demographic outlook <strong>for</strong> the next 20 years, which recently came<br />
under dispute and positive numbers were presented, there seems to be a possible<br />
compensation <strong>for</strong> the bra<strong>in</strong> dra<strong>in</strong> <strong>in</strong> Upper Styria dur<strong>in</strong>g the 1980s and there<strong>for</strong>e a<br />
basis <strong>for</strong> an optimistic susta<strong>in</strong>ed development with<strong>in</strong> the life cycle of the region.<br />
33
4- Strategies and <strong>in</strong>struments <strong>in</strong> support of reconversion<br />
4.1 Mergers and Concentration<br />
Mergers and concentration processes, especially dur<strong>in</strong>g the late 1970s and 1980s,<br />
have historically always been regarded as a solution to deal with crises and to<br />
overcome structural problems.<br />
Tichy (1994c) argues that the ability <strong>for</strong> structural change decreases s<strong>in</strong>ce nearly<br />
every merger is accompanied by a reduction of <strong>in</strong>dependent suppliers.<br />
Historically, the most important steps with<strong>in</strong> the concentration process <strong>in</strong> the Styrian<br />
iron <strong>in</strong>dustry can be dated over four centuries:<br />
1625 Creation of Innerberger Hauptgewerkschaft<br />
1829 Merger of Erzberg-ownerships <strong>in</strong>to public property<br />
1868 Concentration of Innerberger Hauptgewerkschaft towards a Public Limited<br />
Company (PLC)<br />
1881 Merger towards Alp<strong>in</strong>e-Montan-Company<br />
1973 Merger of Alp<strong>in</strong>e-Montan PLC and VÖEST PLC to VÖEST-Alp<strong>in</strong>e PLC<br />
1975 Merger of Schoeller-Bleckmann (see Tichy, 1994c, p. 18f.).<br />
The dom<strong>in</strong>ant strategy dur<strong>in</strong>g the 1960s, 70s and early 80s was the search <strong>for</strong><br />
economies of scale through vertical and horizontal <strong>in</strong>tegration. This centralisation<br />
process was accompanied by a concentration of headquater functions <strong>in</strong> Vienna.<br />
Plants <strong>in</strong> Upper Styria came under “external” control. In most cases, plann<strong>in</strong>g,<br />
R&D and market<strong>in</strong>g/distribution functions, i.e. those responsible <strong>for</strong> the monitor<strong>in</strong>g<br />
of markets and technology were lost (see Tödtl<strong>in</strong>g/Sedlacek, 1997, p. 50).<br />
More recently, not only steel-produc<strong>in</strong>g <strong>in</strong>dustry but also steel trade became subject<br />
of mergers. In 1976, four large and <strong>in</strong>dependent steel traders were merged and<br />
taken over by the VÖEST-Alp<strong>in</strong>e Steel Trade.<br />
This merger processes have been criticised <strong>in</strong> the literature. Aig<strong>in</strong>ger (1986) argues<br />
that one reason <strong>for</strong> the steel crisis <strong>in</strong> Upper Styria were those excessive mergers<br />
with<strong>in</strong> the <strong>in</strong>dustry. All preconditions <strong>for</strong> success, e.g. impartiality, <strong>in</strong>dependence etc.,<br />
have been disregarded. He further po<strong>in</strong>ts out the uncritical belief <strong>in</strong> advantages of<br />
34
large-scale enterprises and <strong>–</strong> technology (economies of scale). Aig<strong>in</strong>ger also notes<br />
the decision-mak<strong>in</strong>g process <strong>in</strong> conjunction with mergers. After management had left<br />
the region and be centralised <strong>in</strong> Vienna and ownership had changed to “permissive”<br />
public ownership, no emphasis was put on productivity, salaries raised to aboveaverage<br />
levels <strong>in</strong> relation to other regions and the easier (political) govern<strong>in</strong>g of a<br />
centralised group (Aig<strong>in</strong>ger, 1986, p. 498ff; cited <strong>in</strong> Hwaletz et al., 1991, p. 47).<br />
4.2 Decentralisation<br />
The strategies of mergers, vertical and horizontal <strong>in</strong>tegration to deal with crises were<br />
abandoned dur<strong>in</strong>g the second half of the 1980s.<br />
In 1986, a new executive board <strong>in</strong> the VÖEST-Alp<strong>in</strong>e plc - the nationalised steel<br />
group compris<strong>in</strong>g the largest steel manufactures <strong>in</strong> Austria <strong>–</strong> launched an extensive<br />
analysis of the organisational and operative structures of the group. This analysis<br />
resulted <strong>in</strong> the “VAN”-concept (VÖEST-Alp<strong>in</strong>e-New) and affected Upper Styria with<br />
its large steel <strong>in</strong>dustry as well. Only one year later, <strong>in</strong> 1987, four sp<strong>in</strong>-offs of large<br />
VÖEST-companies followed, three of them located <strong>in</strong> the case study region: The<br />
VÖEST Alp<strong>in</strong>e Stahl Donawitz Ltd. (LD-semif<strong>in</strong>ished material <strong>for</strong> the Group<br />
companies) , Stahlrohr K<strong>in</strong>dberg Ltd. (ready-to-<strong>in</strong>stall oil and gas field pipes) and<br />
Judenburg Ltd. became <strong>in</strong>dependent legal corporations with management that was<br />
shifted back <strong>in</strong>to the region.<br />
After “experiments” regard<strong>in</strong>g product range dur<strong>in</strong>g the concentration phase <strong>in</strong> the<br />
1970s and 1980s, the focus was put back on the group’s core-competencies rather<br />
than a wide product range with low competitive advantages.<br />
In 1993, the VÖEST-Alp<strong>in</strong>e Stahl Plc II <strong>–</strong> the parent company of the ma<strong>in</strong> and<br />
dom<strong>in</strong>ant steel enterprises <strong>in</strong> Upper Styria <strong>–</strong> focused on 3 ma<strong>in</strong> divisions:<br />
- Flat Product Division<br />
- Long Product Division<br />
- Sales Division<br />
Organisationally, the Flat Product Division was located and concentrated <strong>in</strong> Upper<br />
Austria, focus<strong>in</strong>g on rolled steel products and surface treated flat steel products with<br />
35
several patented applications (e.g. electrolytically coated, organically coated or hot<br />
dip metal coated).<br />
The Long Product Division comprises Upper Styrian enterprises’, all grouped and<br />
embedded <strong>in</strong> geographical proximity to each other. The Division <strong>in</strong>cludes the<br />
VÖEST-Alp<strong>in</strong>e-Schienen Ltd. (rail), Stahl Donawitz Ltd. (see above), Austria Draht<br />
Bruck/Mur (wires) and Stahlrohr K<strong>in</strong>dberg (steel-pipes). The Alp<strong>in</strong>e-Schienen Ltd. <strong>for</strong><br />
example early recognised the high demand of western European railroads <strong>for</strong> highspeed<br />
rails. It now sets standards e.g. with the manufacture of ultra-long, weld free<br />
railroad rails at lengths of up to 120 metres or head special hardened qualities (see<br />
Annual Report VÖEST-Alp<strong>in</strong>e Stahl AG, 1998/99).<br />
Those partly privatised and reorganised enterprises rega<strong>in</strong>ed some decision-mak<strong>in</strong>g<br />
functions <strong>in</strong> the process of decentralisation with<strong>in</strong> the group. In Upper Styria,<br />
restructur<strong>in</strong>g resulted <strong>in</strong> substantial unemployment and some plant closures (see<br />
Tödtl<strong>in</strong>g/Sedlacek, 1997, p.50).<br />
4.3 Improvement of Infrastructure<br />
4.3.1 Enterprise Support Institutions<br />
Based on the Obersteiermarkstudie (a broad an <strong>in</strong>novative economic analysis of the<br />
problems of Upper Styria, commissioned by the prov<strong>in</strong>ce of Styria and the Federal<br />
Chancellery, ÖIR et al. 1982), a broad net of research- and technological<br />
<strong>in</strong>frastructure was <strong>in</strong>stalled <strong>in</strong> the late 1980s. Although the success of these<br />
<strong>in</strong>stitutions could not always be judged, successful <strong>in</strong>stitutions could be identified<br />
when their activities were oriented towards regional enterprises with their specific<br />
demand and capacities. Further success <strong>in</strong>dicators are present qualification- and<br />
vocational tra<strong>in</strong><strong>in</strong>g <strong>in</strong>stitutions (Niklasdorf) as well as motivated key actors.<br />
The great number of facilities calls <strong>for</strong> a more co-ord<strong>in</strong>ated division of labour. Ste<strong>in</strong>er<br />
et al. (1993) propose a stronger co-operation and network<strong>in</strong>g of these <strong>in</strong>stitutions.<br />
They po<strong>in</strong>t out present co-operations, e.g. the relocation of established enterprises<br />
from one enterprise support <strong>in</strong>stitution to the other (<strong>in</strong> this case Niklasdorf, a<br />
Technology Centre to Kapfenberg, a Bus<strong>in</strong>ess Incubator) or supportive technology<br />
36
transfer between Joanneum Research, TTZ Leoben (see below) and the<br />
Montanuniversity Leoben, as well as lack<strong>in</strong>g co-operation between Niklasdorf and<br />
the Montanuniversity (Ste<strong>in</strong>er et al., 1993, p.51).<br />
Among these enterprise support <strong>in</strong>stitutions, the first have already been <strong>in</strong>stalled<br />
dur<strong>in</strong>g the second half of the 1980s.<br />
The Technology-Transfer-Centre Leoben (TTZ) was founded <strong>in</strong> 1986 with the<br />
<strong>in</strong>tention to implement environmental-techniques as promis<strong>in</strong>g regional susta<strong>in</strong>ment<br />
<strong>for</strong> endogenous foundations of SMEs. Early they experienced that the proposed<br />
technology was part of large enterprises and only useful <strong>in</strong> parts <strong>for</strong> SMEs. On the<br />
other side, <strong>in</strong>novative foundations of SMEs <strong>in</strong> the metal-, electronic-, mechanical<br />
eng<strong>in</strong>eer<strong>in</strong>g- and plastics <strong>in</strong>dustry had strong demand <strong>for</strong> technological- and<br />
management consultation. The TTZ reacted and reoriented itself based on the SMEs<br />
demand and focused on an advisory board <strong>for</strong> technology and management <strong>for</strong><br />
present and newly founded enterprises with the goal of modernis<strong>in</strong>g economic<br />
structures <strong>in</strong> Upper Styria.<br />
The TTZ consists of several <strong>in</strong>stitutions:<br />
• Office <strong>for</strong> external affairs of the Montanuniversity Leoben,<br />
• Branch office of the Science Centre Seibersdorf,<br />
• Branch office of the Styrian Technology Consultancy Technova and the<br />
• ÖAR <strong>–</strong> Regional Advice Upper Styria.<br />
The concrete work focuses on technology transfer and management advice <strong>for</strong><br />
SMEs. TTZ also <strong>in</strong>itiates project coord<strong>in</strong>ation between enterprises and research<br />
<strong>in</strong>stitutions. After the fifth year of its foundation, the TTZ had conducted 75 R&D<br />
projects <strong>for</strong> product- and process improvement and 80 projects regard<strong>in</strong>g foundationcounsell<strong>in</strong>g,<br />
management consult<strong>in</strong>g and project clear<strong>in</strong>g (See Ste<strong>in</strong>er et al., 1993, p.<br />
45f.).<br />
The Bus<strong>in</strong>ess Incubator Kapfenberg was founded <strong>in</strong> 1989. By 1993, a total of 9<br />
companies with 160 highly-skilled employees were present. S<strong>in</strong>ce its successive<br />
foundation <strong>in</strong> 1989, two or three enterprises jo<strong>in</strong>t every year. Enterprises do not get<br />
special consultation, a few are served by technology centre Niklasdorf.<br />
37
Foundations were partly endogenous, i.e. the share of founders from the region was<br />
25%, partly only extensions (branches of exist<strong>in</strong>g firms with another location, 15%) or<br />
relocations (40%).<br />
Focus<strong>in</strong>g on bus<strong>in</strong>ess park estate, the Technology Centre Kapfenberg was<br />
established <strong>in</strong> 1993 with production halls <strong>for</strong> qualified young enterprises. Focal po<strong>in</strong>ts<br />
are new materials, laser technology and <strong>in</strong>dustrial <strong>in</strong>stallation to cont<strong>in</strong>ue with the<br />
tradition of metal process<strong>in</strong>g and mechanical eng<strong>in</strong>eer<strong>in</strong>g <strong>in</strong> Kapfenberg. Future<br />
projects <strong>in</strong>clude customised <strong>in</strong>dustrial <strong>in</strong>stallations <strong>for</strong> automation- and control<br />
systems. Every located enterprise has already <strong>in</strong>vented new technology or product<br />
<strong>in</strong>novation and devotes to cont<strong>in</strong>uous R&D (see Hartmann et al., 1997, p.28 and<br />
Ste<strong>in</strong>er et al., 1993, p. 46ff.).<br />
The Technology Centre Niklasdorf, founded <strong>in</strong> 1989 consists of a technology park,<br />
the WIFI Schulungszentrum Upper Styria (vocational <strong>in</strong>stitution of the Chamber of<br />
Commerce) and the Laser-Centre Upper Styria. Today it <strong>in</strong>cludes 12 enterprises plus<br />
further 5 which are externally located. Focal po<strong>in</strong>ts are new materials and electronic<br />
data-process<strong>in</strong>g, which were extended with laser technology. Key characteristics of<br />
the centre are service-, consultation- and assistance services as well as modern<br />
didactics <strong>in</strong> conjunction with the WIFI. Besides knowledge transfer, the centre<br />
emphasis on motivation and contacts (see Hartmann et al, 1997, p.24 and Ste<strong>in</strong>er et<br />
al, 1993, p. 48f.).<br />
The Unternehmerzentrum A.i.Z. Aichfeldzentrum (AIZ), an entrepreneurial centre and<br />
founded <strong>in</strong> 1989 consists of 16 enterprises with over 90 employees. It offers<br />
management- and f<strong>in</strong>ance consult<strong>in</strong>g and focuses on environmental technology and<br />
production-oriented services. Plans <strong>for</strong> further technological orientation and the<br />
development towards a technology- and <strong>in</strong>novation centre are present.<br />
The Joanneum Research Laser Centre Leoben, already founded <strong>in</strong> 1988, emphasis<br />
the <strong>in</strong>dustrial application of the laser technology. Process <strong>–</strong> and production systems<br />
are adopted <strong>in</strong> co-operation with the customers (Hartmann et al, 1997, p.32).<br />
38
Graphic 4.1 F&E Infrastructure <strong>in</strong> Styria<br />
R&D-Infrastructure <strong>in</strong> Styria<br />
(F<br />
Liezen<br />
Niklasdorf<br />
$B$B "A $B$B (F "A<br />
þ "<br />
(F$B (F (F<br />
$B<br />
"þ<br />
Bruck/Mur<br />
Leoben<br />
(F<br />
Mürzzuschlag<br />
Kapfenberg<br />
Objective areas<br />
Objective 2<br />
Objective 5b<br />
(F (F<br />
Zeltweg<br />
(F Foundationcentre<br />
(F Technologypark "A<br />
(F<br />
planned Extension "þ<br />
$B non univ. R&D-Infrastructure<br />
Tra<strong>in</strong><strong>in</strong>gcentre<br />
Technology-Transfer-Centre<br />
50 0 50 Kilometer<br />
N
4.3.2 Traffic Infrastructure<br />
Regard<strong>in</strong>g traffic <strong>in</strong>frastructure, road and rail projects have been speeded up dur<strong>in</strong>g<br />
the 1980s.<br />
For better regional “<strong>in</strong>com<strong>in</strong>g” and “outgo<strong>in</strong>g”, the accelerated construction of the A9<br />
Phyrn motorway brought last<strong>in</strong>g improvement <strong>for</strong> Upper Styria.<br />
In the north-western direction an important connection to agglomeration <strong>in</strong> Upper<br />
Austria and Southern Germany was <strong>in</strong>stalled, where only a little gap is still under<br />
construction.<br />
In the south-eastern direction, the centre of Graz and the state of Slovenia were<br />
connected through the A9 Phyrn motorway.<br />
Installed speedways ma<strong>in</strong>ly along the river valleys Mur and Mürz brought an<br />
important North-South connection between the metal-process<strong>in</strong>g centres <strong>in</strong> Upper<br />
Styria. Northerly, the speedway S6 Semmer<strong>in</strong>g towards the agglomeration of Vienna<br />
brought access to the A1 West- and A2 South motorway. Head<strong>in</strong>g South, the<br />
speedway S36 Murtal connects Knittelfeld and Zeltweg with the ma<strong>in</strong> traffic routes.<br />
Rail <strong>in</strong>frastructure projects <strong>in</strong>cluded the “Junction Upper Styria” <strong>for</strong> higher speed and<br />
capacities and a double-tracked extension of the “Schoberpass”, a mounta<strong>in</strong> pass<br />
connect<strong>in</strong>g Upper Styria with Upper- and West Austria and South Germany. A further<br />
project, the “Semmer<strong>in</strong>g Tunnel”, connect<strong>in</strong>g Upper Styria with Lower Austria <strong>for</strong><br />
higher speed and freight capacity, is under preparation.<br />
4.4 Improved In<strong>for</strong>mation Flow<br />
To describe the <strong>in</strong><strong>for</strong>mation flow between regional actors and relevant <strong>in</strong>stitutions, it<br />
must be noted that the prov<strong>in</strong>cial <strong>in</strong>dustrial policy is only partly “bottom up” and<br />
dependent on national policy as well. Despite political tensions, the federal and<br />
prov<strong>in</strong>cial levels have to cooperate and follow<strong>in</strong>g “division of labour” can be seen:<br />
• Research and most of the technology policy is ma<strong>in</strong>ly federal policy,<br />
• Firm related support (e.g. <strong>in</strong>vestment subsidies, tra<strong>in</strong><strong>in</strong>g etc.) is mostly prov<strong>in</strong>cial<br />
regional policy,<br />
40
• Special programs <strong>for</strong> lagg<strong>in</strong>g regions, labour market policy as well as larger<br />
<strong>in</strong>frastructure and transport projects are common policy.<br />
Regional economic development <strong>in</strong> Styrian regions is carried out by<br />
1) Prov<strong>in</strong>cial government<br />
2) Styrian <strong>Industrial</strong> Promotion Agency (Steirische Wirtschaftsförderungs GesmbH -<br />
SFG)<br />
3) Intermediary organisations such as WIFI (<strong>in</strong>dustrial promotion <strong>in</strong>stitute of the<br />
Chamber of Commerce), BFI (tra<strong>in</strong><strong>in</strong>g <strong>in</strong>stitute of the Chamber of Labour), ÖAR<br />
(organisation <strong>for</strong> endogenous regional development) and others (see<br />
Tödtl<strong>in</strong>g/Sedlacek, p. 56).<br />
Besides those <strong>in</strong>stitutions, further enterprise support <strong>in</strong>stitutions were needed to<br />
improve the <strong>in</strong><strong>for</strong>mation flow. The Technology Transfer Centre (TTZ) Leoben <strong>for</strong><br />
example was among the first created <strong>in</strong>stitutions <strong>in</strong> 1986 (see 4.3.1).<br />
Through the reorganisation of the economic development policy <strong>in</strong> the early 1990s,<br />
the Styrian <strong>Industrial</strong> Promotion Agency (Steirische<br />
Wirtschaftsförderungsgesellschaft - SFG) was founded <strong>in</strong> 1991. It acts as an<br />
<strong>in</strong>dependent, semi-public regional development agency, owned, controlled and<br />
f<strong>in</strong>anced by the prov<strong>in</strong>cial government. It has the goal to improve the conditions <strong>for</strong><br />
economic development <strong>in</strong> Styria and to support disadvantaged areas.<br />
Together with its subsidiary Innof<strong>in</strong>anz, it not only plans, builds and supports<br />
technology and entrepreneur centres <strong>in</strong> Styria, but also acts as a service agency,<br />
support<strong>in</strong>g <strong>in</strong>novative activities, provid<strong>in</strong>g direct f<strong>in</strong>ancial <strong>in</strong>centives <strong>in</strong>cl. seed capital,<br />
subsidies <strong>for</strong> project costs, new start-up premiums and consultancy.<br />
Further tasks are <strong>in</strong> the area of regional development, start-up of new firms, firms <strong>in</strong><br />
the phase of growth, technology transfer, attraction of <strong>in</strong>vestment and tra<strong>in</strong><strong>in</strong>g (see<br />
Tödtl<strong>in</strong>g/Sedlacek, p. 57 and SFG).<br />
Geldner (1995) evaluat<strong>in</strong>g the SFG’s support activities of “enterprises <strong>in</strong> growth” <strong>in</strong><br />
1993/94 identified follow<strong>in</strong>g strategy of the SFG: back<strong>in</strong>g the strong with emphasis<br />
on <strong>in</strong>novations <strong>in</strong> technical and organisational fields (Geldner 1995, cited <strong>in</strong>: Geldner<br />
1998, p. 171).<br />
41
Besides the SFG and earlier mentioned <strong>in</strong>stitutions, further various k<strong>in</strong>ds of<br />
<strong>in</strong>termediary organisations exist. There are federal policies agencies such as the<br />
WIFI (see above) and the AMS (Labour Market Service), both hav<strong>in</strong>g establishments<br />
directly <strong>in</strong> the case study region.<br />
Besides those two, there are federal public, semi-public and private <strong>in</strong>termediary<br />
organisations active such as the ÖAR (organisation <strong>for</strong> endogenous regional<br />
development), BFI (tra<strong>in</strong><strong>in</strong>g <strong>in</strong>stitute of the Chamber of Labour, operat<strong>in</strong>g several<br />
branches <strong>in</strong> Upper Styria) or the ITF (Innovation & Technology Fund).<br />
In order to enhance cooperation, <strong>in</strong>clud<strong>in</strong>g <strong>in</strong><strong>for</strong>mation, education and consult<strong>in</strong>g<br />
activities, <strong>in</strong>stitutions such as the Austrian In<strong>for</strong>mation Centre <strong>for</strong> Cooperation, the<br />
BIT (International research and technology cooperations) or the APS (Cooperation<br />
between Universities and Enterprises) are present (see Tödtl<strong>in</strong>g/Sedlacek, 1995,<br />
p.57.).<br />
4.5 Support and creation of cooperation and networks<br />
A further step to improve the situation <strong>in</strong> Upper Styria was to create "territorial<br />
networks" and "competence clusters" as a tool to improve locational quality. Styria as<br />
the region with the most urgent problems of <strong>Old</strong> <strong>Industrial</strong> <strong>Areas</strong> was the first region<br />
to pursue deliberately such a cluster strategy. It was partly a strategy to create and<br />
support a new, albeit <strong>in</strong> some respects complementary, automobile cluster <strong>in</strong> the<br />
southern part of the region <strong>in</strong> addition to the old decl<strong>in</strong><strong>in</strong>g concentration of steel<br />
manufactur<strong>in</strong>g <strong>in</strong> the northern part of the country. This action was appropriate as<br />
some firms, a few of them even <strong>in</strong> dom<strong>in</strong>ant niches, already existed, but there was<br />
no network l<strong>in</strong>k<strong>in</strong>g them and an auto cluster is a good customer of steel and steel<br />
products. The promotion was quite successful. A network was <strong>for</strong>med between<br />
previously unconnected firms, partly situated <strong>in</strong> the old <strong>in</strong>dustrial area. The exist<strong>in</strong>g<br />
firms expanded, cooperation and specialization <strong>in</strong>creased, and <strong>for</strong>eign <strong>in</strong>vestment<br />
was attracted. To <strong>for</strong>m a cluster of previously unconnected firms and to upgrade the<br />
product was certa<strong>in</strong>ly good regional policy, particularly as a part of the cluster is<br />
based on top know-how <strong>in</strong> the construction of diesel eng<strong>in</strong>es and four-wheel-drive<br />
equipment (Tichy 1998).<br />
42
Yet the explicit aim of this cluster philosophy was more than a replacement and<br />
support of the old cluster: It was meant to "aim at empower<strong>in</strong>g entrepreneurs. By that<br />
we mean their ability to use global competition as an opportunity. To put it even more<br />
clearly: We would like to see <strong>in</strong>effective mechanisms of protection replaced by<br />
'upgrad<strong>in</strong>g' and entrepreunerial fitness. In achiev<strong>in</strong>g this goal, we regard the cluster<br />
philosophy, already a fixed element of the Styrian subsidy policy, to be a most<br />
appropriate <strong>in</strong>strument" (orig<strong>in</strong>al quotation by H.Paierl, regional m<strong>in</strong>ister <strong>for</strong><br />
Economic Policy of Styria, 1997, p.7).<br />
In do<strong>in</strong>g so this philosophy relies on the discrete charm of clusters, on the wellfounded<br />
assumption that regional specialization on <strong>in</strong>terl<strong>in</strong>ked activities of<br />
complementary firms (<strong>in</strong> production and service sectors) and their cooperation with<br />
public, semipublic and private research and development <strong>in</strong>stitutions creates<br />
synergies, <strong>in</strong>creases productivity, and leads to economic advantages. In l<strong>in</strong>e with<br />
Jacobs and de Man (1996) this is the third phase of <strong>in</strong>dustrial regional policy <strong>–</strong> after a<br />
first phase of "back<strong>in</strong>g losers" and a second of "pick<strong>in</strong>g w<strong>in</strong>ners" this is the next<br />
stage - "back<strong>in</strong>g the w<strong>in</strong>ner" - with a more modest ambition of comb<strong>in</strong><strong>in</strong>g the strong<br />
aspects of the previous phases (<strong>for</strong> an evaluation of the risks of such a strategy see<br />
Ste<strong>in</strong>er 1998).<br />
This "cluster philosophy" especially pronounced <strong>in</strong> Styria is ga<strong>in</strong><strong>in</strong>g an impetus of its<br />
own. Different <strong>for</strong>ms of cooperation and networks are emerg<strong>in</strong>g also <strong>in</strong> other sectors.<br />
Ste<strong>in</strong>er/Hartmann (1998) analysed l<strong>in</strong>ks and cooperations between SMEs <strong>in</strong> the<br />
material- and metal-process<strong>in</strong>g sector <strong>in</strong> Upper Styria. Through <strong>in</strong>tensive field<br />
research, close networks and value-cha<strong>in</strong> relations among 38 firms embedded <strong>in</strong><br />
regional networks and <strong>in</strong>terfirms l<strong>in</strong>ks (“mapp<strong>in</strong>g” of the cluster) could be identified.<br />
S<strong>in</strong>ce SMEs were either <strong>in</strong>tegrated or strongly dependent on large enterprises, no<br />
predef<strong>in</strong>ed cluster existed.<br />
Of special <strong>in</strong>terest were projects relat<strong>in</strong>g to learn<strong>in</strong>g activities <strong>in</strong> the cluster and<br />
networks and <strong>in</strong>terfirm l<strong>in</strong>ks react<strong>in</strong>g through the cluster. Two network structures and<br />
13 l<strong>in</strong>ks between the 38 firms were identified with strong elements of <strong>in</strong>terfirm<br />
learn<strong>in</strong>g. This is the more important because the decl<strong>in</strong>e of Upper Styria was to a<br />
large degree caused by an <strong>in</strong>ability to learn new <strong>for</strong>ms of behaviour and a<br />
preservation of old ones. The reported attempts to develop a culture of learn<strong>in</strong>g<br />
among SMEs may be also <strong>in</strong>terpreted as a regional process of "unlearn<strong>in</strong>g" old<br />
43
habits (someth<strong>in</strong>g that is harder than learn<strong>in</strong>g new ones). There<strong>for</strong>e, SME cluster<br />
creates <strong>for</strong> the region as a whole positive spill-over and demonstration effects as to<br />
the importance of jo<strong>in</strong>t learn<strong>in</strong>g.<br />
These cluster firms are embedded <strong>in</strong> a rich environment These cluster firms are<br />
embedded <strong>in</strong> a rich environment of enterprise support<strong>in</strong>g <strong>in</strong>stitutions. Examples of<br />
research, technology and development <strong>in</strong>stitutions are the Montanuniversity Leoben,<br />
Christian Doppler Laboratories, Joanneum Research and the Technology Transfer<br />
Centre <strong>in</strong> Leoben. In addition, several tra<strong>in</strong><strong>in</strong>g <strong>in</strong>stitutions ensure transfer of new<br />
knowledge to the firms.<br />
4.6 Towards a regional Innovation system <strong>in</strong> Styria<br />
A so far last step <strong>in</strong> the process of reconversion of this old <strong>in</strong>dustrial area is the<br />
attempt to <strong>in</strong>tegrate it <strong>in</strong> the comb<strong>in</strong>ed strategies and <strong>in</strong>struments of a national and<br />
regional <strong>in</strong>novation system. Innovation is now understood to be an iterative<br />
<strong>in</strong>teraction between a wide range of actors <strong>in</strong>clud<strong>in</strong>g research organisations, firms,<br />
policy providers and the market. This is a very different understand<strong>in</strong>g to the <strong>for</strong>mer<br />
l<strong>in</strong>ear model which supposed a series of clear phases from concept development to<br />
product launch. The new model of <strong>in</strong>novation is considerably more complex <strong>in</strong>volv<strong>in</strong>g<br />
a greater number of actors and focus<strong>in</strong>g as much on relationships and the operation<br />
of systems and networks as on the <strong>in</strong>dividual actors themselves. Further, research<br />
<strong>in</strong>to the process of learn<strong>in</strong>g and knowledge transfer also identifies much knowledge<br />
as tacit and collective and there<strong>for</strong>e l<strong>in</strong>ked it to its human and social context. Taken<br />
together, these concepts br<strong>in</strong>g <strong>in</strong>to sharper focus the role of the social environment<br />
with<strong>in</strong> which <strong>in</strong>novation actors operate.<br />
This approach puts more emphasis on activities on a regional and local level. The<br />
exceptional feature of the regional level of policy mak<strong>in</strong>g is the fact that the region<br />
can provide a more appropriate spatial dimension <strong>for</strong> the design and implementation<br />
of elements of technology and/or <strong>in</strong>novation policy. The potential benefits of regional<br />
policy derive either from a greater knowledge of the relevant characteristics of the<br />
local economy or from the establishment of a local network and <strong>in</strong>stitutions which<br />
44
have a direct <strong>in</strong>terest <strong>in</strong> the success of programmes and policies. (Joanneum<br />
Research/European Policies Research Centre, 1998).<br />
The activities <strong>for</strong> Upper Styria are now strongly embedded <strong>in</strong> a general strategy to<br />
"upgrade" Styria's economy by means of an explicit Technology and <strong>in</strong>novation<br />
oriented policy. The "Styrian Technology Policy Concept", elaborated by Joanneum<br />
Research (see Ste<strong>in</strong>er et al. 1996) proposes three ma<strong>in</strong> strategies:<br />
(1) cooperation,<br />
(2) absorption and diffusion,<br />
(3) quality and qualification<br />
Regard<strong>in</strong>g cooperation, the <strong>in</strong>tention is to reduce barriers by focus<strong>in</strong>g on <strong>in</strong>dustrial<br />
clusters, creat<strong>in</strong>g synergy effects <strong>for</strong> the firms and provid<strong>in</strong>g a common<br />
<strong>in</strong>frastructure. In addition to the strengthen<strong>in</strong>g of traditional clusters (materials &<br />
metals, wood & papers, vehicles), new environment activities (an “eco-cluster”)<br />
should be built up and supported.<br />
The strategy of absorption and diffusion of new technologies <strong>in</strong>tends to en<strong>for</strong>ce<br />
regional competitiveness, especially the quality of goods and services and<br />
productivity. In<strong>for</strong>mation deficits about new technology or the lack of technical and<br />
managerial qualifications <strong>for</strong> adaptation should be lowered <strong>for</strong> SMEs.<br />
The quality and qualification goal focuses <strong>in</strong> a cont<strong>in</strong>uous adaptation of production<br />
technologies and an <strong>in</strong>novation oriented qualification of staff members. A better<br />
<strong>in</strong>tegration of learn<strong>in</strong>g is <strong>in</strong>tended but also cluster specific qualification strategies<br />
have to be developed.<br />
In this context Upper Styria has - with its <strong>in</strong>novative firms, potential clusters and<br />
proximity to varied knowledge suppliers <strong>in</strong> <strong>for</strong>m of three Universities, various<br />
Technology Centres and Research Institutions - strong elements <strong>for</strong> a dynamic<br />
“regional <strong>in</strong>novation system”. Only the degree of systemness needs to be clarified<br />
and further explored.<br />
45
5- <strong>Lessons</strong> to be drawn?<br />
(still to be completed)<br />
The history, the empirical analysis, theoretical foundations and policy strategies of<br />
OIAs - <strong>in</strong> the specific case of Styria, but <strong>in</strong> other cases as well (<strong>for</strong> a recent overview<br />
of comparable regions and analyses see e.g. Boschma/Lambooy 1999) - may they<br />
serve <strong>for</strong> an <strong>in</strong>terpretation <strong>for</strong> processes of change <strong>in</strong> the countries <strong>in</strong> transition?<br />
Let us first summarize what lessons are drawn from the experience and attempts of<br />
reconversion of OIAs per se:<br />
1) Structural change is unavoidable, also (and especially) <strong>in</strong> a grow<strong>in</strong>g economy.<br />
OIAs were <strong>for</strong> a long time prosperous regions with a grow<strong>in</strong>g output; yet this<br />
growth destroyed the conditions <strong>for</strong> survival - the successful products stayed too<br />
long with<strong>in</strong> the region. If the age<strong>in</strong>g product cannot leave the region, it changes<br />
the region <strong>for</strong> worse - it b<strong>in</strong>ds its resources which usually are used to f<strong>in</strong>d new<br />
products and processes. Monostructure is then a result - not a cause - of its<br />
behaviour.<br />
2) The <strong>in</strong>complete adjustment process is ma<strong>in</strong>ly a problem of <strong>in</strong><strong>for</strong>mation and<br />
negligence of relevant signals. Structural change there<strong>for</strong>e hardly comes from<br />
with<strong>in</strong> (from the "market"), but is <strong>for</strong>ced from outside (from "policy").<br />
3) Decision makers <strong>in</strong>side the region (management, unions, politicians) there<strong>for</strong>e do<br />
not act, but react - mostly by further concentration and fusion, by clos<strong>in</strong>g <strong>in</strong>, with<br />
strong elements of rent seek<strong>in</strong>g nurtured by fear lead<strong>in</strong>g to collusive behaviour.<br />
4) The process of reconversion is a time consum<strong>in</strong>g process <strong>in</strong>clud<strong>in</strong>g several steps<br />
and a sequence of different <strong>in</strong>struments used. It is not done by means of a "big<br />
bang" lead<strong>in</strong>g to sudden closures and redundancies. Even from an economic<br />
po<strong>in</strong>t of view this would be counterproductive lead<strong>in</strong>g to discouragement. A<br />
change <strong>in</strong> mentality - learn<strong>in</strong>g and rebuild<strong>in</strong>g - needs long phases of life. So<br />
<strong>in</strong>stitutions have to be found which are able to give time (it took Upper Styria<br />
about 20-30 years to manage the process of reconversion).<br />
5) The market is not capable of deliver<strong>in</strong>g this process.<br />
46
Are these lessons applicable to structural problems of countries <strong>in</strong> transition? The<br />
ma<strong>in</strong> arguments aga<strong>in</strong>st the transferability of policies and strategies may be the<br />
follow<strong>in</strong>g:<br />
1) The countries <strong>in</strong> transition are faced with a completely different situation - they (or<br />
parts of them) are not old <strong>in</strong>dustrial areas but they suffer from an economy not<br />
yet adjusted to normal market situations.<br />
2) If there are comparable problems they are rather sectorspecific than regional - as<br />
a consequence strategies should be aimed at specific sectors and <strong>in</strong>dustries not<br />
at regions.<br />
3) There is no specific need <strong>for</strong> a targeted policy, neither to sectors nor to regions, a<br />
general strategy to support the transition to a market economy will suffice.<br />
Yet there are several strong arguments <strong>in</strong> favour of lessons to be draw from this<br />
"western" experience:<br />
1) The so-called countries <strong>in</strong> transition are not countries <strong>in</strong> transition any more.<br />
2) Problems of a lack<strong>in</strong>g adaptability are not problems of sectors and of<br />
monostructure.<br />
3) A specific policy focussed on the regionally concentrated structural problems<br />
rema<strong>in</strong>s necessary and calls <strong>for</strong> a well designed mixture of <strong>in</strong>stitutions giv<strong>in</strong>g the<br />
right <strong>in</strong>centives, pass<strong>in</strong>g on the relevant <strong>in</strong><strong>for</strong>mation and allow<strong>in</strong>g <strong>for</strong> the<br />
necessary time.<br />
47
Acknowledgements: This paper is partly supported by research connected with the<br />
"Inco-Copernicus" jo<strong>in</strong>t research project "Modernization of Traditional Industries <strong>in</strong><br />
Countries <strong>in</strong> Transition on the Basis of the Knowledge from the Restructur<strong>in</strong>g of <strong>Old</strong><br />
<strong>Industrial</strong> <strong>Areas</strong> <strong>in</strong> Austria and Germany" cof<strong>in</strong>anced by the European Commission. I<br />
would like to thank Christian Hartmann and Roland Hammer <strong>for</strong> assistance <strong>in</strong> the<br />
preparation and compilation of the empirical material.<br />
48
References<br />
Aig<strong>in</strong>ger, K. (1986), Ursachen und Perspektiven der Stahlkrise, <strong>in</strong>:<br />
Wirtschaftspolitische Blätter 5/86, Vienna, pp. 493-515.<br />
AK Steiermark (1998), Regionalstatistik Steiermark, Kammer für Arbeiter und<br />
Angestellte für Steiermark (ed.), Graz.<br />
Akerlof, G. A., Ma<strong>in</strong>, G. M. (1981), An Experience-weighted Measure of Employment<br />
and Unemployment Durations, American Economic Review, pp. 1003-1011.<br />
Boschma, R., Lambooy, J. (1999), Why Do <strong>Old</strong> <strong>Industrial</strong> Regions Decl<strong>in</strong>e? An<br />
Exploration of Potential adjustment Strategies, Paper presented at the 39 th<br />
Congress of the European Regional Science Association, Dubl<strong>in</strong>, Ireland.<br />
Brenton, P., Gros, D., Vandille, G. (1997), Output Decl<strong>in</strong>e and Recovery <strong>in</strong> the<br />
Transition Economies: Causes and Social Consequences, Vol. 5, pp. 113-130.<br />
Chenery, H. (1960), Patterns of <strong>Industrial</strong> Growth, American Economic Review, Vol.<br />
50, pp. 624-654.<br />
Chenery, H. (1969), The Process of <strong>Industrial</strong>ization, Harvard University Center <strong>for</strong><br />
International Affairs, Economic Development Report, No. 146, Harvard<br />
University, Cambridge.<br />
Ch<strong>in</strong>itz, B. (1961), Contrasts <strong>in</strong> Agglomeration: New York and Pittsburgh, American<br />
Economic Review, Vol. 51, pp. 279-289.<br />
Clark, K. B., Summers, L. H. (1979), Labour Market Dynamics and Unemployment: a<br />
Reconsideration, Brook<strong>in</strong>gs Papers on Economic Activity, pp. 13-72.<br />
Cyert, R. M., March, J. G. (1963), A Behavioral Theory of the Firm, Englewood Cliffs,<br />
Prentice Hall, New York.<br />
Döhrn, R., Heilemann, U. (1992), Zur allokativen Dimension: Sektorale<br />
Entwicklungsperspektiven für Ungarn, Polen und die CSFR, <strong>in</strong>:<br />
Wirtschaftsre<strong>for</strong>men <strong>in</strong> Mittel- und Osteuropa, Beiheft zur Konjunkturpolitik, Heft<br />
40, Berl<strong>in</strong>, pp. 51-69.<br />
Ell<strong>in</strong>ger, R. (1977), <strong>Industrial</strong> Location Behavior and Spatial Evolution, Journal of<br />
<strong>Industrial</strong> Economics, 25, pp. 295-312.<br />
49
Geldner, N. (1983), Der Problemfall alter Industriegebiete, <strong>in</strong>: Realisierung des<br />
österreichischen Raumordnungskonzeptes, Schriftenreihe Raumplanung für<br />
Österreich.<br />
Geldner, N. (1989), Das Altern von Wirtschaftsregionen, <strong>in</strong>: WIFO Monatsberichte,<br />
Vol. 5/1989, Vienna, pp. 346-356.<br />
Geldner, N. (1995), Evaluierung der steirischen Wirtschaftsförderung, WIFO, Vienna.<br />
Geldner, N. (1998), Erfolgreicher Strukturwandel <strong>in</strong> der Steiermark, <strong>in</strong>: WIFO<br />
Monatsberichte, Vol. 3/1998, Vienna, pp. 167-172.<br />
Haller, M., Höll<strong>in</strong>ger, F. (1994), Sozialstruktur Steiermark - Basisdaten zur<br />
Bevölkerungs- und Sozialstruktur der Steiermark und ihrer Entwicklung von 1961<br />
bis 2031, ARGE für Sozial<strong>for</strong>schung und Sozialplanung Steiermark (ed.), Graz.<br />
Hartmann, C., Habsburg-Lothr<strong>in</strong>gen, C., Kremshofer, A., Mörtlbauer, U., Pieber, E.<br />
(1998), F&E-Infrastruktur <strong>in</strong> den Zielgebieten der Steiermark, Joanneum<br />
Research, Graz.<br />
Hirsch, S. (1967), Location of Industry and International Competitiveness, Clarendon,<br />
Ox<strong>for</strong>d.<br />
Hirschman, A. (1958), The Strategy of Economic Development, Yale University<br />
Press, New Haven.<br />
Jacobs, D., de Man, A.-P. 1996, Clusters, <strong>Industrial</strong> Policy and Firm Strategy: a<br />
Menu Approach, Technology Analysis and Strategic Management 8, pp. 425-<br />
437.<br />
Joanneum Research, European Policies Research Centre (1998), (Jud, T., Sturn, d.,<br />
Downes, R., Rooney, M.-L.), The Regionalisation of RTD Policy - International<br />
Experience and <strong>Lessons</strong> <strong>for</strong> Austria, mimeo, Wien, Glasgow.<br />
K<strong>in</strong>dleberger, Ch. P. (1978), The Ag<strong>in</strong>g Economy, WA 114(3), pp. 407-421.<br />
Kirzner, J. M. (1980), The Primacy of Entrepreneurial Discovery, <strong>in</strong>: Institute of<br />
Economic Affairs (ed.), The Prime Mover of Process, London.<br />
Kub<strong>in</strong>, I., Ste<strong>in</strong>er, M. (1992), Labour Market Per<strong>for</strong>mance and Regional Types: A<br />
Conceptual Framework with Empirical Analysis of Austria, <strong>in</strong>: International<br />
Regional Science Review, Vol. 14, No. 3, pp. 275-298.<br />
50
Kuznets, S. (1958), Quantitative Aspects of the Economic Growth of Nations, Part 3,<br />
<strong>Industrial</strong> Distribution of Income and Labor Force by States, United States, 1919-<br />
1921 to 1955, Economic Development and Cultural <strong>Change</strong> 6, pp. 1-124.<br />
Machlup, F. (1958), Structure and Structural <strong>Change</strong>: Weaselwords and Jargon,<br />
Zeitschrift für Nationalökonomie, Vol. XVIII, pp. 280-298.<br />
Markusen, A. R. (1985), Profit Cycles, Oligopoly and Regional Development,<br />
Cambridge Mass./ London (MIT Press).<br />
Münz, R. (1999), Obersteiermark: Noch ist die Abwanderung nicht gestoppt, <strong>in</strong>:<br />
Kle<strong>in</strong>e Zeitung on January 28 1999, Graz.<br />
Nelson, R. / W<strong>in</strong>ter, S. (1982), An Evolutionary Theory of Economic <strong>Change</strong>,<br />
Harvard University Press, Cambridge, MA.<br />
Olson, M. (1982), The Rise and Decl<strong>in</strong>e of Nations, Economic Growth, Stagflation<br />
and Social Rigidities, Yale University Press, New Haven.<br />
Paierl, H. (1997), Competence Clusters, Leykam, Graz.<br />
Phelps, E. et al. (1970), Microeconomic Foundations of Employment and Inflation<br />
Theory, Macmillan, New York.<br />
Piore, M. (1975), Notes <strong>for</strong> a Theory of Market Stratification, <strong>in</strong>: Edwards, E. et al.<br />
(eds.), Labour Market Segmentation, Lex<strong>in</strong>gton.<br />
Prisch<strong>in</strong>g, M. (1985), Die Stagnation von Regionen und Branchen, E<strong>in</strong>e Theorie<br />
sozioökonomischer Anpassungsprozesse, Wirtschaft und Gesellschaft 11 (2),<br />
pp. 175-194.<br />
Prisch<strong>in</strong>g, M. (1986), Krisen: E<strong>in</strong>e soziologische Untersuchung, Böhlau, Wien.<br />
Radnitzky, G. (1984), Die ungeplante Gesellschaft, Hamburger Jahrbuch für<br />
Wirtschafts- und Gesellschaftspolitik, 29, pp. 9-33.<br />
Sallant, S. (1977), Search Theory and Duration Data: a Theory of Sorts, Quarterly<br />
Journal of Economics, pp. 39-57.<br />
Simon, H. A. (1959), Theories of Decision Mak<strong>in</strong>g <strong>in</strong> Economics. American Economic<br />
Review 49(3), pp. 253-283.<br />
Simon, H. A. (1983), Reason <strong>in</strong> Human Affairs, Stan<strong>for</strong>d University Press, Stan<strong>for</strong>d.<br />
51
Ste<strong>in</strong>er, M. (1981), Zur Aussagekraft von Normalstrukturmodellen, Empirica, Vol. 1,<br />
pp. 110-121.<br />
Ste<strong>in</strong>er, M. (1985), <strong>Old</strong> <strong>Industrial</strong> <strong>Areas</strong>: A Theoretical Approach, <strong>in</strong>: Urban Studies,<br />
Vol. 22, pp. 387-398.<br />
Ste<strong>in</strong>er, M. (1990), Good and Bad Regions?, <strong>in</strong>: Built Environment, Vol. 11, No. 8,<br />
pp. 483-498.<br />
Ste<strong>in</strong>er, M. (1990a), Regionale Ungleichheit, Böhlau, Wien/Köln.<br />
Ste<strong>in</strong>er, M. (1998b), The Discreet Charm of Clusters: An Introduction, <strong>in</strong>: Ste<strong>in</strong>er, M.<br />
(ed.), Clusters and Regional Specialisation, pp. 1-17, Pion, London.<br />
Ste<strong>in</strong>er, M., Belschan, A. (1991), Technology Life Cycles and Regional Types: An<br />
Evolutionary Interpretation and Some Stylized Facts, <strong>in</strong>: Technovation, Vol. 11,<br />
No. 8, pp. 483-498.<br />
Ste<strong>in</strong>er, M., Hartmann, C. (1998), Learn<strong>in</strong>g with Clusters: A Case Study from Upper<br />
Styria, <strong>in</strong>: Ste<strong>in</strong>er, M. (ed., 1998), Clusters and Regional Specialisation, Pion,<br />
London, pp. 211-225.<br />
Ste<strong>in</strong>er, M., Jud, T., Pöschl, A., Sturn, D. (1996), Technologiepolitisches Konzept<br />
Steiermark, Leykam, Graz.<br />
Ste<strong>in</strong>er, M., Posch, U. (1985), Problems of Structural Adaptions <strong>in</strong> <strong>Old</strong> <strong>Industrial</strong><br />
<strong>Areas</strong>: A factor-analytic Approach, Environment and Plann<strong>in</strong>g A 17, pp. 1127-<br />
1139.<br />
Ste<strong>in</strong>er, M., Sturn, d., Wendner, R. (1993), Wirtschaftspark Obersteiermark, Studie<br />
im Auftrag der Wirtschaftspark-Entwicklungs-GmbH, Graz<br />
Ste<strong>in</strong>er, M., Wendner, R. (1993), Alte Industriegebiete: Wo bleiben die Arbeitslosen?<br />
Untersuchung am Beispiel der Obersteiermark, <strong>in</strong>: Wirtschaft und Gesellschaft,<br />
vol. 19, No. 1, pp. 11-27.<br />
Tichy, G. (1979), Zahlungsbilanz- und beschäftigungsrelevante Strukturprobleme von<br />
Industrie und Gewerbe und Ansatzpunkte zu ihrer Überw<strong>in</strong>dung, Quartalshefte der<br />
Girozentrale 14(S1), pp. 77-131.<br />
Tichy, G. (1981), Alte Industriegebiete <strong>in</strong> der Steiermark <strong>–</strong> E<strong>in</strong> weltweites Problem<br />
ohne Lösungsansätze, Berichte zur Raum<strong>for</strong>schung und Raumplanung 25(3), pp.<br />
18-26.<br />
52
Tichy, G. (1986), Neue An<strong>for</strong>derungen an die Industrie- und Innovationspolitik <strong>in</strong><br />
Österreich, <strong>in</strong>: K. Aig<strong>in</strong>ger (ed.) Weltwirtschaft und unternehmerische Strategien,<br />
Fischer/WIFO, Stuttgart/Wien, pp. 65-90.<br />
Tichy, G. (1987), Entwicklungstendenzen und Strukturprobleme der Steirischen<br />
Wirtschaft, Research Memorandum 8701 der Nationalökonomischen Institute der<br />
Karl Franzens-Universität Graz.<br />
Tichy, G. (1994a), Überlegungen zum Leben nach dem Stahl, <strong>in</strong>: ÖIR (ed.), Raum,<br />
Vol. 13, Vienna, pp. 19-21.<br />
Tichy, G. (1994b), Schlagende Risiken. Die Sanierung der Obersteiermark - E<strong>in</strong>e<br />
Zwischenbilanz, <strong>in</strong>: Was - Zeitschrift für Kultur und Politik, Vol. 74, Mürzzuschlag,<br />
pp. 25-36.<br />
Tichy, G. (1994c), Vom vergangenen, laufenden und künftigen Strukturwandel: Zur<br />
Dynamik der steirischen Wirtschaft, <strong>in</strong>: Steirische Statistiken - 100 Jahre<br />
Landesstatistik, Amt der Steiermärkischen Landesregierung - Präsidialabteilung,<br />
Referat Statistik (ed.), Jg. 38, Graz, pp. 13-36.<br />
Tichy, G. (1998), Clusters: Less Dispensable and More Risky than Ever, <strong>in</strong>: Ste<strong>in</strong>er,<br />
M. (ed.), Clusters and Specialisation, pp. 226-237, Pion, London.<br />
Tödtl<strong>in</strong>g, F., Sedlacek, S. (1997), Regional Economic Trans<strong>for</strong>mation and the<br />
Innovation System of Styria, <strong>in</strong>: European Plann<strong>in</strong>g Studies, vol. 5, No. 1, 1997,<br />
Arl<strong>in</strong>gton, Ox<strong>for</strong>dshire, pp. 43-63.<br />
Vernon, R. (1966), International Investment and International Trade <strong>in</strong> the Product<br />
Cycle, QJE 80(2), pp. 190-207.<br />
Welfens, P.J.J. (1997), Osteuropäische Trans<strong>for</strong>mation, EU-Integrationsdynamik und<br />
Perspektiven der Osterweiterung, <strong>in</strong>: Cassel, D. (ed.), Europäische Integration als<br />
ordnungspolitische Gestaltungsaufgabe, Schriften des Vere<strong>in</strong>es für Socialpolitik,<br />
Band 260, Duncker&Humblot, Berl<strong>in</strong>.<br />
53
Source<br />
AK Steiermark, Regionalstatistik Steiermark 1998, Graz, 1998.<br />
LASTAT, Volkszählung 1991 - Ergebnisse III, vol. 1/96, Graz, 1996.<br />
ÖSTAT, Volkszählung 1971 - Ergebnisse Steiermark, Vienna, 1985.<br />
ÖSTAT, Volkszählung 1981 - Hauptergebnisse II Steiermark, Vienna, 1985.<br />
ÖSTAT, Volkszählung 1991 - Hauptergebnisse II Steiermark, Vienna, 1995.<br />
VOEST-Alp<strong>in</strong>e, under: www.voest.co.at. on July 29 th , 1999.<br />
Wirtschaftskammer Steiermark, 1999, Unternehmensneugründungen <strong>in</strong> der<br />
Steiermark 1993-1998, Graz.<br />
54